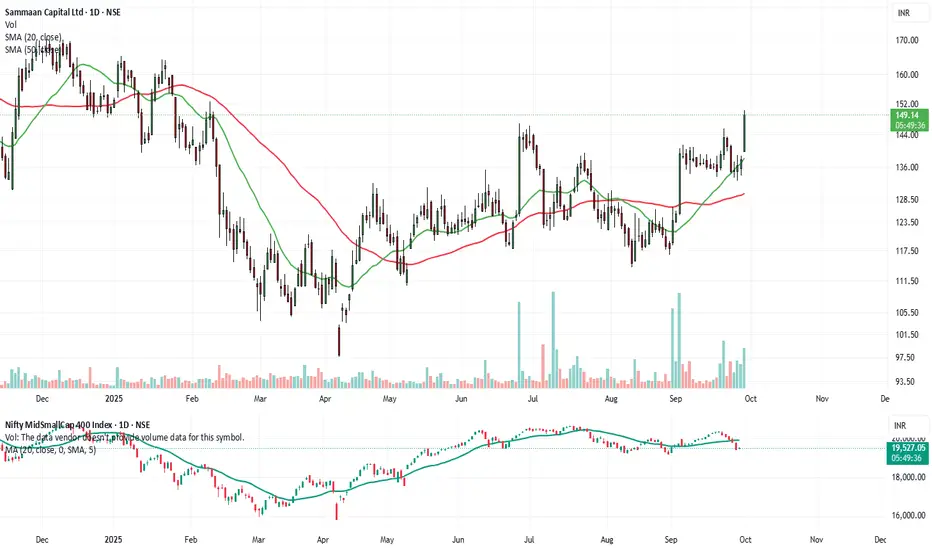
Swing Trade Journey- Trade 1: SamaancapEntered #Samaancap at ₹145
Stop Loss: ₹137–138
Position sizing as per plan. Now letting the setup play out.
Documenting every trade — wins, losses & lessons.
#TradingJourney #StockMarketIndia #SwingTrading
Next report date
—
Report period
—
EPS estimate
—
Revenue estimate
—
−31.85 INR
−18.07 B INR
84.58 B INR
789.24 M
About Sammaan Capital Ltd
Sector
Industry
CEO
Gagan Banga
Website
Headquarters
Mumbai
Founded
2005
ISIN
INE148I01020
FIGI
BBG004H4H997
Sammaan Capital Ltd. is a holding company, which engages in the operation of financing institutions which specializes in housing finance, real estate, and wealth management. It operates through the Investing and Financing Related Activities; and Fee Income segments. The Investing and Financing Related Activities segment involves in investing and financing related activities in various subsidiaries, financing of loans, and credit activities. The Fee Income segment comprises of financial service related fee from services income, commission on insurance, and other fee based activities. The company was founded by Sameer Gehlaut on May 10, 2005 and is headquartered in Mumbai, India.
Related stocks
BUY TODAY SELL TOMORROW for 5%DON’T HAVE TIME TO MANAGE YOUR TRADES?
- Take BTST trades at 3:25 pm every day
- Try to exit by taking 4-7% profit of each trade
- SL can also be maintained as closing below the low of the breakout candle
Now, why do I prefer BTST over swing trades? The primary reason is that I have observed that
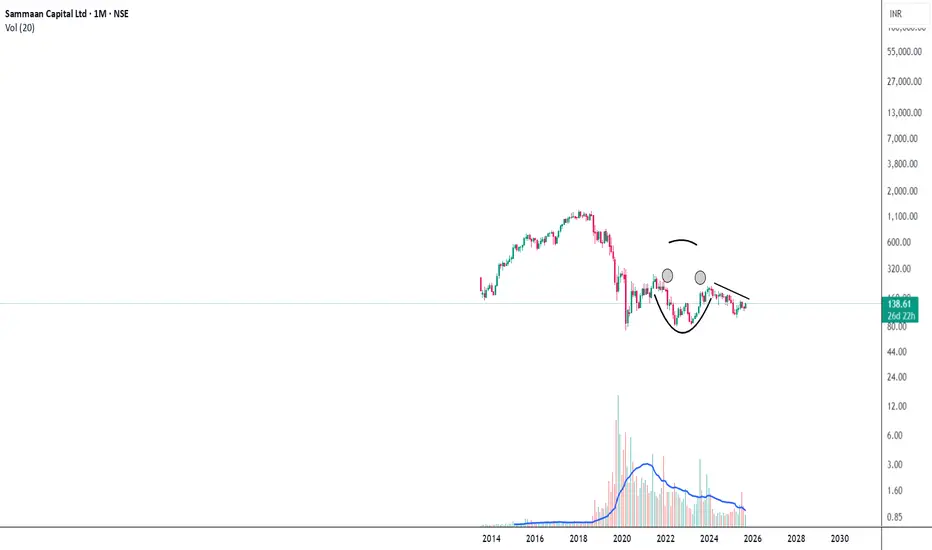
Sammaan Capital Ltd. Current Price is : 138In this chart you see the "SAMMAANCAP" candlestick chart where we this see that it looks something like a Cup & Handle Pattern.
We may see a big upside move once it breaks the trend line. ( Right Side )
I believe maybe in upcoming 3 months this price can cross 400.
This is no financial advic
SAMMAANCAPThe chart for SAMMAANCAP (NSE) is signaling a bullish breakout from a symmetrical triangle or wedge pattern, propelled by a sharp jump in price (+10.66%) and a substantial surge in trading volume, which often marks the start of upward momentum. Technical indicators reinforce this bullishness: the RS
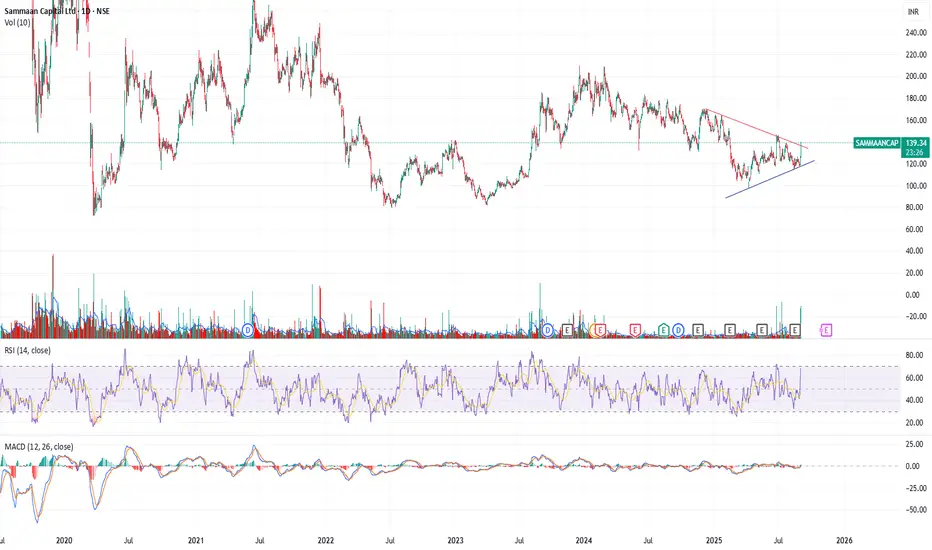
Samman capital good looking structure As you see in chart it's consolidated from last three years narrow the range of chart structure looking good in nera term because all supply zone looks tested now price ready to move.

SAMMANCAP LOOKS GOOD This stock looks good at these level i think in upcoming days i can clearly see the firework in this stock
buy and hold as per your risk apetitide
this is my view not any type of reccomandation
TQ -DKM SIR

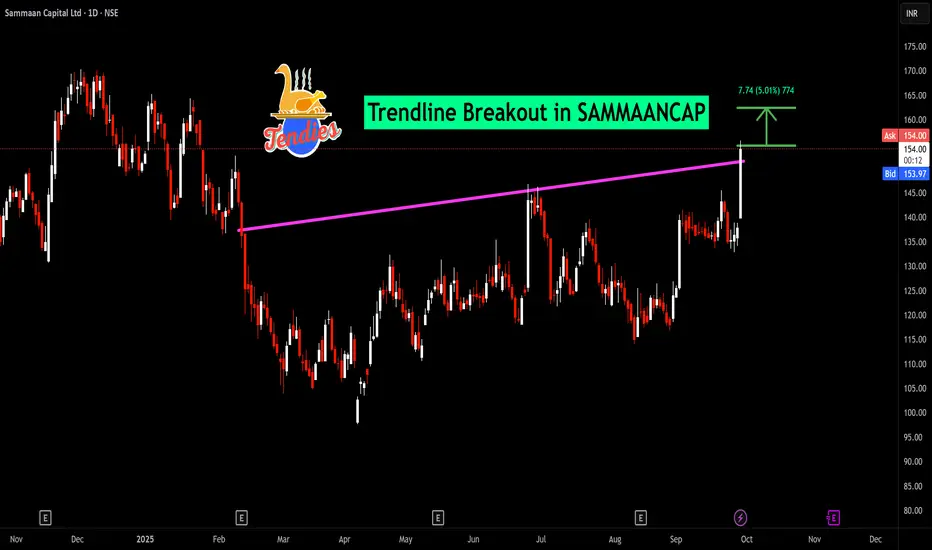
Bullish TrendLine BreakoutNSE:SAMMAANCAP
Range Breakout After 1 year of Consolidation in between the Line....Retesting the Upper Trend Line, Let's See...
If It's Make the Price action above the Trend Line than TGT would be 210rs-216rs⚡⚡

Sammaan Capital - Potential Bottoming out CandidateWith a poor result but excellent guidance..the stock seems to have formed a double bottom with a +I've RSI divergence.
Watch for this stock going ahead.
Long above 150 and further above the 200EMA which is around 160 currently..
I hope it falls once more to 133 and then bounces with a triple RS

High conviction stock - SAMMAANCAPCheck this stock which has made an all time low and high chances that it makes a "V" shaped recovery.
> Taking support at last years support or breakout level
> High chances that it reverses from this point.
> Volume dried up badly in last few months / days.
> Very high suspicion based analysis and

Breakout retested sammaanSamman capital breakout is retested.
CMP 158 target 206
Keep accumulating for long term 4 digit targets

See all ideas
Summarizing what the indicators are suggesting.
Oscillators
Neutral
SellBuy
Strong sellStrong buy
Strong sellSellNeutralBuyStrong buy
Oscillators
Neutral
SellBuy
Strong sellStrong buy
Strong sellSellNeutralBuyStrong buy
Summary
Neutral
SellBuy
Strong sellStrong buy
Strong sellSellNeutralBuyStrong buy
Summary
Neutral
SellBuy
Strong sellStrong buy
Strong sellSellNeutralBuyStrong buy
Summary
Neutral
SellBuy
Strong sellStrong buy
Strong sellSellNeutralBuyStrong buy
Moving Averages
Neutral
SellBuy
Strong sellStrong buy
Strong sellSellNeutralBuyStrong buy
Moving Averages
Neutral
SellBuy
Strong sellStrong buy
Strong sellSellNeutralBuyStrong buy
Displays a symbol's price movements over previous years to identify recurring trends.
Frequently Asked Questions
The current price of SAMMAANCAP is 169.55 INR — it has decreased by −0.90% in the past 24 hours. Watch Sammaan Capital Ltd stock price performance more closely on the chart.
Depending on the exchange, the stock ticker may vary. For instance, on BSE exchange Sammaan Capital Ltd stocks are traded under the ticker SAMMAANCAP.
SAMMAANCAP stock has risen by 18.38% compared to the previous week, the month change is a 28.65% rise, over the last year Sammaan Capital Ltd has showed a 3.92% increase.
SAMMAANCAP reached its all-time high on Jan 29, 2018 with the price of 1,283.85 INR, and its all-time low was 72.45 INR and was reached on Mar 20, 2020. View more price dynamics on SAMMAANCAP chart.
See other stocks reaching their highest and lowest prices.
See other stocks reaching their highest and lowest prices.
SAMMAANCAP stock is 7.08% volatile and has beta coefficient of 1.97. Track Sammaan Capital Ltd stock price on the chart and check out the list of the most volatile stocks — is Sammaan Capital Ltd there?
Today Sammaan Capital Ltd has the market capitalization of 131.70 B, it has increased by 18.71% over the last week.
Yes, you can track Sammaan Capital Ltd financials in yearly and quarterly reports right on TradingView.
Sammaan Capital Ltd is going to release the next earnings report on Nov 12, 2025. Keep track of upcoming events with our Earnings Calendar.
SAMMAANCAP net income for the last quarter is 3.34 B INR, while the quarter before that showed 3.24 B INR of net income which accounts for 3.17% change. Track more Sammaan Capital Ltd financial stats to get the full picture.
Yes, SAMMAANCAP dividends are paid annually. The last dividend per share was 2.00 INR. As of today, Dividend Yield (TTM)% is 1.24%. Tracking Sammaan Capital Ltd dividends might help you take more informed decisions.
As of Oct 1, 2025, the company has 4.58 K employees. See our rating of the largest employees — is Sammaan Capital Ltd on this list?
EBITDA measures a company's operating performance, its growth signifies an improvement in the efficiency of a company. Sammaan Capital Ltd EBITDA is 30.16 B INR, and current EBITDA margin is 95.58%. See more stats in Sammaan Capital Ltd financial statements.
Like other stocks, SAMMAANCAP shares are traded on stock exchanges, e.g. Nasdaq, Nyse, Euronext, and the easiest way to buy them is through an online stock broker. To do this, you need to open an account and follow a broker's procedures, then start trading. You can trade Sammaan Capital Ltd stock right from TradingView charts — choose your broker and connect to your account.
Investing in stocks requires a comprehensive research: you should carefully study all the available data, e.g. company's financials, related news, and its technical analysis. So Sammaan Capital Ltd technincal analysis shows the strong buy rating today, and its 1 week rating is buy. Since market conditions are prone to changes, it's worth looking a bit further into the future — according to the 1 month rating Sammaan Capital Ltd stock shows the buy signal. See more of Sammaan Capital Ltd technicals for a more comprehensive analysis.
If you're still not sure, try looking for inspiration in our curated watchlists.
If you're still not sure, try looking for inspiration in our curated watchlists.