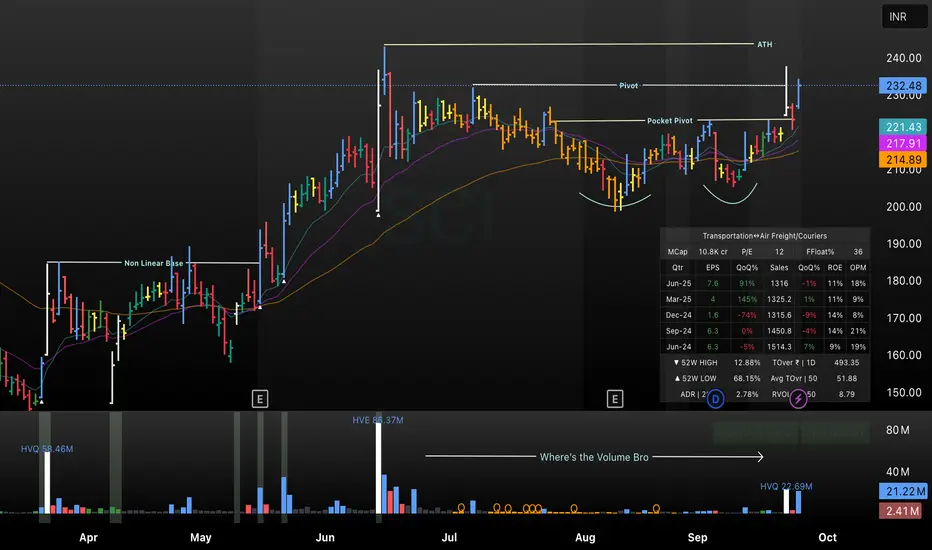
SCI | Pocket Pivot & ATH Breakout after Non-Linear Base | This TradingView chart of SCI highlights a non-linear base formation followed by a powerful pocket pivot and a breakout to all-time highs (ATH) in September 2025. The annotated chart showcases key technical structures: a pivot, pocket pivot level, and the ATH breakout, along with the moving averages (EMA 10, 20, 50). Volume analysis points to a “Where’s the Volume?” zone before the breakout. A mini fundamental dashboard displays quarterly financials and sector statistics, providing a holistic setup for position or swing traders.
SCI trade ideas
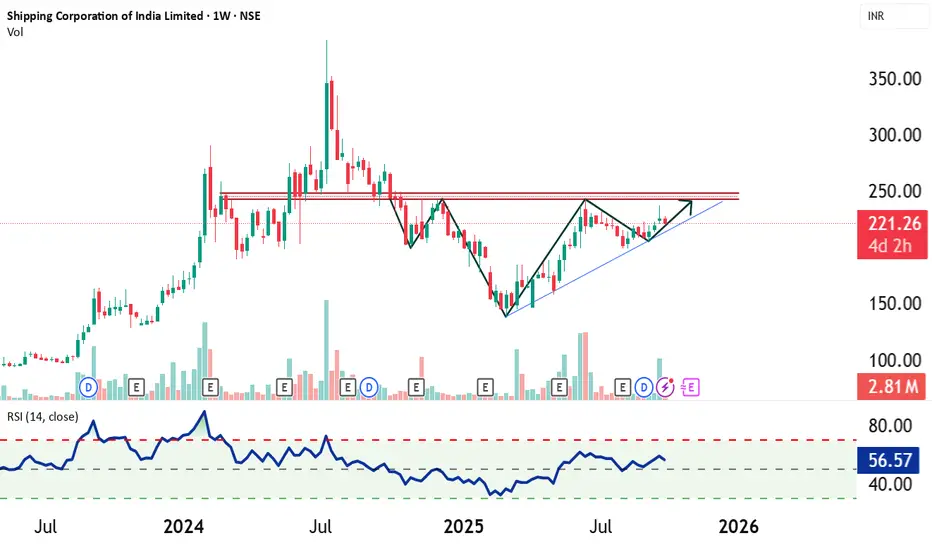
Shipping Corporation of India - Forming Bullish Head & Shoulder📈 Chart Analysis: On the weekly chart, Shipping Corporation of India (SCI) is showing signs of forming a "Bullish inverted head and shoulders pattern" , which is typically a reversal structure that signals the resumption of an uptrend. The neckline resistance is placed near ₹245–₹250 levels, and a decisive breakout above this zone could unlock strong upside momentum.
📊 Trend & Support: The stock is trading along an established uptrend line, which acts as a "Dynamic Support Level" . This trendline has been respected multiple times, reinforcing its validity. As long as the price sustains above this trendline, the bullish structure remains intact.
🔎 Momentum Indicators: RSI (Weekly) is currently around 56, showing neutral-to-positive momentum with room for further upside. Volumes have shown accumulation on upward moves, suggesting buying interest on rallies.
⚠️ Disclaimer:
This is a technical projection, not an investment recommendation. Any trading strategy should be established based on risk appetite, confirmation signals, and individual financial goals.
✍️ Prepared by: SEBI Certified Research Analyst (Not Registered)
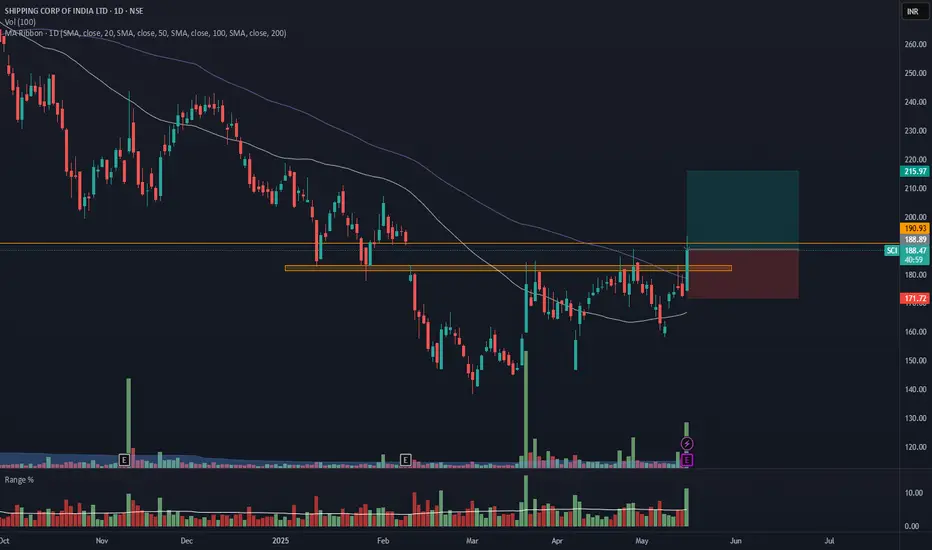
SHIPIING CONTAINERS INDIA - SCI - Breakout from DTFShipping Containers India has resistance weakening on the Daily charts and has given a breakout with good volume.
The target of this pattern signals an upside potential of 15% from the current price level in the medium term.
The stock is trading above its 50- and 100-day exponential moving averages (EMAs). The range is more than 2X, and the Volume is also 3.5X the average.
There is an old support level acting as resistance, which is why the stock won't go over 191. To be safe, wait for the closing price. If it is above 191, it's good.
CMP- Rs. 188
Target Price- Rs216 ( 15% upside)
SL - 171
Disclaimer: This is not a buy/sell recommendation. For educational purpose only. Kindly consult your financial advisor before entering a trade.
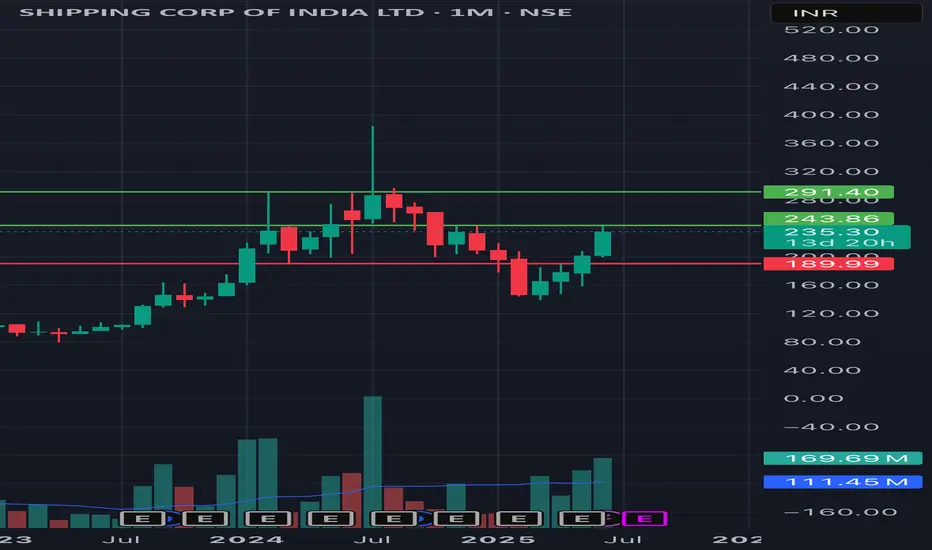
SCIChart showing bullish strength on week and monthly time frame with Three White Soldiers candlestick pattern on MTF
Next immediate Resistance at 240 ~ 245 . After breakout next Resistance @ 290
Support at closing basis 190
BUY TODAY SELL TOMORROW for 5%DON’T HAVE TIME TO MANAGE YOUR TRADES?
- Take BTST trades at 3:25 pm every day
- Try to exit by taking 4-7% profit of each trade
- SL can also be maintained as closing below the low of the breakout candle
Now, why do I prefer BTST over swing trades? The primary reason is that I have observed that 90% of the stocks give most of the movement in just 1-2 days and the rest of the time they either consolidate or fall
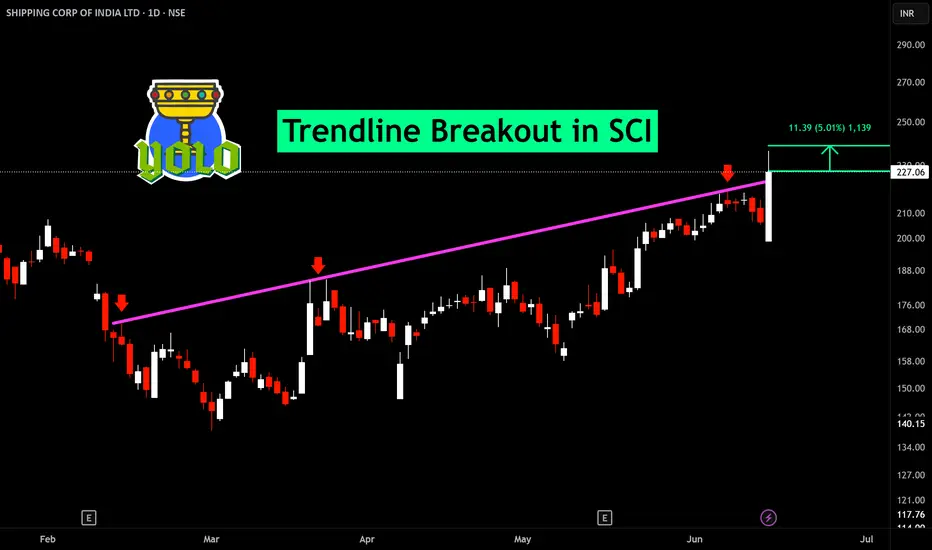
Trendline Breakout in SCI
BUY TODAY SELL TOMORROW for 5%
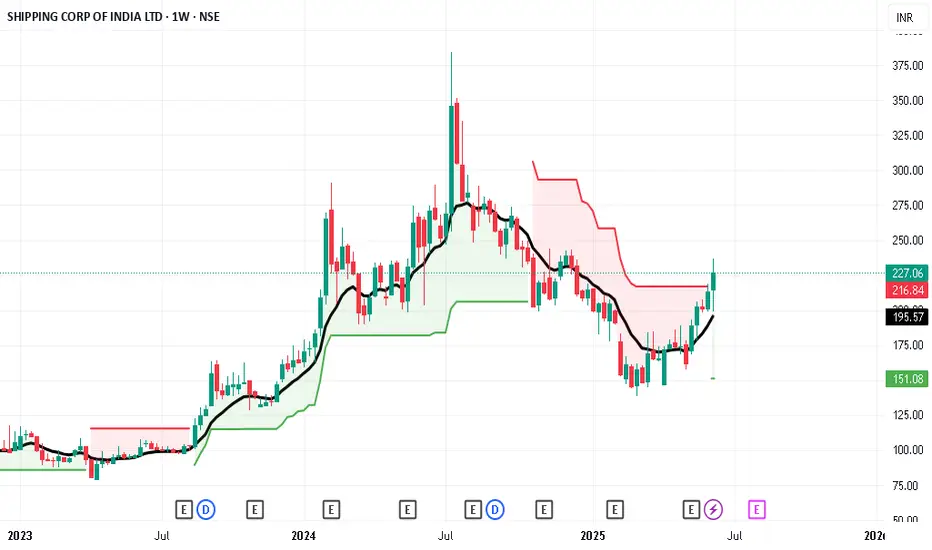
Long SCISupertrend has turned bullish on the weekly chart, and the current closing price is trading above the 10 EMA
BUY SCI
Entry - 255
SL - 158
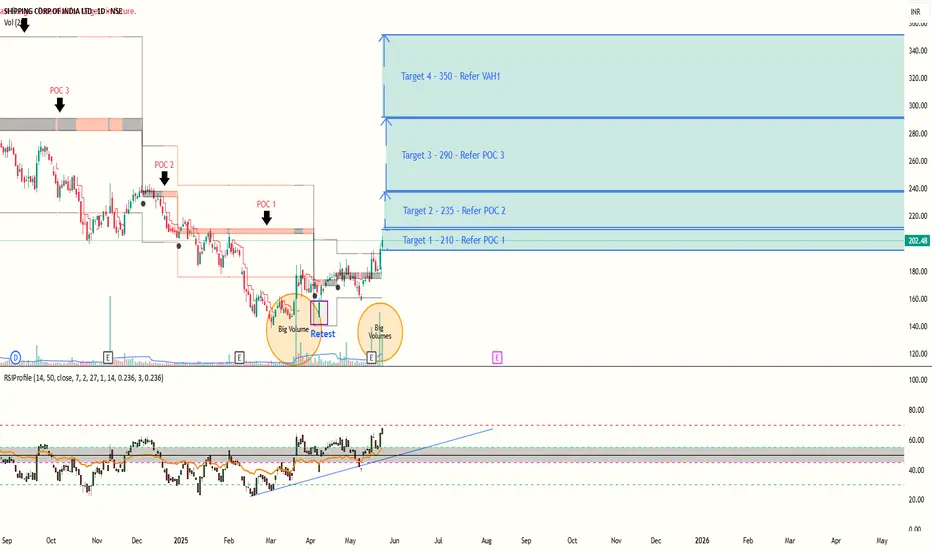
Shipping Corporation of India - Value Buying and Bullish trendShipping Corporation of India had retraced almost 61.8 % from highs near the lows, after a period of accumulation where there were continous responsive buyers at lows. The price started moving up.
Volumes : Volumes can be confirmed with the circles plotted on chart.
Retest : The retest of price happened highlighted by the rectangle.
Initiative Buyer : we can see big volumes coming after the retest happened and price started moving above POC - Point of control of current range. This suggest a strong support zone below even if the price retraces a bit eventual trend is up.
From the previous point of controls and value area highs we can set targets for upcoming upmoves :
Targets :
1)210
2)235
3)290
4)350
There should be strong support around Point of control and value area low of current range, in case of SL hunting of weak hands.
Still shows a relatively low risk opportunity with potential for high reward.
PS : Post is educational in nature and doesn't constitute any financial or buy sell advice. Do your own research. The publication is made with the intention to explain the concepts of RSI Hybrid Profile.
Indicator
Long SCI Target 384 (122%)
Risk 138.26 (22%)
Holding Horizon 6-8 months.
Core Rationale: SCI presents a potential turnaround and growth opportunity driven by recent institutional interest, positive technical signals, and potential sector tailwinds stemming from geopolitical trade shifts, although significant risks and counterarguments exist.
Key Points & Analysis:
Institutional Interest - Quant Mutual Fund Entry:
A significant positive signal is the recent entry of Quant Mutual Fund, specifically via its Quant Small Cap Fund.
In March 2025, the fund added approximately 2.66 million shares of SCI, representing about 0.57% of the company's equity at that time.
While overall mutual fund holdings in SCI haven't drastically changed recently, the specific addition by a prominent fund known for its dynamic strategies indicates renewed institutional interest in the stock at current levels.
Shipping Industry Cycles - A Nuanced View:
The idea of a predictable 20-year cycle in shipping holds some historical weight, particularly in the era of sail and early steam (pre-1850s).
However, modern analysis (like the Goulielmos study based on Stopford) indicates that post-World War II, shipping cycles have become significantly shorter, averaging around 7 years, largely due to faster shipbuilding, technological advancements, and quicker market reactions to global events.
Recent cycles were influenced by the 2008 financial crisis and the 2020-2021 COVID-19 pandemic disruptions and subsequent demand surge.
Geopolitical Tailwinds - The China Tariff Factor:
The reignited US-China trade war in early 2025, with significant tariff escalations (e.g., 145% US tariffs on certain Chinese goods, 125% Chinese tariffs on US goods), creates potential shifts in global trade flows.
There's speculation that countries like India could benefit as businesses seek to diversify supply chains away from the US-China axis ("China+1" strategy). India currently enjoys a temporary reprieve from higher US reciprocal tariffs.
This could potentially increase demand for Indian shipping routes and services offered by companies like SCI if global manufacturers reroute trade.
Major Caveat: This potential benefit is highly speculative and significantly counterbalanced by the risk of a broader global economic slowdown or recession triggered by the trade war. A general contraction in global trade would likely hurt the entire shipping sector, including SCI, possibly outweighing any gains from trade diversion.
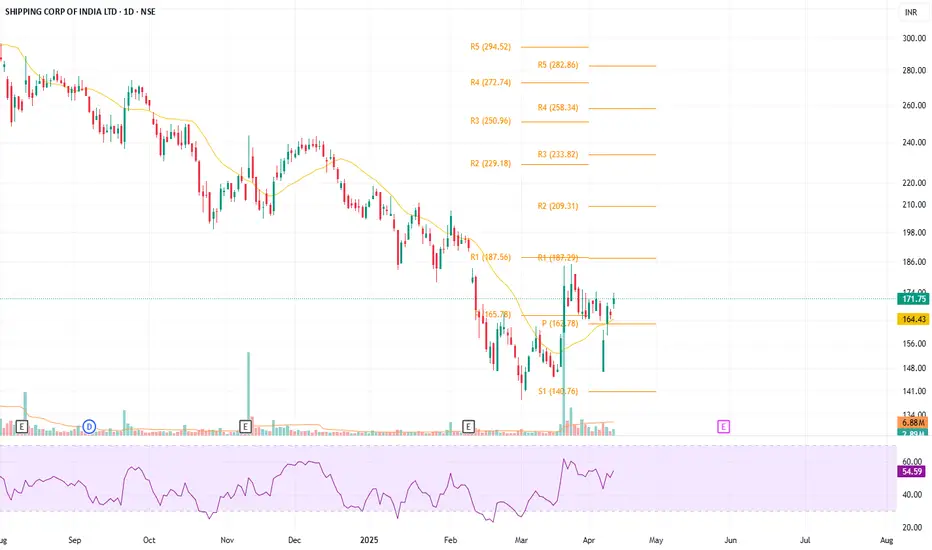
Technical Picture (Based on Provided Chart & Recent Data):
Rebound: SCI's stock price found solid support around the ₹140 level (S1 Pivot) in late February/early March 2025 after a multi-month downtrend.
Short-Term Strength: The price has recently broken above its 20-day Simple Moving Average (around ₹166.43) and the daily Pivot Point (around ₹165.70). The RSI (Relative Strength Index) has moved into neutral territory (~54.59), indicating the bounce has momentum but isn't yet overbought. Recent up-moves have been supported by increased volume.
Resistance Ahead: Key hurdles lie ahead. The first major resistance (R1 Pivot) is around ₹183. Longer-term moving averages are likely still above the current price, suggesting the longer-term downtrend isn't fully broken.
Outlook: The technicals suggest a short-term bottom may be in place, offering potential for further recovery towards the ₹183 mark initially.
Fundamental Considerations:
Recent Performance: It's important to note that SCI's recent financial performance has been weak. Net profit and revenue declined significantly in the December 2024 quarter compared to the previous year. Analysts' ratings (e.g., MarketsMojo upgrade to 'Hold' in late 2024) reflect a cautious stance.
Valuation & Debt: On the positive side, the company generally maintains a low debt-to-equity ratio. Valuations might be considered attractive by some after the price correction, especially relative to asset value (though profitability metrics are key).
Divestment Overhang: Potential government divestment plans could also influence the stock price, creating both opportunities and uncertainties.
Conclusion & Strategy:
A long position in SCI at current levels (around ₹170-175) is a speculative play based on:
Confirmation Bias: Quant MF's entry provides institutional validation.
Technical Reversal: Signs of a short-term bottom and upward momentum.
Sector/Geopolitical Bet: Hope that SCI benefits from defense/shipbuilding sentiment and potentially from global trade re-alignments due to tariffs, despite the significant risks.
SCI(Shipping Corporation of India) Analysis!NSE:SCI – Double Bottom Pattern Forming a Bullish Reversal?
📊 Chart Pattern:
A Double Bottom pattern has been identified on the daily chart of Shipping Corporation of India (SCI), indicating a potential trend reversal from the recent downtrend.
🔍 Key Observations:
Falling Bottom & Rising Bottom:
The first bottom formed at a lower level, followed by a second bottom at a slightly higher level, aligning with bullish RSI divergence (indicating possible strength in the price action).
Neckline Breakout Level:
The neckline of the pattern is around ₹169-172, which serves as the critical resistance level. A breakout above this level could confirm a bullish move.
Projected Target:
The pattern height projection suggests a potential target of ₹193.65 upon a successful breakout.
EMA Resistance Levels:
The price is currently below the 50 EMA (₹198.76), 100 EMA (₹212.83), and 200 EMA (₹218.62). A breakout above these levels would further strengthen the bullish outlook.
RSI Recovery:
The Relative Strength Index (RSI) is recovering from oversold levels, currently at 42.38, suggesting that bullish momentum is slowly building.
📈 Trading Plan:
A confirmed breakout above ₹169-172 with strong volume could indicate a further bullish rally toward the ₹193-195 zone.
Stop-loss: Below the second bottom level to manage risk.
Watch EMA Levels: The stock needs to sustain above key moving averages to continue upward momentum.
Disclaimer: Consider my analysis for educational purposes only.
Before entering any trade:
1️⃣ Educate Yourself – Understand market dynamics and technical patterns.
2️⃣ Do Your Own Research & Analysis – Never rely solely on external opinions.
3️⃣ Define Your Risk-Reward Ratio – Ensure your trade aligns with your risk appetite.
4️⃣ Never Trade with Full Capital – Always manage risk and preserve capital.
Trade wisely! ✅📊

sci ltd long momentumShipping Corporation of India Ltd. (SCI) is a leading Indian shipping company headquartered in Mumbai, operating a diverse fleet that includes crude oil tankers, bulk carriers, product tankers, container vessels, and passenger-cum-cargo vessels.
**Fundamental Analysis:**
- **Financial Performance:**
- **Revenue Growth:** Over the past five years, SCI has experienced a modest annual sales growth of 5.43%. citeturn0search2
- **Profitability:** The company reported a 43.8% year-over-year decline in net profit for the third quarter of fiscal year 2025. citeturn0search3
- **Return on Equity (ROE):** SCI's ROE over the last three years stands at 11.1%, indicating moderate profitability. citeturn0search2
- **Debt and Liabilities:**
- **Contingent Liabilities:** The company has contingent liabilities amounting to ₹5,241 crore, which could impact its financial stability. citeturn0search2
- **Dividend Policy:**
- SCI has maintained a low dividend payout ratio, distributing approximately 2.77% of its profits over the past three years. citeturn0search2
**Technical Analysis:**
- **Stock Performance:**
- **Current Price:** As of February 21, 2025, SCI's share price is ₹161.49. citeturn0search6
- **52-Week Range:** The stock has traded between ₹147.00 and ₹384.80 over the past year. citeturn0search7
- **Volatility:**
- SCI exhibits a beta of 2.47, indicating higher volatility compared to the broader market. citeturn0search4
**Support and Resistance Levels:**
- **Support Level:** The immediate support is around ₹155.00.
- **Resistance Level:** The immediate resistance is near ₹160.00.
**Conclusion:**
SCI has demonstrated modest revenue growth and profitability, with a low dividend payout ratio. The company's higher beta suggests increased volatility, which may appeal to investors with a higher risk tolerance. The presence of significant contingent liabilities warrants caution. Investors should monitor SCI's financial health, market conditions, and strategic initiatives when considering investment decisions.

Positional or Long term Opportunity in Shipping Corp Of IndiaGo Long @ 205.7 for Targets of 241.1 and 276.5 with SL 188
Reasons to go Long :
1. On a Weekly timeframe if we draw the Fibonacci retracement tool from the recent swing low (point A) to the recent swing high (point B) then we see stock took support from the 0.618 Fibonacci level.
2. Besides, a bullish candlestick pattern Bullish Hammer (marked with orange) is formed around the 0.618 Fibonacci level.
3. Also there is a strong Trendline (marked with green color) which supports the stock.
4. In addition to this there is a strong support zone (marked with purple) from which the stock is taking support.

SCI Trading Within Tested Demand ZoneSCI is trading at ₹204.45, within its tested demand zone of ₹208.45 to ₹202.05, established on 30th October 2024. As the zone has been tested, it suggests prior buying interest in this range. Investors may look for potential bullish signals or confirm further price stability before acting.
Disclaimer: This analysis is for informational purposes only and should not be considered as financial advice. Please conduct your own research or consult a financial advisor before making any investment or trading decisions.

SCI 230, POSSIBLY LOOKING FOR A TURN BACK TO 250+ Shipping Corporation of India (SCI) has shown a potential breakout on the daily time frame as it surpasses the ₹230 level. This price point previously acted as a resistance, and the breakout indicates bullish momentum, supported by increased trading volume. Analysts suggest further upside if the stock sustains above this level, with key targets around ₹245 and ₹260. However, if it falls below ₹230, a retest of ₹220 is possible.
Technical Highlights:
1. Momentum Indicators: RSI is near 50, showing room for further movement.
2. Trend Confirmation: Sustained closing above ₹230 strengthens the bullish trend.
3. Support Zone: ₹220 serves as immediate support.
Statutory Warning:
Trading and investing in stocks are subject to market risks. This is not investment advice. Always do your own research (DYOR) or consult a certified financial advisor before making decisions.


SCI - For Long Term Shipping Corporation of India is the largest Indian shipping company in terms of capacity with a diversified fleet profile. It is involved in the business of transporting goods and passengers.
Stock P/E - 15.0 < Industry PE - 20.5
OPM - 29.3 %
FII holding - 4.56 %
DII holding - 8.69 %
Promoter holding - 63.8 %
The stock has fallen down around 40% from it's ATH. Currently the stock has taken a beautiful support from horizontal support zone as well as support trendline.
Targets - 273, 289, 323, 348
SL - 228
Entry above 246
Not a buy/sell recommendation. Shared only for learning purpose.

Stock in the Demand Zone: Shipping Corporation of IndiaSCI has been in a downtrend since the second week of July 2024.
It has fallen significantly from the peak value of 345 to 258 levels.
In the last few sessions, it has significantly increased along with decent volume buildup and broke the previous resistance of 260 levels.
Resistance levels: 291, 328.
Support levels: 265, 240, 217 levels.

Shipping Corporation of India LtdDate 13.09.2024
Shipping Corporation of India
Timeframe : Day chart
Introduction :
SCI is today the only Indian shipping Company operates in three segments viz. Bulk Carrier & Tankers, Liner & Passenger Services and technical & off-shore. In addition, the SCI mans and manages a large number of vessels on behalf of various government departments and organizations.
Technical Remarks :
1 Formed ascending triangle
2 Broke the neckline but retraced back sharply from 161% extension
3 Broke the ascending triangle recently & there's negative crossover between 20 & 60 ema
4 After breaking down approaching /close to 200 ema
5 61% golden ration of retracement + 200 ema are close by extending good technical support
6 At lower/support range of rsi
Fundamental Remarks :
1 Has ROA of 5.46 % which is a bad sign for future performance
2 ROE of 9.18 % - Low
3 Debt to Equity ratio of 0.42 which means company has low proportion of debt on its capital
4 Reported revenue growth of -12.91 % which is poor in relation to its growth and performance
5 The company has delivered a poor sales growth of 5.43% over past five years
6 Divestment is facing hurdles due to pension scheme and court case over non-payment of medical dues to employees
7 Operating margin for the current financial year is 28.21 % - Good
8 DII holding = 8.69% & FII holding = 4.56% & Promoter holding = 63.75% & Public holding = 23%
9 DEBT ₹ 2,893.37 Cr
Regards,
Ankur

Breakout retest in sciAll shipping stocks have given breakouts and are ready to move upside
For
Educational purpose only
Self explanatory chart

Long SCI swing TradeA Good setup has been seen on the daily chart of SCI. Long SCI above 274 for the target of 350+ with SL of 242. A very high probability that the stock will bounce back from the 200 EMA & the marked resistance area. Good risk to reward trade. hence keep the stock at your watchlist. This is for your educational purpose only.

SCI Can be Long term Buy for 3x Targets in 5 YearsSCI Can be Long term Buy for 3x Targets in 5 Years
SCI has given Monthly Breakout above 220 Levels & Looking strong on Monthly charts.
LTP - 257
Targets - 800+
Timeframe - 4-5 Years
GOI holding 63% stake in SCI & good Profit making company.
Happy Investing.

SCI FOR 290+The Shipping Corporation of India (SCI) is a public sector undertaking that operates and manages vessels servicing both national and international lines. It is under the ownership of the Government of India and under administrative control of the Ministry of Ports, Shipping and Waterways, with its headquarters in Mumbai.
In recent Quarterly updates i see a good result of Shipping crop India and stock recently corrected from his All-time high and now ready to roar again.
So, If following the candles on closing basis.
CMP: 275
TARGET: 290/293
SL: 260
Note: This is not stock recommendation this is only for educational purpose.

Just A View - At Support - SCI📊 Script: SCI
📊 Sector: Shipping
📊 Industry: Shipping
Key highlights: 💡⚡
📈 Script is trading at support level which is near 280 which was previously working as resistance, we may see some good rally from here.
📈 One can go for Swing Trade.
⏱️ C.M.P 📑💰- 285
🟢 Target 🎯🏆 - 300/330
⚠️ Important: Always maintain your Risk & Reward Ratio.
✅Like and follow to never miss a new idea!✅
Disclaimer: I am not SEBI Registered Advisor. My posts are purely for training and educational purposes.
Eat🍜 Sleep😴 TradingView📈 Repeat 🔁
Happy learning with trading. Cheers!🥂

SHIPPING CP INDIA-2- Stay Long- AccumulateSHIPPING CORPORATION OF INDIA; CMP: 205.85; RSI:40.20
Recent correction into the market, because of uncertain environment at home, has given good opportunity for new investor to take a position in the script. The script is in sideways flat consolidation with ABCD correction pattern. Soon the script will be out from the consolidation zone. Its good time to accumulate the script, between Rs: 188 to 210 zone; stop loss: 167 . Upside breakout will be confirmed once script closes above 238.5.
Near Term Target 1: 280; (1 months’ time frame); Medium Term Traget 2 : 330-351 (4 months’ time frame)
✅Like & boost the idea and follow to never miss a new idea!✅
