SCI big move aheadHey Family, there is a one more stock Which is showing a great opportunity.
Key Points:-
* Forming Ascending Triangle Pattern in daily TF.
* From Feb 2024 to July 2024 Tested Resistance Many times.
* It's Already Break resistance Zone and trying to Sustain Above Resistance Zone.
* Volume Accumulation (Volume is Rising).
What is your view please comment it down and also boost the idea this help to motivate us. We are Certified. All views shared on this channel are my personal opinion and is shared for educational purpose and should not be considered advise of any nature.
SCI trade ideas

SCI - 3 Months Downtrend Breakout Shipping Corporation of India Ltd
1) Time Frame - Weekly.
2) The Stock has been in a Downtrend since (February, 2024). Now It has given a Downtrend breakout & Closed with good bullish momentum candle & with good volume in weekly Time Frame.
3) The next resistance would be It's previous Life Time High (290.75 - 10.75% from the price 262.50).
5) Recommendation - Strong Buy

SHIPPING CORPORATION OF INDIA READY FOR BREAKOUT The stock has been forming a cup and handle pattern 273-283 will act as a crucial resistance for the stock however the future looks pretty optimistic for the stock , the stock can rally till the 376 levels very quickly
We can expect good upward momentum in the stock in the coming days , 250 must be the stop loss

SCI near break out levelSCI near breakout level. the level is 274.60, above the sustained 20 % upside potential.
TARGET 1 - 290
SL - 264
follow risk reward.
Disclaimer -
videos, presentations, and writing are only for educational purposes and are not intended for investment advice. I can't promise the accuracy of any information provided. please consult with your financial advisor.

Shipping Corporation Of India Ltd - Breakout Setup, Move is ON..#SCI trading above Resistance of 268
Next Resistance is at 418
Support is at 171
Here are previous charts:
Chart is self explanatory. Levels of breakout, possible up-moves (where stock may find resistances) and support (close below which, setup will be invalidated) are clearly defined.
Disclaimer: This is for demonstration and educational purpose only. This is not buying or selling recommendations. I am not SEBI registered. Please consult your financial advisor before taking any trade.

Shipping Corporation Of India Ltd - Long Setup, Move is ON...#SCI trading above Resistance of 199
Next Resistance is at 268
Support is at 150
Here is previous chart:
Chart is self explanatory. Levels of breakout, possible up-moves (where stock may find resistances) and support (close below which, setup will be invalidated) are clearly defined.
Disclaimer: This is for demonstration and educational purpose only. This is not buying or selling recommendations. I am not SEBI registered. Please consult your financial advisor before taking any trade.

Price in RangePrice is in Symmetrical triangle pattern.
Wait for the upper trendline breakout with conformation candle.
If breaks the trend line can be good setup and if candle low gets broken then wait for the next ret price retracement for the price to breakout the trendline zone in either direction.
NOTE: I do my analysis, do your before trade.

SCI Triple top | Triangle pattern breakoutSCI
Pattern: Triple top | Triangle pattern
Looking good above 240.
TGT 1: 260
TGT 2: 290
SL 215
RSI and MACD showing good movementum.
No BUY/SELL recommendations, learning only. NSE:SCI
Note: Earnings release in next 12 days, watch out carefully.

BUY TODAY SELL TOMORROW for 5%DON’T HAVE TIME TO MANAGE YOUR TRADES?
- Take BTST trades at 3:25 pm every day
- Try to exit by taking 4-7% profit of each trade
- SL can also be maintained as closing below the low of the breakout candle
Now, why do I prefer BTST over swing trades? The primary reason is that I have observed that 90% of the stocks give most of the movement in just 1-2 days and the rest of the time they either consolidate or fall
Inverted H&S Breakout in SCI
BUY TODAY SELL TOMORROW for 5%

SCI at break out with volumeSCI at break out level. 235 is major resistance if SCI breaks and sustains above level then SCI can move to 247 level.
1st target - 247
2nd target - 280
SL - 222
follow risk reward.
Disclaimer -
videos, presentations, and writing are only for educational purposes and are not intended for investment advice. I can't promise the accuracy of any information provided. please consult with your financial advisor.

Double Bottom Breakout - Keep An Eye - SCI📊 Script: SCI
📊 Sector: Shipping
📊 Industry: Shipping
Key highlights: 💡⚡
📈 Script is going to give breakout of Double Bottom on daily chart keep an eye on stock, breakout is above 235.
📈 Script is trading at upper band of BB.
📈 MACD is giving crossover .
📈 Already Crossover in Double Moving Averages.
📈 Right now RSI is around 61.
📈 One can go for Swing Trade.
BUY ONLY ABOVE 235
⏱️ C.M.P 📑💰- 232
🟢 Target 🎯🏆 - 254
⚠️ Stoploss ☠️🚫 - 223
⚠️ Important: Always maintain your Risk & Reward Ratio.
✅Like and follow to never miss a new idea!✅
Disclaimer: I am not SEBI Registered Advisor. My posts are purely for training and educational purposes.
Eat🍜 Sleep😴 TradingView📈 Repeat 🔁
Happy learning with trading. Cheers!🥂

SCI sci pattern break outdone, retest and candle stick confirmation done, targets given stop loss mentioned below horizontal line


Triangle breakout above 232.Primary 5 intermediate 5 is about to being once we get a wave 4 triangle breakout.Price above 232 would be a signal to go long with a stop-loss of 203 for a target of 300+ level.
Disclaimer:This are just my views on the stock,no postion should solely be taken on its basis.posting this for my future reference.

SCI - MONTHLY BREAKOUT AFTER 15 YEARSStock is given a very good break out after 15 years.
Good Potential for Long
Expected Return 15%...25%...35%...45%
Strong Support is around 188-190

SCI closed above strong resistance keep in radar-closed above strong resistance
-strong support from 50 EMA from lower levels
-rise in volume + RSI shows strength in momentum
-ADX rising MACD crossover done
-multiple confirmation keep on radar it can give good profit

Some Break out Stocks Check Comment Also Some Break out Stocks Check Comment Also and you Can Find some Stocks Near Breakout

Shipping CP IndiaShipping CP India is making a huge Breakout in Monthly Timeframe, which is alomst 18 Yrs Breakout.
Weekly Timeframe confirms with a follow up candle.
Its a Buy on Dips Stock.
Buy at proper Demandzone for proper Riskreward. Better buy at retracement.

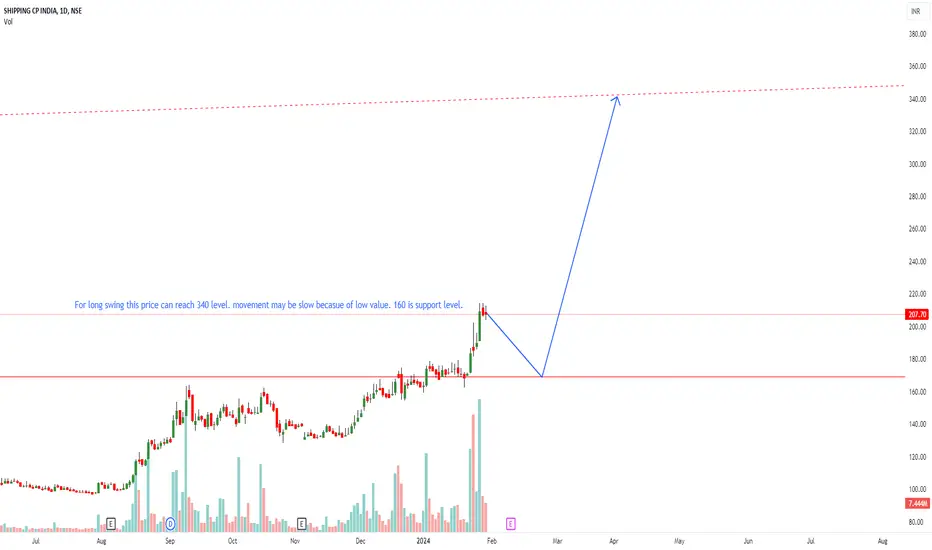
SCIFor long swing this price can reach 340 level. movement may be slow becasue of low value. 160 is support level.
15 Year Breakout Stock !!Sci Breakout of 15 year Resistance, we see good upmove
Keep on radar, looking good

Shipping Corporation of India - Multi Year Breakout Multi year breakouts are indication of long-term trend change in a stock. It signifies investors perception change about a stock. Generally it has been seen that after multi-year breakout stock rally more than twice or thrice from the current price.
The stock chart of Shipping corporation of India has been shared in this illustration. The stock is giving all time high breakout of around 170 after almost 15-years on daily, weekly and monthly time frame. The daily chart breakout has been confirmed but weekly and monthly chart breakout will come today and by end of this month respectively.
Disclaimer: The stock shared is only for educational purpose and does not involved any buying or selling recommendations.

SCI, CMP 174Shipping corporation of India.
1. Multiyear breakout after 2008
2. Circular base.
3. Do your Research.

SHIPPING CORPORATION OF INDIASHIPPING CORPORATION OF INDIA (Monthly Chart )
Roaming into the 15 years long resistance zone of 172-175.
Sustain above this zone will take it into the free sky
Rising container freight charges are positive for the shipping companies.
#technicals #StocksToBuy #stocks #StockMarkets #investing #Index #Nifty #nifty50 #observation #Breakout #BreakoutStock
