SCI trade ideas

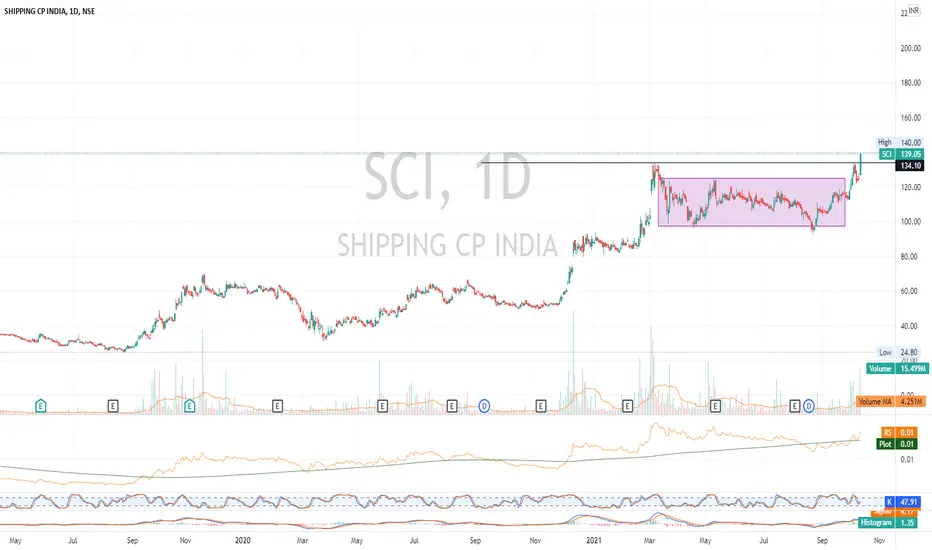
SCI | Narrow range breakout. Potential to earn 20% plus Day breakout strategy:
CMP: 142
SL: 141.45
Target: 162.85
( Targets calculated on basis of Fib.)
Disclaimer:
I am not a SEBI registered analyst. My studies are for educational purpose only. Please consult your financial advisor before trading or investing.
Happy trading !!!

Shipping Corporation Of IndiaAll My Discussion And Analysis Are For Educational Purpose And Future References. Please Kindly Ask Or Consult Your Financial Adviser Before Taking Any Investment Or Trading. Thanks //

SCIWait And Watch ??
Look for Low risk, High reward, and High Probability setups-
Things to Remember while Trading with the Trend
1. Know what the trend is.
2. The best trades are made in the direction of the trend.
3. Assume that the main trendline or moving average will hold.
4. The longer the moving average is, the better it defines the trend.
5. Wait for the pullback.
6. Don’t chase the market.
7. Don’t fight the market.
8. Even in the strongest trends there should be some retracement.
9. The closer the market is to the trendline, the better the risk/reward ratio is.
10. Use ADX to determine the strength of the trend.
11. Higher the level of ADX , the stronger the trend, below 20 consider the market to be choppy
12. Hold trades longer in a strong trend.
13. Wait for confirmation of a trendline breaking before reversing position.
14. Know where the Support levels are.
15. Place stops outside the Support levels.
Thank You..

SCI TRADE PLAN: 30 SEP 21 ONWARDSLevels as mentioned on the chart with probable Price Action to follow....
Be Proactive Trader
Better Insight, Better Trade Execution
Views are for ‘’EDUCATIONAL PURPOSE ONLY’’ trade at your own risk. ''I HAVE A RIGHT TO BE WRONG''
"Always Respect Risk"
Happy Trading
Jai Hind

Shipping Corp. of India - 10yr BO retest w/ 7mth Rounding Bottom
BUY GUIDANCE:
Never buy before 3PM (for positional trading). I have been burnt many times over. Try to buy between 3:15 - 3:30PM, later the better.
SL: Depending on your risk appetite: Below Weekly BO Candle / Below Daily BO Candle / 50% of Weekly BO candle / Below 20DMA
TGT: After a 10-15%+ vertical move, breakdown of 20DMA (on a daily close basis)
SELL GUIDANCE:
Selling in Profit:
Sell earlier in the session when the prices are higher, around 11AM.
Selling at SL:
Give your stock a chance to recover by end of session. If it doesn't recover, sell anywhere between 3:00 - 3:30PM.
Note: I reserve the right to be wrong.
DISCLAIMER:
I am not a SEBI registered analyst. Please consult your financial advisor before investing.

SCI CMP - 139 TARGET - 210 SL - 110 DCB #trader_rohanSCI
CMP - 139
TARGET - 210
SL - 110 DCB
#SCI #stocks #StockMarket #investing #trading #investments #Breakout #NSE #BSE #Nifty #Sensex #Chart #ChartOfTheWeek #trader_rohan

SCI: STRONG BREAKOUTRANGE BREAKOUT | UPTRENDING CHART
FRESH BUY
Trading in Blue sky zone
Disclaimer
The analysis is only for illustration purposes only. Please consult your financial advisor, agent, broker before acting on any information. We may or may not have positions in the stock and our actions may be contrary to the one mentioned here. This analysis may or may not be updated. We would not be responsible for the profit/loss resulting from this analysis.

Rounding bottom breakout in Shipping CP - Daily and WeeklyLooking at the size of the breakout candle and the volume in it, this is a no brainer. Current levels could a be a good entry point, also if a retest happens, thats also and scaling opportinity.
With the stop loss below the entry today's candle, look for 1:2 reward.
Kindly note that this is not a recommendation.

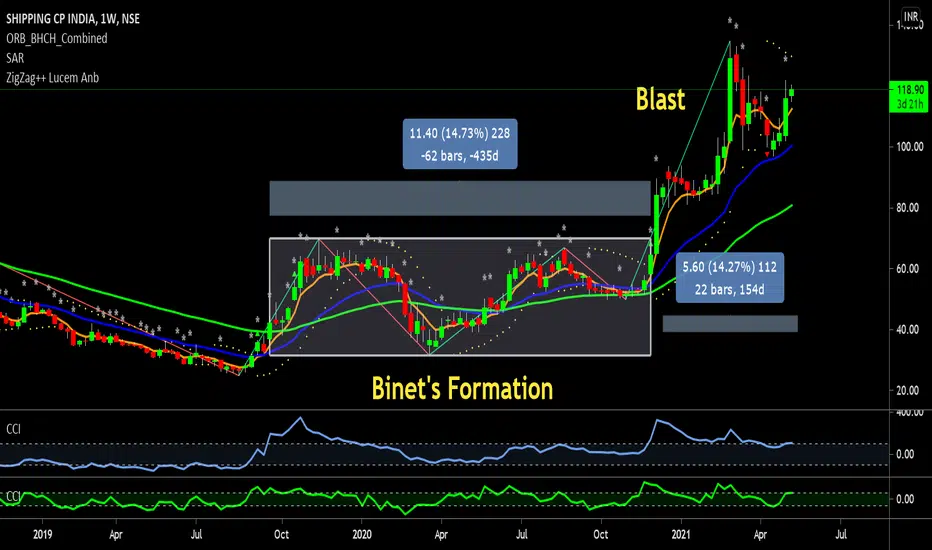
Trend-line breakout is confirmed. Buy signal is awaited.Shipping Corporation of India has broken-out from trend-line and facing some resistance around 118.
A daily close above 118 or crossing 119 would trigger the buying to make this stock touch its recent high zone.
Therefore, buy when the above condition is fulfilled for the target of 132 - 134
Stoploss after taking the trade would be below the recent low which is 110
PS: One can exit some position around the given target and carry remaining position if there is not enough selling volume around 133

SCI - Strong Stock looking good for an upmoveExport container companies revenues have increased due to hike in prices. SCI has given a breakout from recent high and it can zoom up.


SCI Good Risk Reward opportunity One Can buy at CMP at Rs1112 with Stop loss at Rs110 Target 126,134,140,155

Shipping Corporation Of India Limitedtriangle breakout pattern in Shipping Corporation Of India Limited

SHIPPING CP INDIA
Target:- 147
Stoploss:- 109
Duration:- 4 to 6 Weeks
The stock has already breakout through the resistance line and showing a green candle and which is proper indication of upside move, so we can buy this at market order. Use proper stoploss and maintain discipline throughout the trading period and use trailing stop below all the wave, the profit target was measured by the taking distance between support and resistance when pattern developed and paste it out breakout level, which is the resistance line.

SCI TL breakout - Swing tradeSCI has broken out of TL. Has scope of 15% approx upside till supply zone near upper TL. SL below the swing low on daily chart.


Flag Pattern BreakoutThe bullish or Bearish flag pattern works in a very good way. Here in the chart of SCI daily timeframe, the pattern has given a breakout and can go for the target of 120.
This is only an analysis of mine, this is not a recommendation to anyone. Do your own research before entering in any stock.

On the verge of breakout ✌✌✌This scrip is expected to give trendline breakout as it is on the verge of breakout. So traders keep on your radar to catch the momentum and enjoy the profit. Thanks to all 🙏🙏🙏

SCIIt's for pattern lovers. Volatility contraction can be seen on the chat by forming Flag and pole pattern.
