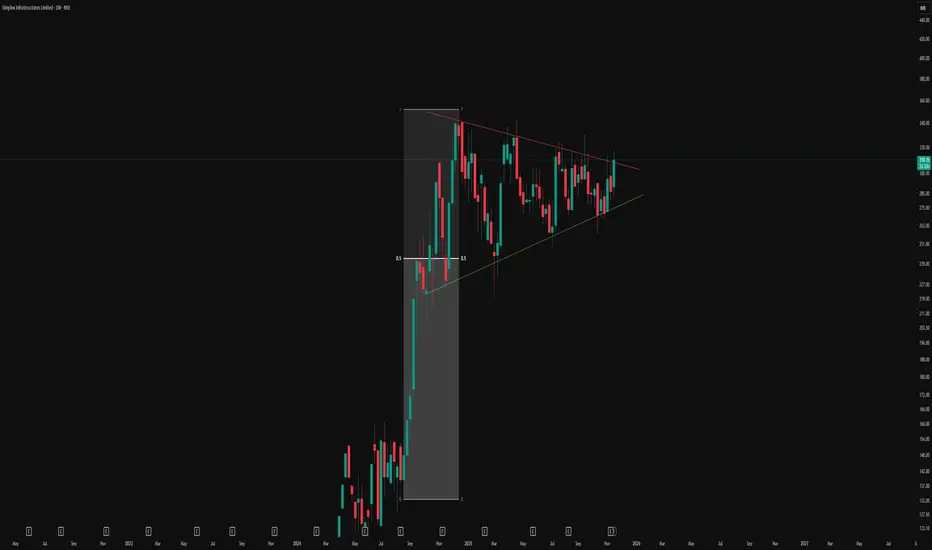
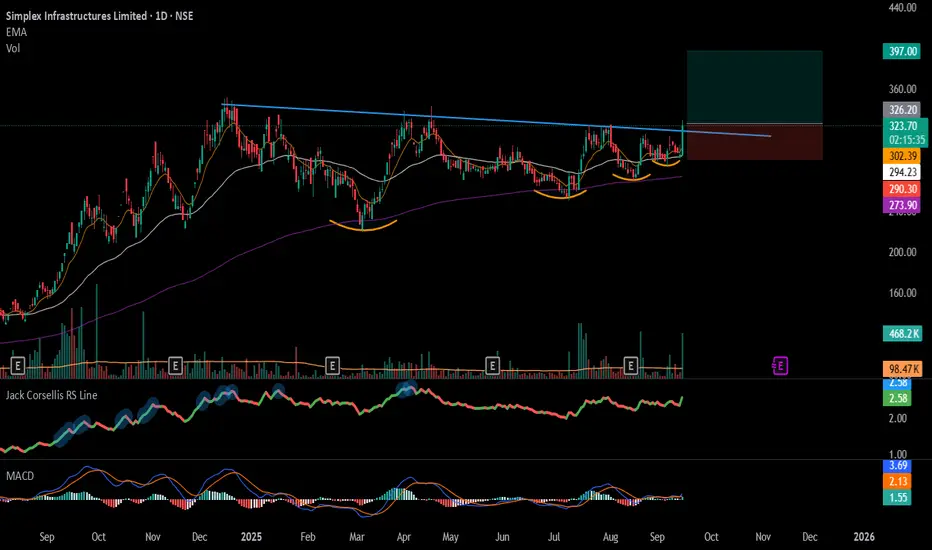
Symmetrical Triangle Formation with 50% EquilibriumVisual Structure and Pattern
-This chart illustrates a textbook symmetrical triangle pattern forming after a strong directional move.
-The red line represents the counter trendline (CT), connecting a series of lower highs.
-The green line marks the ascending trendline, connecting the sequence of higher lows.
-These converging lines encapsulate a contracting price structure, where volatility reduces over time, emphasizing indecision and consolidation among market participants.
-Symmetrical triangles predominantly represent phases where markets consolidate after an impulsive run, and both sides (bulls and bears) gradually reach a point of agreement before the next expansion.
-The 50% equilibrium level within triangles often acts as a magnet for price, attracting liquidity and providing reference for institutional flows, a concept vital for advanced swing trading and risk management.
This post is strictly for educational and analytical purposes, focusing only on chart structures and observable patterns. No content here should be taken as an indication of future price direction or as investment advice.
Trade ideas
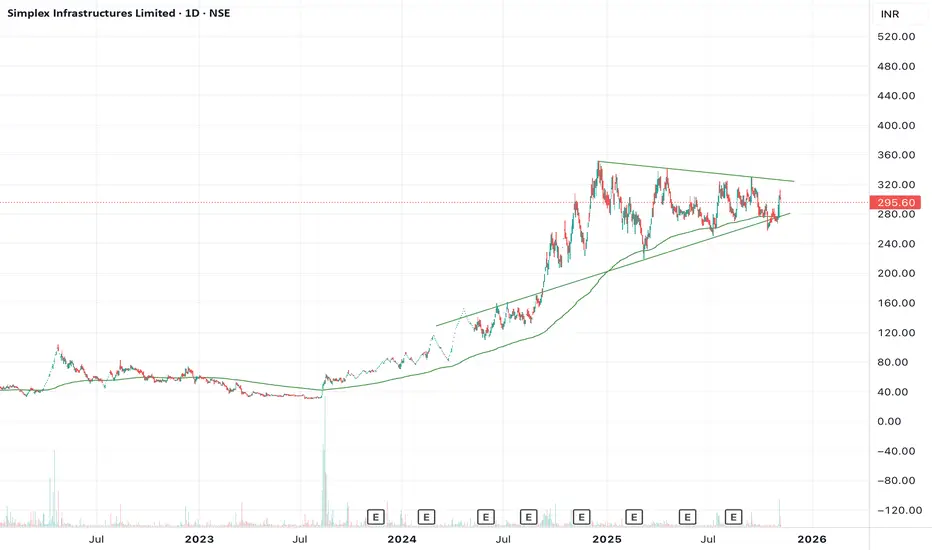
Simplexinf - Flag and Pole with Bullish Momentum - 40% UpsideStock forming perfect Flag & Pole pattern.
Taking support since Sep 24
Also Ascending Triangle with perfect support from 200 EMA
Stock 1st target - 20 %, Second Target - 40 %.
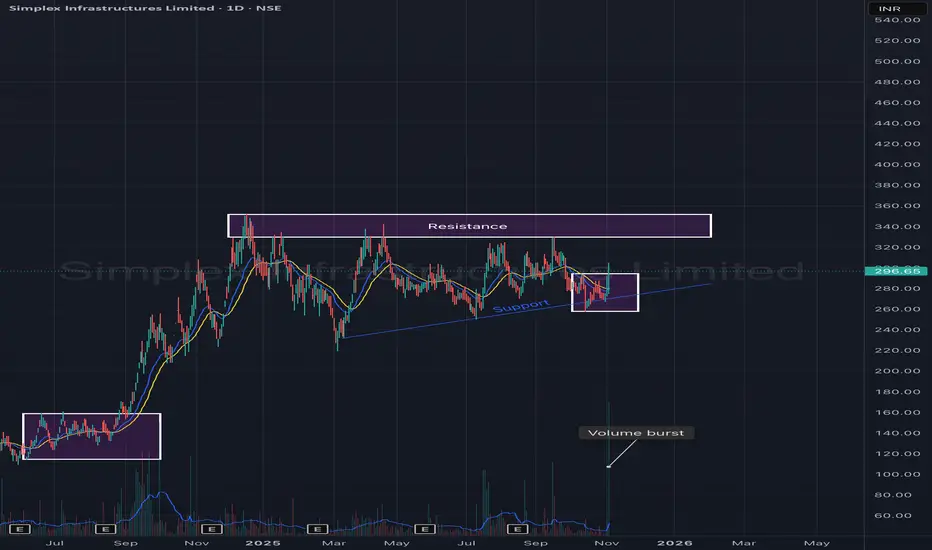
Simplex Infrastructures Ltd – Ascending Triangle Formation with Simplex Infrastructures is showing signs of accumulation and trend continuation within an ascending triangle pattern on the daily chart. The stock has been consistently forming higher lows while facing resistance around the ₹330–₹340 zone.
A recent volume burst near the support trendline indicates strong buying interest from lower levels — hinting at a potential breakout attempt in the coming sessions.
🎯 Key Levels:
CMP: ₹296.65 (+3.20%)
Support Trendline: ₹270 – ₹280
Resistance Zone: ₹330 – ₹340
Breakout Target: ₹370 – ₹390
Stop-Loss: ₹270 (on daily close basis)
📊 Technical View:
Formation of a higher-low structure within an ascending triangle.
Strong volume activity around support confirms accumulation.
Short-term EMAs are flattening, awaiting breakout confirmation.
A close above ₹340 with volume could trigger the next up leg toward ₹380+.
🧠 View:
Simplex Infra is building strength within a bullish ascending triangle pattern. A decisive move above ₹340 may confirm breakout momentum, supported by the recent volume surge, while the rising trendline continues to act as a strong base.
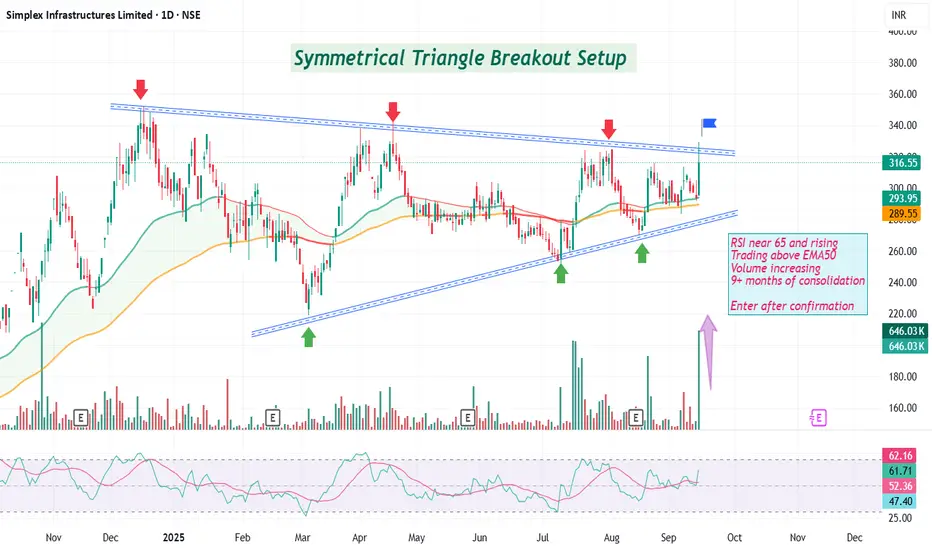
Breakout soon in Simplex InfraSymmetrical Triangle Breakout Setup
RSI near 65 and rising
Trading above EMA50
Volume increasing
9+ months of consolidation
Enter after confirmation
Disc: Not a recommendation, DYOR
#SIMPLEXINF - TrendLine Breakout in Daily Time FrameScript: SIMPLEXINF
Key highlights: 💡⚡
📈 TrendLine Breakout in Daily Time Frame
📈 Volume spike during Breakout
📈 MACD Bounce
📈 Can go for a swing trade
BUY ONLY ABOVE 325 DCB
⏱️ C.M.P 📑💰- 322.25
🟢 Target 🎯🏆 – 22%
⚠️ Stoploss ☠️🚫 – 11%
⚠️ Important: Market conditions are Okish, Position size 50% per Trade. Protect Capital Always
⚠️ Important: Always Exit the trade before any Event.
⚠️ Important: Always maintain your Risk:Reward Ratio as 1:2, with this RR, you only need a 33% win rate to Breakeven.
✅Like and follow to never miss a new idea!✅
Disclaimer: I am not SEBI Registered Advisor. My posts are purely for training and educational purposes.
Eat🍜 Sleep😴 TradingView📈 Repeat 🔁
Happy learning with MMT. Cheers!🥂
Simplex - Bullish Rounding Bottom MonthlyStock Seems to be making a rounding bottom in monthly charts. W
Can take entry above 246 for Targets 385++ in a Quarter.
Keep Patience and please check the fundamentals.

Simplex Infra- Ready For a big breakout after many yearsSimplex Infra
Good setup to breakout for the next 3 years. Breaking out on weekly and monthly time Frames.
Crossed CCi Above 100
RS Positive
The stock will come to the zone marked in Orange and then take off for a bigger Long move.
On 125 Minutes chart. Volumes increasing above 20 day MA in all timeframes.
Entry: 80.75
SL- 78
Using Demand Supply, RS, CCi

SIMPLEX INFRA....Looking for Huge BreakoutAs seen on chart , Huge breakout on cards....5 year breakout will give huge returns....
Looking for 200-250+++ soon

long term consolidation breakoutbuy above 43 with stop loss around 40 . long term trade with higher targets , chances of becoming a multi bagger in 1 to 2 years time horizon .


simplex infra looks bullish in short to medium termIn longer time frame, price closed above multi year resistance zone, and sustaining above it
in smaller time frame CnH pattern formed.
with sl - 495, 1st tgt - 690, 2nd tgt - 750

Simplex InfraThe stock has been doing wonders and has set a good base at the 50% retracement mark! Good times going ahead!

SIMPLEX INFRA BREAKOUT ON WEEKLYSimplex Infrastructure has given a breakout on weekly chart. Buy for a target of 494 with SL at 344

simplex infra,looks like a good investment betbreaking out of a cuo and handle pattern on the monthly charts.combined with a short term reversal on daily.some big targets on this..can it do 950? time will tell

SIMPLEXINFRA - Good Investment StockIt is been observed on the weekly chart that the price action breaking above the current downward trendline, indicating buyers dominance over price action and a further move up. It has also formed inverse Head-n Shoulder pattern, which again indicating a reversal and a bullish move ahead.
Target 1: 360 (1:1)
Target2: 410 (1:2)
Stoploss: 260
