SPARC : BULLISH SETUPSPARC (SUN PHARMA ADV.RES.CO.LTD) demonstrating a good bounce back from support of 156.5 level and travelling in a channel pattern . Expects a up move to 230 (40%) from current level.
Reason for Bullishness :
1) Bouncing back from support.
2) Travelling in a channel pattern.
This analysis is for educational purposes only. I’m not a SEBI-registered advisor and this is not a trading or investment recommendation.
SPARC trade ideas

SPARCSparc - CMP 198
Sun Pharma Advanced Research Company Ltd is engaged in the business of research and development (R&D) of pharmaceutical products.
Star products of Portfolio
1 Vodobatinib - A selective, brain penetrant c-Abl kinase inhibitor moderating oxidative stress response. Potential disease modifying therapy with applications in several neurodegenerative diseases.
2 SCD-153 - novel mechanism in Alopecia Areata
3 Vibozilimod - S1P R1 agonist in clinical PoC studies for multiple derma autoimmune diseases
4 SBO-154 - Antibody Drug Conjugate targeting a unique epitope of MUC-1.
This is just to boost my confidence. No Suggestions for buying. I will keep checking and updating my mistake if last post gone wrong...
Disclosure: I am not SEBI registered. The information provided here is for educational purposes only. I will not be responsible for any of your profit/loss with these suggestions. Consult your financial Adviser before making any decisions.
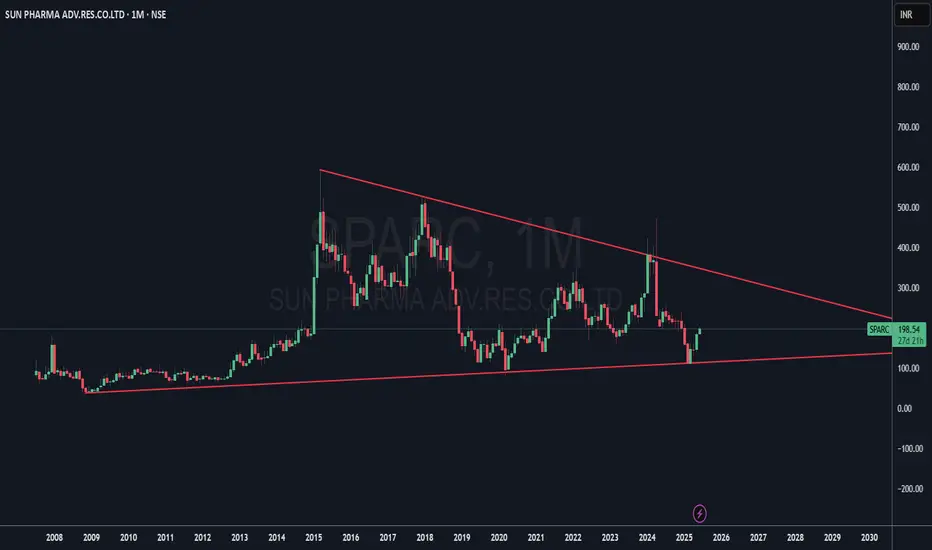
SPARC | LONG TERM INVESTMENT Hi Traders,
This is SPARC Monthly Chart.
This Best time to invest for long term with small
SL which is 27 Rupees.
I dont follow any fundamental i use only technical analysis
Note - This is only for education purpose

BREAKOUT stocks for the December first weekMulti time frame analysis with clouds and bollinger bands

SPARC - Weekly AnalysisIn the Weekly Chart of SPARC ,
we can see that; it is at decision making point.
Possible momentums are shown in chart.

SPARC Breaking Channel Formation Above 250Details:
Asset: Sun Pharma Advanced Research Company Ltd (SPARC)
Breakout Level: Above 250
Potential Target: Upside momentum expected
Stop Loss: Below breakout level or as per risk tolerance
Timeframe: Short to medium-term
Rationale: Sun Pharma Advanced Research Company Ltd (SPARC) is showing signs of a potential breakout above the 250 level, breaking out of a channel formation. Sustaining above this level could indicate a bullish sentiment shift and pave the way for a significant upmove.
Market Analysis:
Technical Breakout: Breaking out of the channel formation and sustaining above 250 suggests a technical breakout, potentially attracting buying interest and driving the price higher.
Market Sentiment: Positive market sentiment or company-specific factors may be contributing to the anticipated breakout in SPARC.
Potential Target:
The potential upside target for SPARC is not specified but is expected to be significant if the breakout sustains.
Risk Management:
Implementing a stop loss strategy below the breakout level is essential to manage risk in case of unexpected price reversals.
Timeframe:
The projected upside move for SPARC is based on a short to medium-term outlook, but actual timing may vary based on market conditions.
Risk-Reward Ratio: Consider individual risk tolerance and adjust position size accordingly to maintain a favorable risk-reward ratio.
As with any investment opportunity, conduct thorough analysis and consider factors such as market trends, company fundamentals, and risk management strategies before making trading decisions.

SPARC(Sun Pharma Advance Research) is ready to sparkleThis is a SUNPHARMA group of company a renowned name in Pharma industry and one of the biggest pharma company.
SPARC is at very good technical levels (Demand Area on monthly time frame).
It consolidated for more than 30 days, it formed a rectangle pattern.
it is ready for a rectangle breakout.
It shall bounce back and has a potential to give good returns from here
It is for study purpose only, neither this is a buying recommendation nor it is a accurate analysis
views are my own please take advice from your financial advisor before making any decision
I am not SEBI registered analyst, I am learning about the technical & fundamental analysis.

SPARC - BO FAIL, IMPORTANT RISK MANAGEMENT LESSONHello Community,
today i will talk about the importance of risk management in stock market, why its important to respect risk in stock market with proper stoploss method you should have as per your risk apetite with example. We have talked much about the BO stocks which had made good money for us but still in market there are lot many examples where good BO got failed at later stage.
I was looking at the chart of sparc which i traded before as a 52 WEEK BO but since after my entry it stalked a little bit so i booked my profit as i got other opportunity to make money and keep the alerts at BO points to reenter later. Now to day while scanning my multiyear bo watchlist i saw that a BO Faliure with gaps in the chart at weekly time frame. Rest details are on chart.
That's why i say everytime profit booking is also very improtant at every level, you can always reenter in any stocks becoz booking profit is better than the looking profit.
Remember: I am a Price Action Trader and use Price and Volume together with different Timeframes, including RSI, and market conditions. To get best result always wait for confirmation. Focus on Risk Management and Position sizing.
I use Trading view for my Analysis and charts Repositories. I could have Or Couldn’t have positions in Sharing Ideas.
Treat trading like a business and it will pay you like a business…..!!
Hope this post is helpful to community
Thanks
RastogiG

SPARC Breakout from down channel SPARC Breakout from down channel
SPARC trending downwards from recent highs in channel.
In last couple of days it has broken out of the channel and primed for all time high

SPARC ON FIRE The stock has been foriming a cup and handle pattern and has given a breakout from the same moreover the volumes in the stock are quite reliable 528 and 718 levels can be achieved soon

SPARC-A spark of a bull run visible!SPARC is a loss making company, hence this is purely a technical pick.
Stock has given beautiful trendline breakout and is in consolidation since breakout.
Above 400, stock can fly to ATH.
Risky traders can enter at CMP for better risk reward.

sparcstock : sparc
trade : long (cash segment)
buy @ 436
sl @ 408
target 1 @ 530
target 2 @ 590
note :
this information is for education only

Breakout confirmed in SPARCRound Bottom Breakout
RSI above 70 and rising
Trading above EMA50
Volume increasing
Disc: for. Study, not a recommendation

SPARC - Ichimoku Breakout📈 Stock Name - Sun Pharma Advanced Research Company Limited
🌐 Ichimoku Cloud Setup:
1️⃣ Today's close is above the Conversion Line.
2️⃣ Future Kumo is Turning Bullish.
3️⃣ Chikou span is slanting upwards.
All these parameters are shouting BULLISH at the Current Market Price and even more bullishness anticipated AFTER crossing 435.
🚨Disclaimer: This is not a Buy or Sell recommendation. It's for educational purposes and a guiding light to learn trading in the market.
#CloudTrading
#IchimokuCloud
#IchimokuFollowers
#Ichimokuexpert
Excited about this analysis? Share your thoughts in the comments below!
👍 Like, Share, and Subscribe for daily market insights! 🚀
#StockAnalysis #MarketWatch #TradingEducation #ichimoku #midcap

SPARC | Swing Trade📊 DETAILS
Sector: Biotechnology & Medical Research
Mkt Cap: 12,847 cr
Sun Pharma Advanced Research Company Ltd is engaged in the business of research and development (R&D) of pharmaceutical products.
TTM PE : -- (Low PE)
Sector PE : 55.17
Beta : 0.80
📚 INSIGHTS
Momentum Trap
Strong price momentum & technical indicators may tempt investors to buy this stock. Be selective, not all stocks with strong momentum have strong financials & balance sheet.
6.48% away from 52 week high
Outperformer - Sun Pharma Advanced Research Company up by 10.48% v/s NIFTY 50 up by 2.53% in last 1 month
📈 FINANCIALS
Piotroski Score of 2/9 indicates Weak Financials
Disclaimer: This analysis is for educational purposes only, and I'm not a SEBI registered analyst.
If you found this analysis helpful, I encourage you to like and share it. Your observations and comments are also welcomed below. Your support, likes, follows, and comments motivate me to consistently share valuable insights with you.
🔍 More Analysis & Trade Setups 🔍
For more technical analysis and trade setups, make sure to follow me on TradingView: www.tradingview.com

SPARC chart analysis on weekly time frame The chart looks good in weekly time frame. It had given breakout previously , retested and now showing some bullishness to go up. After 2015 the stock might come to the same area may or may not break the resistance area.
No call, No tip ..only stock analysis

FLAG & POLEToday stock has given flag bo , if it sustained good move is expected
only for educational purpose
not for sugesstion

SPARC - SWING TRADE - 27th November #stocksSPARC (1W TF)
Swing Trade Analysis given on 27th November, 2023 (Monday)
Pattern: ROUNDING BOTTOM
- Neckline Resistance Breakout - Done ✓
- Volume Buildup & Spike - Done ✓
- Retracement + Consolidation - In Progress
#stocks #swingtrade #chartanalysis #priceaction #traderyte #sparc

SPARC - Short TermOn Technical Indicators this stock shows bullish trend. While on the Weekly Chart the Stock has shown the break out of flag pattern. Buy @ 378.60, SL @ 360 & Tgt @ 423

Swing Trading Opportunity in SPARC-- Waiting for the strong Trendline Breakout Candle with High volume
-- Flag Pattern on Daily TF(Waiting for Breakout)
-- Doji Candle formed On Weekly Candle at SUPPLY ZONE
-- RETEST the breakout level
-- ‘W’ Pattern BreakOut On Monthly TF
-- So there are Multiple signals of buying but just waiting for strong Volume On Daily TF.
Please Follow!!! (Also Please check my previous IDEA‘s)

SPARC | Looks good for another 50% rallySPARC | Looks good for another 50% rally
CMP : 360
SL : 300
Target : 520
1:3 risk reward setup

SWING IDEA - SPARCThere is a swing opportunity in SUN PHARMA ADVANCED RESEARCH COMPANY .
Reasons are listed below :
Flag and Pole pattern.
0.382 Fibonacci support.
higher highs are being made.
Strong consolidation phase of 5years.
Increased volumes.
Target - 423 // 463 // 530
StopLoss - Daily close below 357

