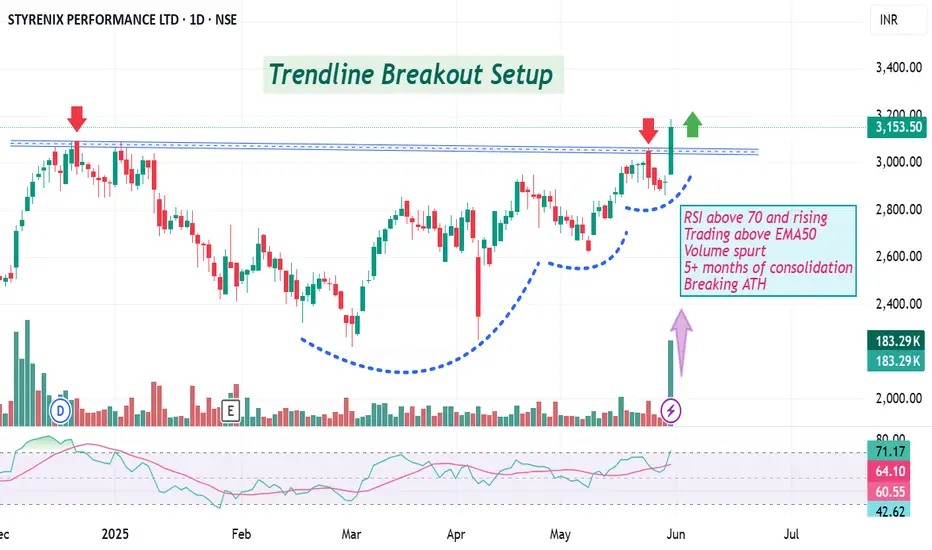
Styrenix Performance Materials Ltd - Breakout Setup, Move is ON.#STYRENIX trading above Resistance of 2485
Next Resistance is at 3295
Support is at 1675
Here are previous charts:
Chart is self explanatory. Levels of breakout, possible up-moves (where stock may find resistances) and support (close below which, setup will be invalidated) are clearly defi
Styrenix Performance Materials Ltd
No trades
Next report date
—
Report period
—
EPS estimate
—
Revenue estimate
—
114.00 INR
2.35 B INR
29.82 B INR
8.99 M
About Styrenix Performance Materials Ltd
Sector
Industry
Website
Headquarters
Vadodara
Founded
1973
IPO date
Dec 30, 1994
Identifiers
2
ISIN INE189B01011
Styrenix Performance Materials Ltd. engages in the manufacture and sale of engineering thermoplastics. Its products include absolac and absolan. Absolac is a plastic resin produced from Acrylonitrile, Butadiene, and Styrene which is used for producing home appliances, automobile, consumer durables and business machines. It operates through the following segments: Specialties, Polystyrene, and Others. The company was founded on December 7, 1973 and is headquartered in Vadodara, India.
Related stocks

Not so common stock set to break out in Rounding bottom patternStyrenix has broken out in rounding bottom pattern after 7 months and trading at all time high . If it sustain it’s open to sky.

Breakout stock for next weekCompany is a producer of Absolac (ABS) and Absolan (SAN) in India. ABS is a plastic resin produced from acrylonitrile, butadiene and styrene, used for manufacturing home appliances, automobiles, consumer durables and machinery. Absolan is a polymerized plastic resin produced from styrene and acrylon
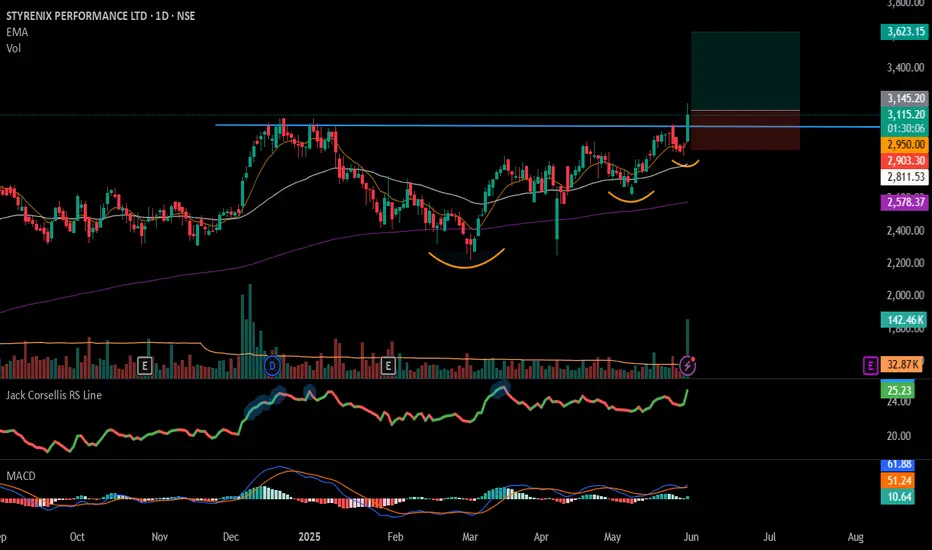
#STYRENIX - VCP BreakOut in Daily Time Frame📊 Script: STYRENIX
Key highlights: 💡⚡
📈 VCP BreakOut in Daily Time Frame.
📈 Price consolidating near Resistance.
📈 Volume spike during Breakout
📈 MACD Bounce
📈 Can go for a swing trade
BUY ONLY ABOVE 3145 DCB
⏱️ C.M.P 📑💰- 3115
🟢 Target 🎯🏆 – 16%
⚠️ Stoploss ☠️🚫 – 8%
⚠️ Important: Market conditi
Flag and Pole in Styrenix what was the old INEOS StyrolutionOverall the pattern shows that a convergence is happening at this level
When we look at the stock over a long period of time, what I realise is that the patterns are repetitive and it has not participated in the bull market as much as the other stocks.
Looking at the shareholding pattern also we ca

flag and pole pattern breakoutStyrenix performance ltd has formed and successfully broke the pattern.
The breakout in the pattern can be seen with rising volumes which indicates strong buyers hold.
Along with short and medium term, long term momentum is also strong according to indicators. Positions could be made with minimum

STYRENIX
Previous long term up-moves in the stock peaked out at the 161.8% FR level after clearing their previous all-time highs.
However, this time, price is decisively trading above the 161.8% FR level. Long term up-sloping trendline has also been cleared.
Hence the on-going up-move is expected to co

Triple bottom pattern breakoutPlease look into the chart for a detailed understanding.
Consider these for short-term & swing trades with 2% profit.
For BTST trades consider booking target for 1%-2%
For long-term trades look out for resistance drawn above closing.
Please consider these ideas for educational purpose
Please no

Medium term trading opportunity in Styrenix for v. good upsideHi,
NSE:STYRENIX has given a Bullish Flag Breakout on Weekly charts with very good volume.
MACD is also on the bullish side on Weekly time frames. RSI is also on the bullish side on daily, weekly and monthly time frames.
In the current market scenario, I am expecting that the bullish momentu

STYRENIX BO(Breakout) RESEARCH TO OBSERVEDate : 10-06-2010
-------------------------------------
BO(Breakout) RESEARCH TO OBSERVE
STYRENIX Looks Good @ CMP
SL 1290
Target 2106, 2471, 2836, 3201, 3931
Hold few weeks to Months
Please consult your financial advisor before investing
All research for educational purposes only.

See all ideas
Summarizing what the indicators are suggesting.
Neutral
SellBuy
Strong sellStrong buy
Strong sellSellNeutralBuyStrong buy
Neutral
SellBuy
Strong sellStrong buy
Strong sellSellNeutralBuyStrong buy
Neutral
SellBuy
Strong sellStrong buy
Strong sellSellNeutralBuyStrong buy
An aggregate view of professional's ratings.
Neutral
SellBuy
Strong sellStrong buy
Strong sellSellNeutralBuyStrong buy
Neutral
SellBuy
Strong sellStrong buy
Strong sellSellNeutralBuyStrong buy
Neutral
SellBuy
Strong sellStrong buy
Strong sellSellNeutralBuyStrong buy
Displays a symbol's price movements over previous years to identify recurring trends.
Frequently Asked Questions
The current price of STYRENIX is 1,989.40 INR — it has decreased by −0.14% in the past 24 hours. Watch Styrenix Performance Materials Ltd stock price performance more closely on the chart.
Depending on the exchange, the stock ticker may vary. For instance, on BSE exchange Styrenix Performance Materials Ltd stocks are traded under the ticker STYRENIX.
STYRENIX stock has risen by 4.24% compared to the previous week, the month change is a 1.43% rise, over the last year Styrenix Performance Materials Ltd has showed a −23.46% decrease.
We've gathered analysts' opinions on Styrenix Performance Materials Ltd future price: according to them, STYRENIX price has a max estimate of 3,147.00 INR and a min estimate of 3,147.00 INR. Watch STYRENIX chart and read a more detailed Styrenix Performance Materials Ltd stock forecast: see what analysts think of Styrenix Performance Materials Ltd and suggest that you do with its stocks.
STYRENIX reached its all-time high on Jun 11, 2025 with the price of 3,523.95 INR, and its all-time low was 70.00 INR and was reached on Oct 28, 2008. View more price dynamics on STYRENIX chart.
See other stocks reaching their highest and lowest prices.
See other stocks reaching their highest and lowest prices.
STYRENIX stock is 1.14% volatile and has beta coefficient of 0.75. Track Styrenix Performance Materials Ltd stock price on the chart and check out the list of the most volatile stocks — is Styrenix Performance Materials Ltd there?
Today Styrenix Performance Materials Ltd has the market capitalization of 35.03 B, it has decreased by −1.64% over the last week.
Yes, you can track Styrenix Performance Materials Ltd financials in yearly and quarterly reports right on TradingView.
Styrenix Performance Materials Ltd is going to release the next earnings report on May 22, 2026. Keep track of upcoming events with our Earnings Calendar.
STYRENIX net income for the last quarter is 447.20 M INR, while the quarter before that showed 519.20 M INR of net income which accounts for −13.87% change. Track more Styrenix Performance Materials Ltd financial stats to get the full picture.
Styrenix Performance Materials Ltd dividend yield was 1.13% in 2024, and payout ratio reached 23.18%. The year before the numbers were 6.83% and 99.52% correspondingly. See high-dividend stocks and find more opportunities for your portfolio.
As of Feb 12, 2026, the company has 473 employees. See our rating of the largest employees — is Styrenix Performance Materials Ltd on this list?
EBITDA measures a company's operating performance, its growth signifies an improvement in the efficiency of a company. Styrenix Performance Materials Ltd EBITDA is 3.43 B INR, and current EBITDA margin is 12.13%. See more stats in Styrenix Performance Materials Ltd financial statements.
Like other stocks, STYRENIX shares are traded on stock exchanges, e.g. Nasdaq, Nyse, Euronext, and the easiest way to buy them is through an online stock broker. To do this, you need to open an account and follow a broker's procedures, then start trading. You can trade Styrenix Performance Materials Ltd stock right from TradingView charts — choose your broker and connect to your account.
Investing in stocks requires a comprehensive research: you should carefully study all the available data, e.g. company's financials, related news, and its technical analysis. So Styrenix Performance Materials Ltd technincal analysis shows the neutral today, and its 1 week rating is sell. Since market conditions are prone to changes, it's worth looking a bit further into the future — according to the 1 month rating Styrenix Performance Materials Ltd stock shows the buy signal. See more of Styrenix Performance Materials Ltd technicals for a more comprehensive analysis.
If you're still not sure, try looking for inspiration in our curated watchlists.
If you're still not sure, try looking for inspiration in our curated watchlists.