Styrenix Performance Materials Ltd - Breakout Setup, Move is ON.#STYRENIX trading above Resistance of 2485
Next Resistance is at 3295
Support is at 1675
Here are previous charts:
Chart is self explanatory. Levels of breakout, possible up-moves (where stock may find resistances) and support (close below which, setup will be invalidated) are clearly defined.
Disclaimer: This is for demonstration and educational purpose only. This is not buying or selling recommendations. I am not SEBI registered. Please consult your financial advisor before taking any trade.
Trade ideas

Not so common stock set to break out in Rounding bottom patternStyrenix has broken out in rounding bottom pattern after 7 months and trading at all time high . If it sustain it’s open to sky.

Breakout stock for next weekCompany is a producer of Absolac (ABS) and Absolan (SAN) in India. ABS is a plastic resin produced from acrylonitrile, butadiene and styrene, used for manufacturing home appliances, automobiles, consumer durables and machinery. Absolan is a polymerized plastic resin produced from styrene and acrylonitrile, and mainly used for products such as lighting, stationery, novelties, refrigerators and cosmetic packing. It also manufactures Polystyrene which is used for food service and packaging, refrigerator components, electronic goods housings, etc.
Breakout Screener:
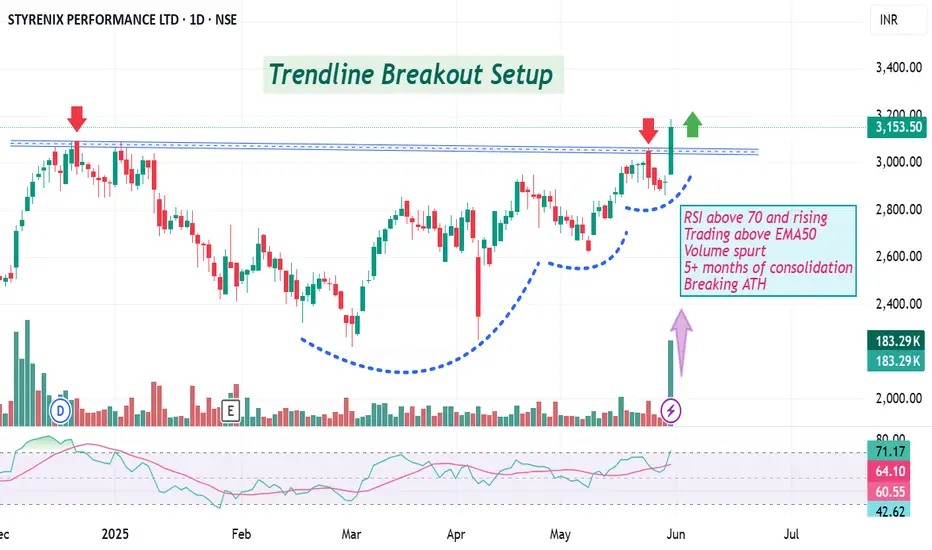
Trendline Breakout Setup:
🔹 RSI > 70 and Rising: Momentum is picking up fast. RSI crossing 70 with an upward slope indicates strong bullish sentiment—not overbought weakness, but strength!
🔹 Trading Above EMA50: Price is sustaining above the 50-day Exponential Moving Average—a sign of medium-term trend reversal or continuation.
🔹 Volume Spurt: Breakouts are only meaningful with volume, and this one's supported by a significant increase in trading activity.
🔹 5+ Months of Consolidation: The longer the base, the stronger the breakout. This stock has been coiling for over 5 months—pressure's finally releasing.
🔹 Breaking All-Time High (ATH): Blue-sky breakout! No overhead supply zone—price discovery mode engaged.
💡 Not a recommendation—just a technically strong setup worth watching. Always DYOR (Do Your Own Research).
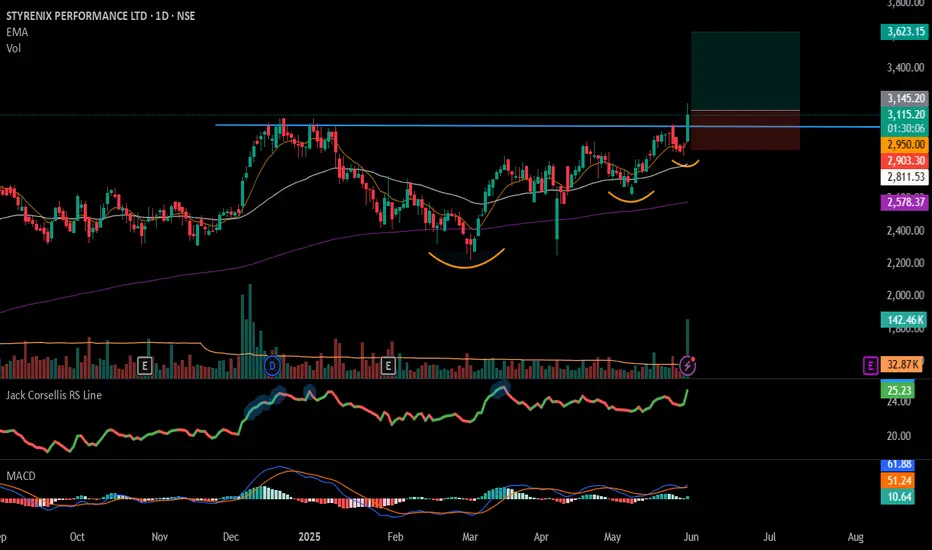
#STYRENIX - VCP BreakOut in Daily Time Frame📊 Script: STYRENIX
Key highlights: 💡⚡
📈 VCP BreakOut in Daily Time Frame.
📈 Price consolidating near Resistance.
📈 Volume spike during Breakout
📈 MACD Bounce
📈 Can go for a swing trade
BUY ONLY ABOVE 3145 DCB
⏱️ C.M.P 📑💰- 3115
🟢 Target 🎯🏆 – 16%
⚠️ Stoploss ☠️🚫 – 8%
⚠️ Important: Market conditions are Okish, Position size 50% per Trade. Protect Capital Always
⚠️ Important: Always Exit the trade before any Event.
⚠️ Important: Always maintain your Risk:Reward Ratio as 1:2, with this RR, you only need a 33% win rate to Breakeven.
✅Like and follow to never miss a new idea!✅
Disclaimer: I am not SEBI Registered Advisor. My posts are purely for training and educational purposes.
Eat🍜 Sleep😴 TradingView📈 Repeat 🔁
Happy learning with MMT. Cheers!🥂
Flag and Pole in Styrenix what was the old INEOS StyrolutionOverall the pattern shows that a convergence is happening at this level
When we look at the stock over a long period of time, what I realise is that the patterns are repetitive and it has not participated in the bull market as much as the other stocks.
Looking at the shareholding pattern also we can understand that the no.l of shareholders in this counter are only 45,000 which means only savvy and old timers what knew this counter and IPO investors are there rather than catching the frenzy of FNO and traders and mass allotments.

flag and pole pattern breakoutStyrenix performance ltd has formed and successfully broke the pattern.
The breakout in the pattern can be seen with rising volumes which indicates strong buyers hold.
Along with short and medium term, long term momentum is also strong according to indicators. Positions could be made with minimum expectation of 1:3 R:R.

STYRENIX
Previous long term up-moves in the stock peaked out at the 161.8% FR level after clearing their previous all-time highs.
However, this time, price is decisively trading above the 161.8% FR level. Long term up-sloping trendline has also been cleared.
Hence the on-going up-move is expected to continue.
Bullish outlook would remain valid as long as price is above 2300.

Triple bottom pattern breakoutPlease look into the chart for a detailed understanding.
Consider these for short-term & swing trades with 2% profit.
For BTST trades consider booking target for 1%-2%
For long-term trades look out for resistance drawn above closing.
Please consider these ideas for educational purpose
Please note that, if there are some big targets, those are drawn thinking for long term.

Medium term trading opportunity in Styrenix for v. good upsideHi,
NSE:STYRENIX has given a Bullish Flag Breakout on Weekly charts with very good volume.
MACD is also on the bullish side on Weekly time frames. RSI is also on the bullish side on daily, weekly and monthly time frames.
In the current market scenario, I am expecting that the bullish momentum will continue.
Complete price projection like entry, stop loss and targets mentioned on the charts for educational purpose.
Don't Forget to Follow me to get all the updates.
Please share your feedback or any queries on the study.
Disclaimer: Please consult your financial advisor before making any investment decision.

STYRENIX BO(Breakout) RESEARCH TO OBSERVEDate : 10-06-2010
-------------------------------------
BO(Breakout) RESEARCH TO OBSERVE
STYRENIX Looks Good @ CMP
SL 1290
Target 2106, 2471, 2836, 3201, 3931
Hold few weeks to Months
Please consult your financial advisor before investing
All research for educational purposes only.

Daily breakout with good volume1. Price Breakout: The stock's price closed above its established resistance level, signaling a breakout. This indicates that the stock has moved past a significant price barrier where it previously faced selling pressure.
2. Volume Confirmation: The breakout was accompanied by a significantly higher trading volume compared to the stock's average daily volume. This increased volume confirms strong market interest and investor confidence in the price movement, suggesting the breakout is likely to be sustained.

BUY TODAY SELL TOMORROW for 5%DON’T HAVE TIME TO MANAGE YOUR TRADES?
- Take BTST trades at 3:25 pm every day
- Try to exit by taking 4-7% profit of each trade
- SL can also be maintained as closing below the low of the breakout candle
Now, why do I prefer BTST over swing trades? The primary reason is that I have observed that 90% of the stocks give most of the movement in just 1-2 days and the rest of the time they either consolidate or fall.
Resistance Breakout in STYRENIX
BUY TODAY SELL TOMORROW for 5%

Styrenix -- 1623 to 2000+Company is a producer of Absolac (ABS) and Absolan (SAN) in India. ABS is a plastic resin produced from acrylonitrile, butadiene and styrene, used for manufacturing home

Styrenix shorter time frame viewWave 3 seems to have been completed and now a corrective wave 4 might begin, could be a good buy zone for the next leg up, NOT A INVESTMENT ADVISE
