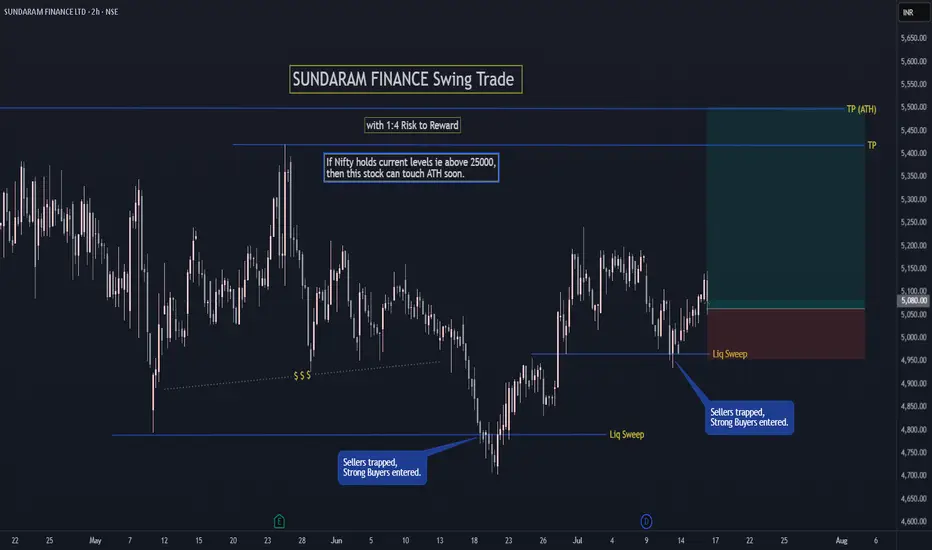
SUNDARAM FINANCE Swing TradeIf Nifty holds current levels ie above 25000,
then SUNDARAM FINANCE can touch ATH soon.
FOLLOW for more such simple swing setups.
Let me know in comments if you have any doubt or questions.
SUNDARMFIN trade ideas
Amazing breakout on WEEKLY Timeframe - SUNDARMFINCheckout an amazing breakout happened in the stock in Weekly timeframe, macroscopically seen in Daily timeframe. Having a great favor that the stock might be bullish expecting a staggering returns of minimum 25% TGT. IMPORTANT BREAKOUT LEVELS ARE ALWAYS RESPECTED!
NOTE for learners: Place the breakout levels as per the chart shared and track it yourself to get amazed!!
#No complicated chart patterns
#No big big indicators
#No Excel sheet or number magics
TRADE IDEA: WAIT FOR THE STOCK TO BREAKOUT IN WEEKLY TIMEFRAME ABOVE THIS LEVEL.
Checkout an amazing breakout happened in the stock in Weekly timeframe.
Breakouts happening in longer timeframe is way more powerful than the breakouts seen in Daily timeframe. You can blindly invest once the weekly candle closes above the breakout line and stay invested forever. Also these stocks breakouts are lifelong predictions, it means technically these breakouts happen giving more returns in the longer runs. Hence, even when the scrip makes a loss of 10% / 20% / 30% / 50%, the stock will regain and turn around. Once they again enter the same breakout level, they will flyyyyyyyyyyyy like a ROCKET if held in the portfolio in the longer run.
Time makes money, GREEDY & EGO will not make money.
Also, magically these breakouts tend to prove that the companies turn around and fundamentally becoming strong. Also the magic happens when more diversification is done in various sectors under various scripts with equal money invested in each N500 scripts.
The real deal is when to purchase and where to purchase the stock. That is where Breakout study comes into play.
Check this stock which has made an all time low and high chances that it makes a "V" shaped recovery.
> Taking support at last years support or breakout level
> High chances that it reverses from this point.
> Volume dried up badly in last few months / days.
> Very high suspicion based analysis and not based on chart patterns / candle patterns deeply.
> VALUABLE STOCK AVAILABLE AT A DISCOUNTED PRICE
> OPPURTUNITY TO ACCUMULATE ADEQUATE QUANTITY
> MARKET AFTER A CORRECTION / PANIC FALL TO MAKE GOOD INVESTMENT
DISCLAIMER : This is just for educational purpose. This type of analysis is equivalent to catching a falling knife. If you are a warrior, you throw all the knives back else you will be sorrow if it hits SL. Make sure to do your analysis well. This type of analysis only suits high risks investor and whose is willing to throw all the knives above irrespective of any sectoral rotation. BE VERY CAUTIOUS AS IT IS EXTREME BOTTOM FISHING.
HOWEVER, THIS IS HOW MULTIBAGGERS ARE CAUGHT !
STOCK IS AT RIGHT PE / RIGHT EVALUATION / MORE ROAD TO GROW / CORRECTED IV / EXCELLENT BOOKS / USING MARKET CRASH AS AN OPPURTUNITY / EPS AT SKY.
LET'S PUMP IN SOME MONEY AND REVOLUTIONIZE THE NATION'S ECONOMY!
Sundaram Finance Ltd - February 18 Projection UpdateBullish Scenario (Breakout Above ₹4725)
If price sustains above ₹4725, it can move toward ₹4760 → ₹4785 → ₹4815.
A confirmed breakout above ₹4965 would indicate a strong bullish trend.
CMP: ₹4741 (as per the chart)
Bullish Scenario (Breakout Above ₹4725) - Holding Above This Level
If price sustains above ₹4725, the next targets are:
₹4760 → ₹4785 → ₹4815
A confirmed breakout above ₹4740 would indicate a strong bullish trend, opening up higher targets.
Key Resistance Zones:
₹4760-4785 (Bearish Fair Value Gap - FVG)
₹4815 (Bearish OB - Daily Resistance)
₹4929-4965 (Major Supply Zone & FVG)
Bearish Counter Scenario (Rejection at ₹4760-4785)
If price fails to hold above ₹4725, expect a pullback towards:
₹4673 → ₹4618 (Bullish FVG Support Zone)
A break below ₹4618 could push the price towards ₹4553 and further into the ₹4421-4486 demand zone.
Final Outlook:
Bullish Bias: Above ₹4725 with ₹4760+ as the next key level.
Breakout Confirmation: Daily close above ₹4965.
Bearish Reversal: Below ₹4673, with key supports at ₹4553 and ₹4421-4486.
Disclaimer: This analysis is for educational purposes only and not financial advice. Trading involves risk, and past performance doesn’t guarantee future results. Do your own research and consult a financial advisor before making any decisions. The author is not responsible for any losses. Trade at your own risk.

#SUNDARMFINFundamentals:
* ROCE - 9.2%, ROE - 14.2%. Debt to Equity - 4.5 (Financial companies use debt as their inventory)
* EPS / Revenue - has been steadily increasing
* FIIs - Have marginally increased holding from 18.42% to 18.61% which it is high.
* Retail holding levels have gone down marginally
* Promoter holding has remained steady mostly
* Domestic instituitions have reduced stake
Technicals:
* Price is consolidating and forming a triangle pattern
* Volumes have subsided indicating silent accumulation by Instituitions
* RVOL is just near 100%, and last two sessions the volume indicates increase in trading
* Relative strength is strong / Momentum indicates steady maintenance / ADR is 4.4% and indicating up move
* Weekly chart shows clear signs of consolidation and a potential double bottom move.
* In weekly chart we can see that the stock is trying to consolidate and the 10 WEMA is trying to cross above 20 WEMA
* Price has remained stuck at 23.2% fibo and now trying to move up.
The stock is not that fundamentally sound compared to its peers. However, it is presently giving a very tight entry opportunity.
Additionally, the CNX Finance / Nifty Bank / Nifty PSU Bank are showing strength.
In this market of gloom, that is the only sector which is trying to shine.
Note - Entry / SL / Target / Position size - Please figure out on your own based on risk appetite
Disclaimer - Your money requires your due diligence! I merely analyze and bring out probabilities. All the best.

Sundaram Finance Ltd - Technical & Fundamental AnalysisFundamental Analysis
1. Financial Performance (Q3 FY2024-25)
Total Income: ₹2,207.35 crore (+20.75% YoY)
Net Profit After Tax: ₹451.18 crore
EPS: ₹143.50
Return on Equity (ROE): 12.52%
P/E Ratio: 31.80 (Moderate valuation compared to sector peers)
Dividend Yield: 0.66%
Market Cap: ₹50,703 crore
2. Recent Market Performance & Sentiment
The stock saw a 3.60% decline in the last session.
Analysts have set a 12-month target of ₹4,517.10, with a high estimate of ₹5,570 and a low of ₹3,820.
Sector Performance: Sundaram Finance has been an outperformer among NBFCs, showing strong loan book growth and stable asset quality.
Technical Analysis
1. Price Action & Key Levels
Current Price: ₹4677
Trend: The stock is consolidating within key Fair Value Gaps (FVG) and Order Blocks (OB), indicating a decision point.
Key Resistance Levels (Bearish OB & FVG)
Bearish OB - Hourly: ₹4691.95 (Immediate resistance)
Bearish FVG: ₹4725-4760 (Strong resistance zone)
Bearish OB - Daily: ₹4785 & ₹4815 (Major supply zones)
Ultimate Resistance: ₹4929-4965 (Bearish OB + FVG)
Key Support Levels (Bullish OB & FVG)
Bullish FVG: ₹4418-4673 (Currently holding above this zone)
Bullish FVG: ₹4421-4480 (Strong demand zone)
Critical Support: ₹4399 & ₹4213
Bullish Scenario (Breakout Above ₹4725)
If price sustains above ₹4725, it can move toward ₹4760 → ₹4785 → ₹4815.
A confirmed breakout above ₹4965 would indicate a strong bullish trend.
Bearish Scenario (Rejection at ₹4691-4725)
If price rejects ₹4691-4725, expect a pullback to ₹4673 → ₹4480 → ₹4399.
If price falls below ₹4213, a bearish trend may continue.
Final Call: Bullish above ₹4725 | Bearish below ₹4673.
Disclaimer
This analysis is for informational purposes only and not financial advice. Stock prices are volatile, and investing involves risks, including loss of capital. Do your own research and consult a financial advisor before making decisions. We are not liable for any losses. Trade responsibly.

SundarMfinStock Opportunity --> Sundaram Finance Limited
Symbol: #SUNDARMFIN
Entry Level: Above €4,650
Target: 4,900 | *5,165
Stop-Loss: 4,530
Technical Setup: Suddenly volume increase and start forming big candles at 1
hour time frame.

Sundaram Finance | Double Bottom | Market Structure Breakout Sundaram Finance
Reasons for Breakout
1) Market Structure Breakout forming higher highs and higher lows
2) Trying to fill the gapup
3) Formation of "W" at the bottom

Sundarmfin Breaking OutNSE:SUNDARMFIN today broke out with RSI and MACD showing Buy Signal. Major Support and Resistance are shown on charts
📌Thank you for exploring my idea! I hope you found it valuable.
🙏FLLOW for more
👍BOOST if useful
✍️COMMENT Below your views.
Meanwhile, check out my other stock ideas below until this trade is activated. I would love your feedback.
Disclaimer: This analysis is intended solely for informational and educational purposes and should not be interpreted as financial advice. It is advisable to consult a qualified financial advisor or conduct thorough research before making investment decisions.

Sundaram Finance Ltd. Chart Analysis The technical analysis of **Sundaram Finance Ltd.** using multiple indicators and features, including **Heikin Ashi candles**, **ATR trailing stops**, **support and resistance levels**, and various oscillators like **MACD** and **RSI**. Here is a detailed breakdown of the key observations:
---
### **1. Price Action and Trend Analysis**
- **Heikin Ashi Candles**:
- The green candles indicate an uptrend, and the red candles indicate a downtrend.
- There is a visible **falling wedge pattern** highlighted during the recent downtrend. A falling wedge is typically a **bullish reversal pattern**, which aligns with the price breakout seen at the end of the wedge.
- **Support and Resistance Levels**:
- Key resistance: Marked in purple (₹5,535.85).
- Key support: Marked in blue (₹3,732.90). The price seems to have tested this support level during the recent downtrend and rebounded.
- **ATR Trailing Stops**:
- The red and green trailing stop lines show dynamic support and resistance. The price has shifted above the green ATR line, indicating a bullish reversal.
---
### **2. Volume Analysis**
- **Volume Spike Indicator**:
- The histogram shows increasing green bars during the upward movement, suggesting strong buying momentum.
---
### **3. MACD Indicator**
- **MACD Lines**:
- The blue and red lines represent the MACD and Signal lines, respectively.
- The bearish divergence marked earlier (when the price made higher highs but MACD made lower highs) indicates weakening bullish momentum, which led to the correction.
- The MACD histogram has turned positive again, signaling a bullish crossover and renewed upward momentum.
---
### **4. RSI (Relative Strength Index)**
- **RSI Lines**:
- The green line represents the RSI value (38.03 currently).
- RSI is moving upwards from the oversold zone, which suggests a possible reversal in the trend.
- Breaking above the midline (50) will further confirm bullish strength.
---
### **5. Pattern Highlight**
- **Falling Wedge**:
- The falling wedge is a strong reversal pattern, and its breakout suggests potential upward movement.
- The breakout is supported by rising volume, adding strength to the pattern.
---
### **Key Insights and Forecast**
1. **Bullish Signs**:
- Price has broken out of the falling wedge pattern with strong volume.
- MACD bullish crossover and RSI moving out of oversold zones support a positive outlook.
2. **Resistance Levels**:
- Immediate resistance at ₹4,450 (marked by ATR and prior consolidation zone).
- Major resistance at ₹5,535.85.
3. **Support Levels**:
- ₹3,732.90 remains a strong support.
4. **Caution**:
- Watch for any pullback towards the support zone, especially if volume weakens or RSI fails to break 50.
---
### **Trading Strategy**
- **Long Position**:
- Enter on a retest of ₹4,000-₹4,100 zone (if confirmed with bullish candles).
- Target 1: ₹4,450 | Target 2: ₹5,535.
- Stop-loss: ₹3,700.
- **Short-term Momentum**:
- Monitor for MACD histogram and RSI strength to sustain.

SUNDARAMFINAll Time High Break & ABCD Pattern form in Daily Chart, Find out entry in shorter time frame and Target will be 6000

SUNDARMFIN HIGH PROBABLE SETUP- price started from w1 support
broke 2 restistances,
- now pulling back ( coz d1 break down)
for weekly direction, d1 break down require as valid pull back
- 50% level of retracement, which is rbs level also in w1
- need daily eg (blue candle closing above the close of previous candle) for an entry sl below structure. tp 5700 1st tp then trail sl.
- you can see trap sellers as well.
- hold till you see w1 break down on the flow
- relative strength has also change to green

Sundaram Finance - Swing CMP 3825
Add on dips till 3600
SL 3450
Tgt's 4k - 4100-4200
For more info - Plz visit my profile
Dont miss to Boost & Share the Idea - Comments are Welcome
Rgds,
Naresh G
SEBI Reg RA

Amazing breakout on Weekly TF - SUNDARMFINCheckout an amazing breakout happened in the stock in Weekly timeframe.
IMPORTANT BREAKOUT LEVELS ARE ALWAYS RESPECTED!
NOTE for learners: Place the breakout levels as per the chart shared and track it yourself to get amazed!!
#No complicated chart patterns
#No big big indicators
#No Excel sheet or number magics
PS: No new Nifty500 script can escape from me when making a breakout. :-)
PS: This script is shared 1-2 days delayed. Sorry for the delayed charts.
Breakouts happening in longer timeframe is way more powerful than the breakouts seen in Daily timeframe. You can blindly invest once the weekly candle closes above the breakout line and stay invested forever. Also these stocks breakouts are lifelong predictions, it means technically these breakouts happen giving more returns in the longer runs. Hence, even when the scrip makes a loss of 10% / 20% / 30% / 50%, the stock will regain and turn around. Once they again enter the same breakout level, they will flyyyyyyyyyyyy like a ROCKET if held in the portfolio in the longer run.
Time makes money, GREEDY & EGO will not make money.
The real deal is when to purchase and where to purchase the stock. That is where Breakout study comes into play.
Example: 5000/- invested equally in all BO stocks where out of 15 stocks only 1-2 stocks goes beyond -50% SL, where rest of the stocks flies like an eagle. The secret recipe is "Patience with correct study" and "Large diversification" and "TIME"

[Swing Trade] SUNDARMFINSUNDARMFIN has been in a bullish zone and building up the volumes nicely. Expecting it to raise another 5% from current levels.
DYOR - This is not buy or sell reco

sundaram finance is looking ready for upswingKeep a watch on sundaram finance, its looking ready for an up swing, only for education purpose


LONG TERM BET $NSE:SUNDARMFIN The stock has broken out on the monthly chart and is consolidating before a big move. It is a slow mover so one can look to buy on CMP or buy on dips between 3050-3250 for targets of 3800-4400 in the coming months with a sl below 2550 on a monthly closing basis.
It is a slow mover so one should patiently buy and hold.
NOTE: NOT SEBI REGISTERED. THIS IS NOT AN INVESTMENT STRATEGY AND ONE SHOULD DO RESEARCH OR CONSULT WITH THEIR FINANCIAL ADVISOR BEFORE TAKING ANY INVESTMENT DECISIONS.THIS IS ONLY FOR EDUCATIONAL AND LEARNING PURPOSES.

SUNDARMFIN - Weekly Chart AnalysisAfter making an ATH in Feb2021 the stock topped out and went into a down trend until it bottomed almost after one and half year.
The stock then formed a base of 30weeks in 11% range and broke out of it in may to test the supply zone where it consolidated for 9 weeks in 7% range and finally broke out this week with almost 10% move this week. Though an attempt was done last week but failed to give a close above 2739.95
Volumes are on the rise since the breakout from first base. It is also trading above all its key moving averages.
Now ideally we shall wait for small retracement or a base if formed then good. If it retest the previous resistance, which is now support zone (2674.65-2739.95) and shows strength then it would be the best entry point.
As per the trend based fib 3440 - 3950 - 4600 are the levels it can test in the long term.
My view gets invalid if it closes below 2480 levels on weekly basis and sustains below it.
Disclaimer: This is just an analysis and not a buy/sell recommendation. If you intend to trade this counter then do your own due diligence and trade at your own risk.


Sundaram finance darvas boxGood consolidation near to break out ,200 dma and resistance together form bullish ascending triangle+ darvas Box

► ADVANCE PATTERN #28: SUNDARMFIN ◄► ADVANCE PATTERN #28: SUNDARMFIN ◄
📌 Levels are mentioned on chart for ❝Swing trading❞.
☆ Please check the description section ⌨ for early entry level in given stock ₪ to get better Risk to Reward (☈☈) ratio.
☆ Kindly like & share ➥ this pattern. Comment ⎚ with what do you think. Follow me @ tradingview for more updates and like the chart ❤!!!
Entry: ▲ 2424
SL: ☢ 2323
Target: ➚ 2727
RR: ☈ 1:3.0
☆ Thank you. Happy Trading!!!
Best Regards,
𝘿𝙧. 𝙎𝙝𝙖𝙢𝙧𝙖𝙟𝙖 𝙉𝙖𝙙𝙖𝙧
𝙋𝙝𝘿 𝙞𝙣 𝙏𝙚𝙘𝙝𝙣𝙤𝙡𝙤𝙜𝙮.
✮ Disclaimer ✮
--------------------------------------------------------
All investments involve risk, and the past performance of a security, industry, sector, market, financial product, trading strategy, or individual’s trading does not guarantee future results or returns. Investors are fully responsible for any investment decisions they make. Such decisions should be based solely on an evaluation of their financial circumstances, investment objectives, risk tolerance, and liquidity needs.
---------------------------------------------------------


Sundarm FInance - Weekly breakout🔴DISCLAIMER
***** It's just for an educational purpose, So you must also follow your own technical analysis before taking up the trades ******
Aggressive traders enter at the breakout and conservative traders may give entry after retracement (Retracement is optional, we cannot expect every stock to take a retest after the breakout, it may also continue to have its bullish pressure after the breakout)
Ideal Target and Stop Loss should be minimum 1:2 RRR (Risk reward ratio)
After reaching our targets, Book 50% Profits and trail your stop loss to get maximum profits from rest of the 50% in your trade.
