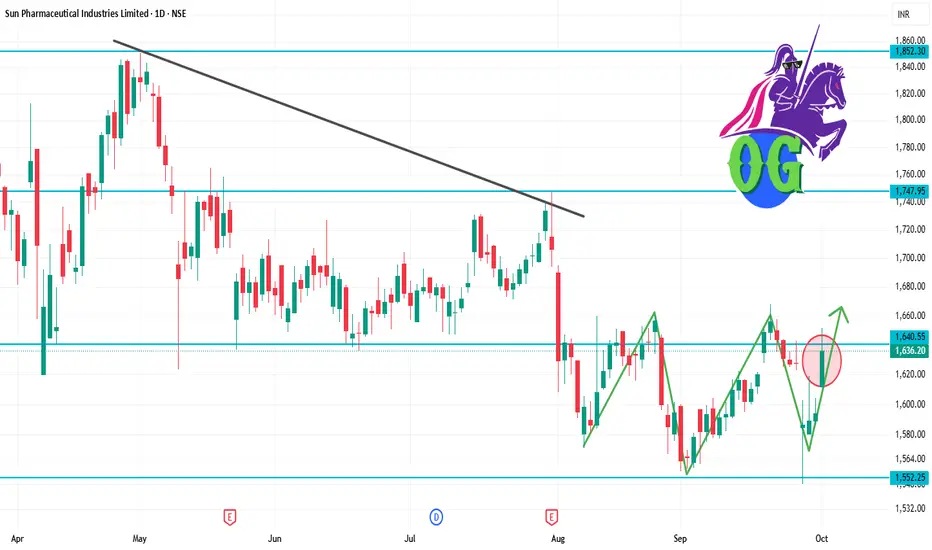
SUNPHARMA 1D Time frameCurrent Snapshot
Current Price: ₹1,636.20
52-Week High: ₹1,952.25
52-Week Low: ₹1,548.00
Strategy & Outlook
Bullish Bias: The stock is in a short-term uptrend with positive momentum indicators.
Buying Opportunity: Consider entering near support zones (₹1,600–₹1,610) with a target towards ₹1,650–₹1,670.
Risk Management: Place stop-loss orders below the support levels to manage potential downside risks.
SUNPHARMA trade ideas
SUNPHARMA 1D Time frameOpening Price: ₹1,611.90
Closing Price: ₹1,628.20
Day Range: ₹1,611.90 – ₹1,651.50
Previous Close: ₹1,594.30
📉 Trend Analysis
Short-Term Trend: Bearish — The stock is trading below key moving averages, confirming the bearish trend.
Medium-Term Trend: Neutral — The stock is in a consolidation phase, characterized by lower highs and lower lows.
Long-Term Trend: Neutral — No significant trend identified; the stock is trading within a range.
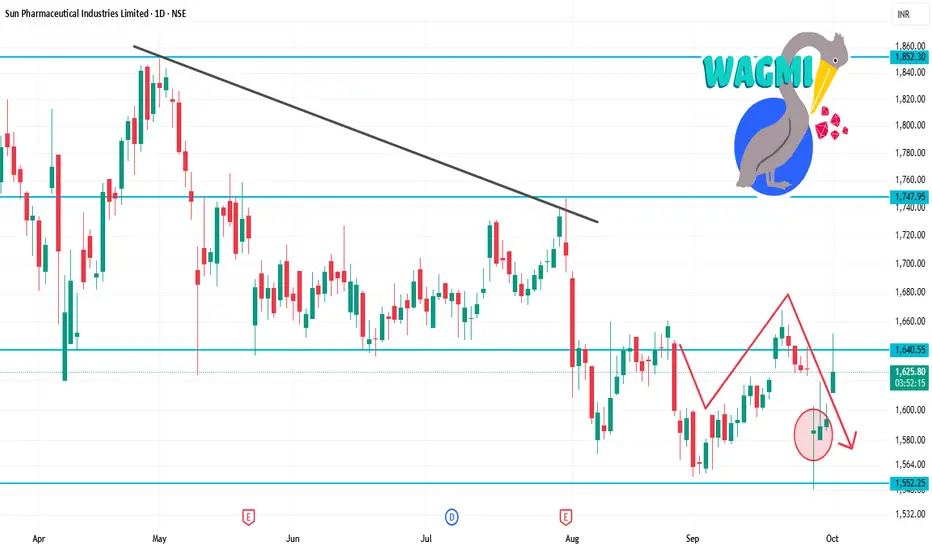
Y model pattern This is ideally we call it as Y model pattern where at one end it squezes resulting an
strong outside braked market movement
Some of the patterns we named as per our Own methods for General idea purpose
i have suggested an view of entry which i consider as best suited in the Market
This is education content
Good luck
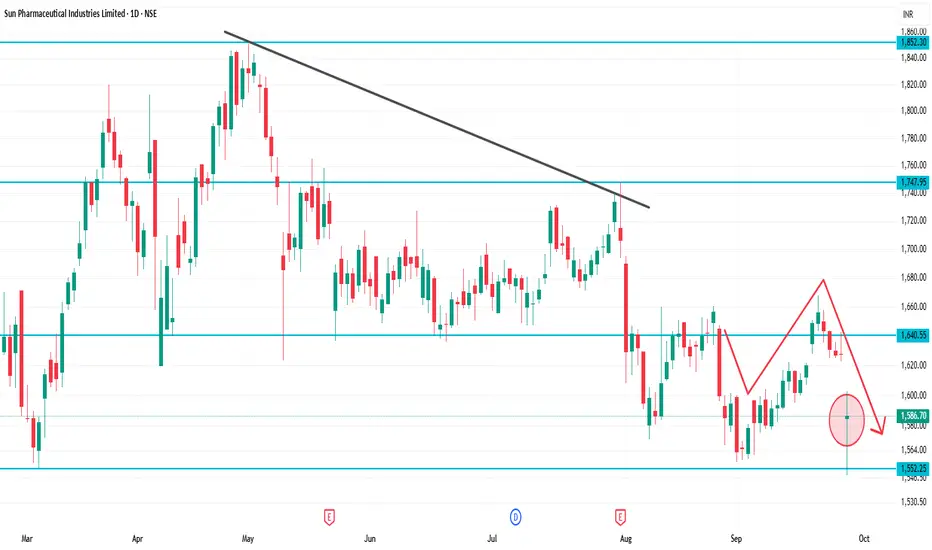
SUNPHARMA 1D Time frameCurrent Price: ~₹1,586
Day Range: ~₹1,582 – ₹1,600
52-Week High: ~₹1,960
52-Week Low: ~₹1,553
📈 Technical Outlook
Immediate Support: ₹1,580 (very close to current price)
Strong Support: ₹1,553 – ₹1,560 (52-week low zone)
Immediate Resistance: ₹1,600 – ₹1,620
Major Resistance: ₹1,650 – ₹1,670
Trend Bias:
Stock is weak, testing lower supports.
If it breaks below ₹1,580, then ₹1,553 may be tested.
A bounce is only possible if it sustains above ₹1,600.
📌 Step-by-Step Market View
Above 1,600: Chance for small recovery toward ₹1,620 – ₹1,650.
Stays between 1,580 – 1,600: Consolidation zone.
Breaks below 1,580: Weakness may extend to ₹1,553.
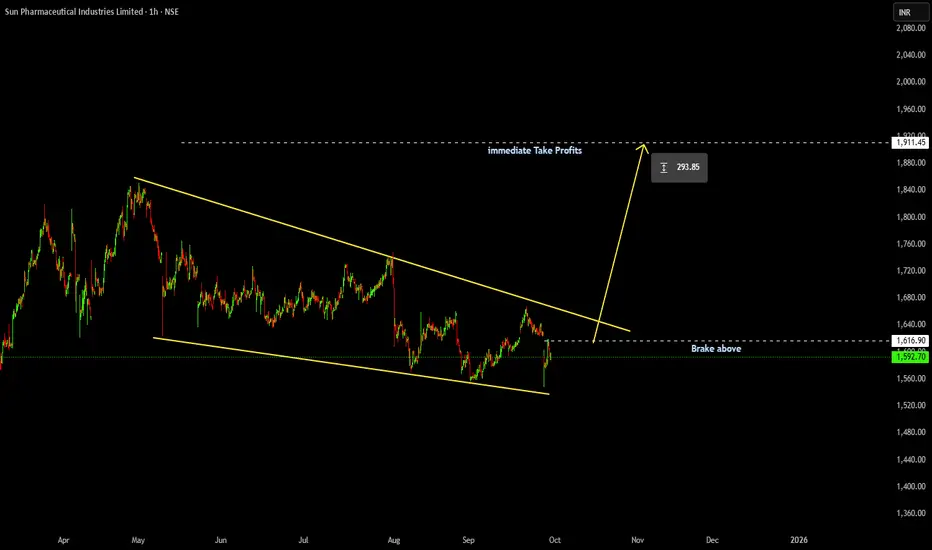
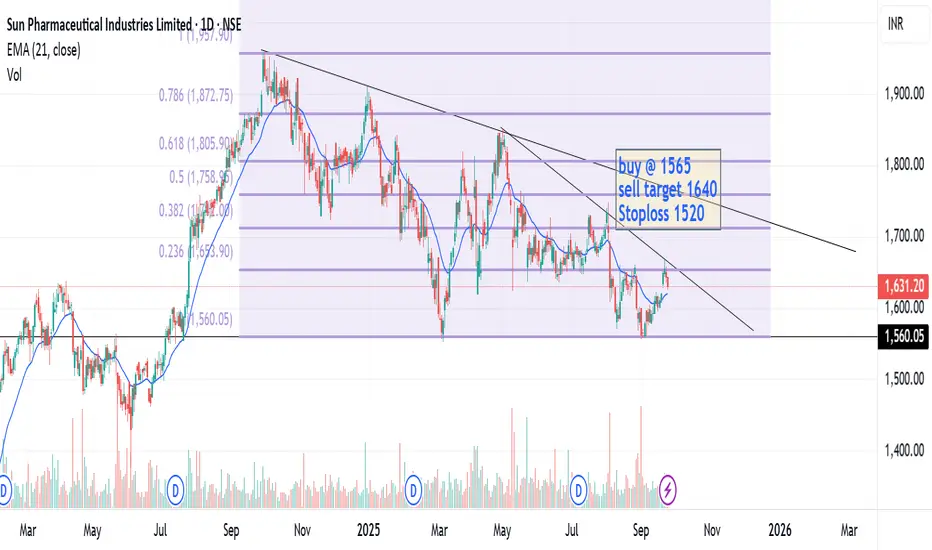
Buy at support sell at targetI have drawn the fib retracement band and support resistance lines. The support line is very strong which the stock will hit. and so when the support is tested and bounces back, please buy and sell at the first target point.
SUNPHARMA 1D Time frame🔍 Current Price
Approximately ₹1,646 – ₹1,650
🧮 Strategy / Trade Ideas
Long Setup:
If price holds above ₹1,630 – ₹1,620 and shows reversal signals (bullish candle etc.), opportunity to go long.
Target zones: first towards ₹1,655 – ₹1,660, then potentially ₹1,675 – ₹1,680.
Stop-loss could be just below support around ₹1,620 to manage risk.
Short / Pullback Setup:
If price faces resistance near ₹1,655 – ₹1,660 and fails to break with conviction.
Potential downside toward ₹1,630 first, then ₹1,600 if that support doesn’t hold.
Breakout Setup:
If price clears and sustains above ₹1,675 – ₹1,680, especially closing above ₹1,745 – ₹1,755, there may be scope for further upside.
✅ Summary
Sun Pharma on the daily chart is moderately bullish. Key for continuation is holding above support in lower ₹1,600-₹1,630 zone, and overcoming resistance around ₹1,655-₹1,660. A breakout above ₹1,675-₹1,680 would strengthen bullish case; failure to hold support could lead to downside.
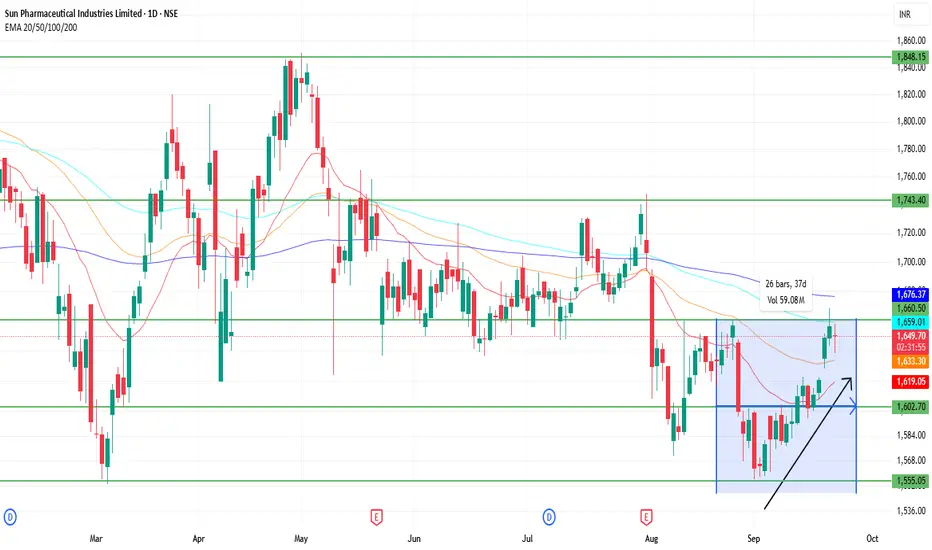
Bearish Shark in Sunpharma - Looking for 1700+
TF: 75 Minutes
CMP: 1635
The pattern set up is self explanatory. Failed break below the previous low (Shark hunting SLs) and move up higher.
Trade set up for this pattern suggests that, we should take trade only at the completion of D (in this case 1730).. it is up to you to define your actions according your trading style.
On Daily TF
You can notice that the last time when the price was at 1550 range in March 2025, it moved up by 200-250 points. Price is now bouncing off of the same zone and we can safely assume that the buyers are active in that zone.
Secondly, the shakeout/failed breakdown (of 7th Aug low) will most likely propel this move up higher.
On Cloud, price meets all the criteria for bullishness on 60 or 75 minutes TF. 1620-1625 is the immediate support zone. 1590-1605 is the cloud Support.
However, price is trading below the cloud on Daily TF (bearish on daily)
As far as overall structure of this script is concerned, On Wave counts, it appears that 4th wave has ended on weekly TF and the price should move up higher, potentially taking out ATH.. But we need confirmation by breaking the swing highs first (1660 break is the first sign)
Finally, on Moving averages, Price is just above 50 DEMA and trading well below 200 DEMA, 20 and 30 WEMA.. The cluster is at 1670-80, a potential resistance zone for this series.
Disclaimer: I am not a SEBI registered Analyst and this is not a trading advise. Views are personal and for educational purpose only. Please consult your Financial Advisor for any investment decisions. Please consider my views only to get a different perspective (FOR or AGAINST your views). Please don't trade FNO based on my views. If you like my analysis and learnt something from it, please give a BOOST. Feel free to express your thoughts and questions in the comments section.

SUNPHARMA 1D Time frameUpdated Snapshot
Current Price: ₹1,607
Day’s Range: ₹1,595 – ₹1,617
Previous Close: ₹1,610
🔹 Support & Resistance
Immediate Support (S1): ₹1,600 – ₹1,595
Next Support (S2): ₹1,585 – ₹1,580
Immediate Resistance (R1): ₹1,615 – ₹1,617
Next Resistance (R2): ₹1,630 – ₹1,635
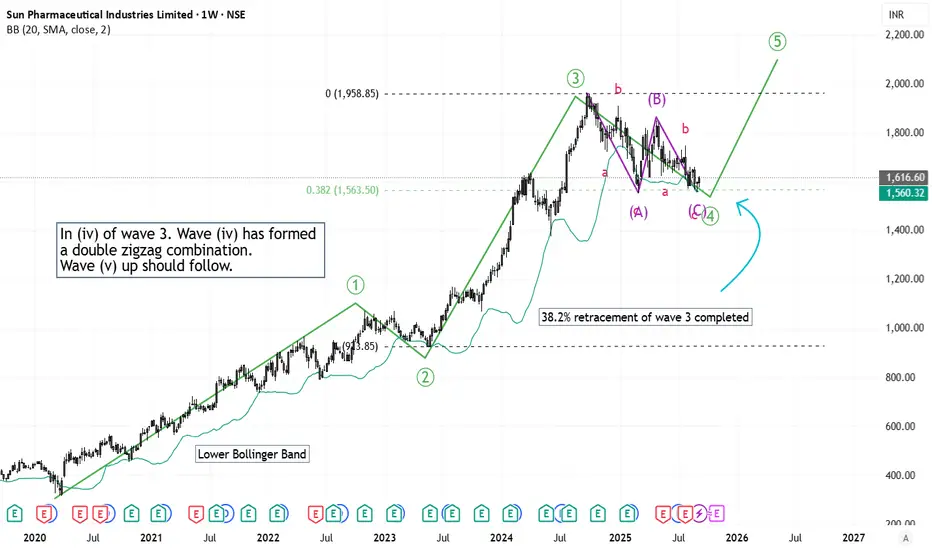
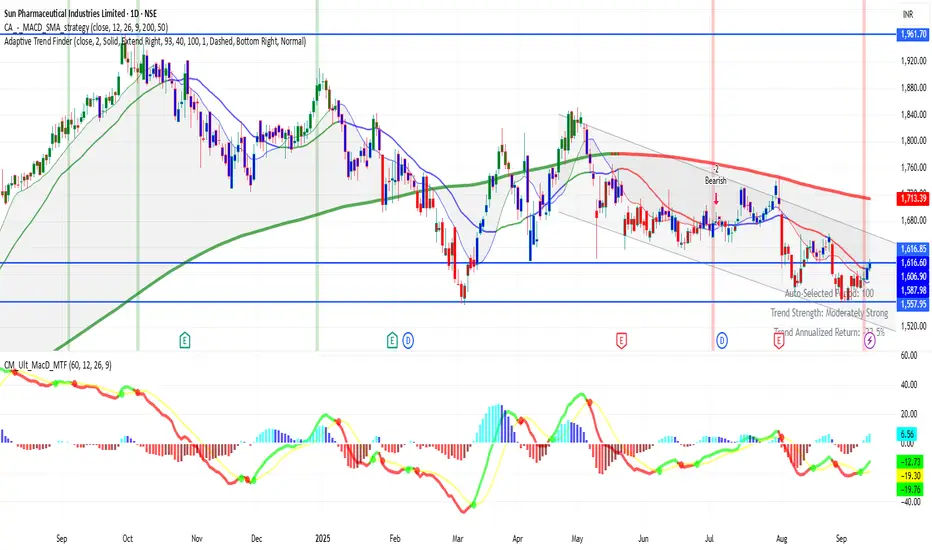
Elliott Wave Analysis of SUNPHARMAIn (iv) of wave 3. Wave (iv) has formed a double zigzag combination retracement pattern. The 38.2% retracement level has been completed. The script is bullish now for many months, upto a year or so.
SUNPHARMA 1D Time frameCurrent Snapshot
Stock is around ₹1,616
52-week range: ~ ₹1,553 (low) up to ~ ₹1,960 (high)
Price is significantly below its 52-week peak, indicating past weakness or profit-taking from highs.
Bullish Scenario
If price can hold above the support (~₹1,590–₹1,600) and pushes above the immediate resistance (~₹1,620–₹1,630):
Could see a move toward ₹1,660–₹1,670.
If resistance is crossed with strength, next targets would be ~₹1,740-₹1,750 or more, depending on momentum.
SUNPHARMA 1D Time frame📈 1-Day Price Action
current: ₹1,610.50
Open: ₹1,592.50
High: ₹1,614.00
Low: ₹1,592.50
Close: ₹1,611.10
Volume: 1.14 million shares
🔧 Technical Indicators
Relative Strength Index (14): 65.29 — indicates bullish momentum
MACD: 6.80 — suggests upward trend
Moving Averages: 5-day MA: ₹1,608.84, 50-day MA: ₹1,586.46, 200-day MA: ₹1,610.12 — all signaling a buy
Pivot Point: ₹1,610.10 — aligns with current trading level
📊 Trend & Levels
Trend: Bullish
Support: ₹1,600
Resistance: ₹1,620
🧠 Market Sentiment
Analysts maintain a positive outlook on Sun Pharma, with JM Financial retaining a "Buy" rating and a revised target price of ₹2,025, reflecting confidence in the stock's potential for appreciation over the next year.

SUNPHARMA | Buy & Sell Setup | 10 Sep 2025 – 16:20 ISTSUNPHARMA | Buy & Sell Setup | 10 Sep 2025 – 16:20 IST
Buy Zone: 1605 – 1585
Sell Zone: 1586 – 1576
Scenario : Buy
Entry: 1597
Stop Loss: 1586
Targets:
TP1 → 1660.50
Analysis:
From Buy Zone (1605 – 1585) creates possibilities for a buy move.
Scenario 2 : Sell
Entry: 1586
Stop Loss: 1597
Targets:
TP1 → 1577.50
TP2 → 1558.00
TP2 → 1553.00
Analysis:
From Sell Zone (1586 – 1576) creates possibilities for a sell move.
Stay alert on updates here.
⚠️ Disclaimer: This idea is shared for educational purposes only and should not be considered financial advice. Please do your own analysis before making trading decisions.

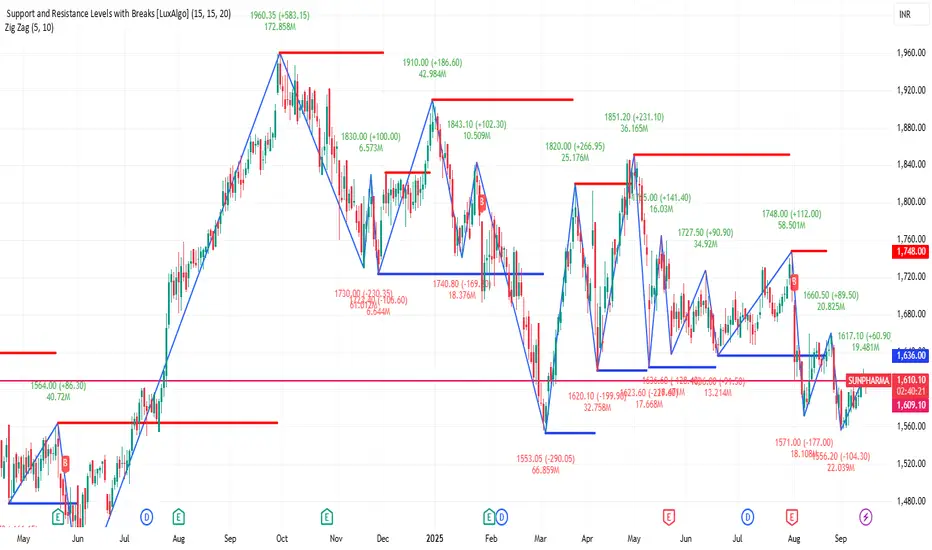
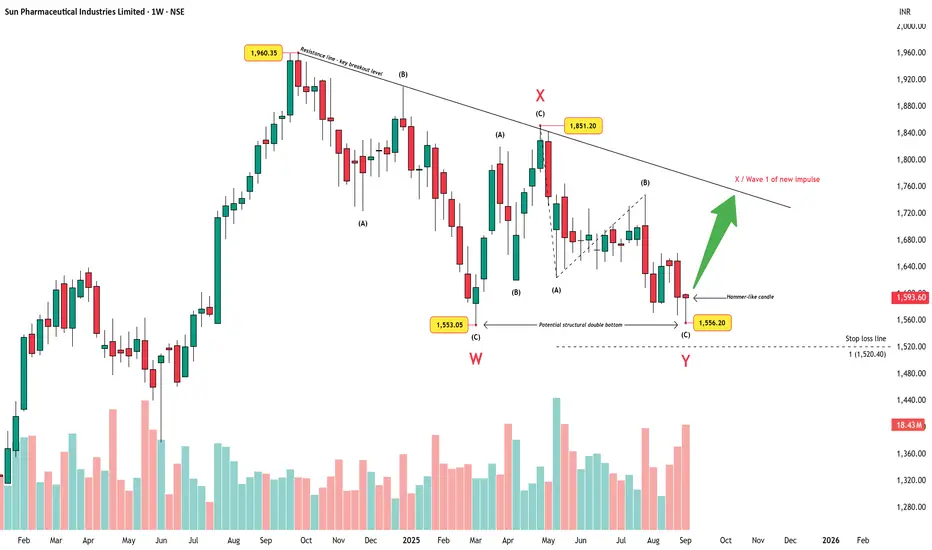
Sun Pharma – Double Bottom and Trendline Test AheadChart Summary
Sun Pharma’s weekly chart shows a completed W–X–Y corrective structure. Wave W bottomed near ₹1,553.05, followed by a corrective X at ₹1,851.20, and Wave Y terminating at ₹1,556.20. This final Y-leg has unfolded as an abc zigzag, respecting the larger corrective framework.
Price Action Highlights
A potential structural double bottom has formed around the ₹1,553–₹1,556 zone, hinting at possible exhaustion of the correction.
The latest candle is a hammer-like bar, suggesting demand stepped in around support levels.
Overhead, a major downtrend resistance line connecting the highs (₹1,960.35) to the swing X (₹1,851.20) remains the decisive breakout level.
A clear stop-loss line sits near ₹1,520.40, aligned with the 100% extension of Wave A inside Y. A break below this level invalidates the bullish case.
Volume Perspective
Recent selling has come with a volume spike, often seen during exhausation selling phases. If volume eases on follow-up candles while price holds above the support zone, it strengthens the case for a reversal.
Outlook
If price can sustain above the ₹1,553–₹1,556 support cluster and eventually break the trendline resistance, it may confirm the end of the corrective phase and open the door for a new impulsive sequence higher. Failure to hold the stop-loss zone, however, would negate this view and suggest further downside.
Disclaimer: This analysis is for educational purposes only and does not constitute investment advice. Please do your own research (DYOR) before making any trading decisions.
Using Fibonacci Time Zone tool for Swing TradeThe Fibonacci Time Zone tool in TradingView is a technical analysis drawing feature that plots a series of vertical lines along the time (horizontal) axis of a price chart. These lines are spaced according to the Fibonacci sequence (starting with 0, 1, 2, 3, 5, 8, 13, 21, 34, 55, 89, etc.), where each subsequent number is the sum of the two preceding ones. Unlike price-focused Fibonacci tools (e.g., retracements or extensions), this tool ignores price levels entirely and focuses solely on time intervals to forecast potential market turning points. It is typically drawn by selecting two points on the chart—often a significant swing high or low as the starting point (time 0)—and then extending lines to the right at Fibonacci-based intervals. The first few lines (e.g., 1, 2, 3) often cluster closely and are less reliable, so traders commonly start analyzing from the 5th or 8th zone (13 or 21 periods ahead) for more spaced-out projections.
Key Benefits of the Fibonacci Time Zone Tool in TradingView
This tool adds a temporal dimension to technical analysis, complementing price-based indicators by helping traders anticipate when significant events might occur rather than just where in price.

buy opportunity for sunpharmalet it slide past 1570 and go for buy at 1560 if it shows some strength in coming weeks

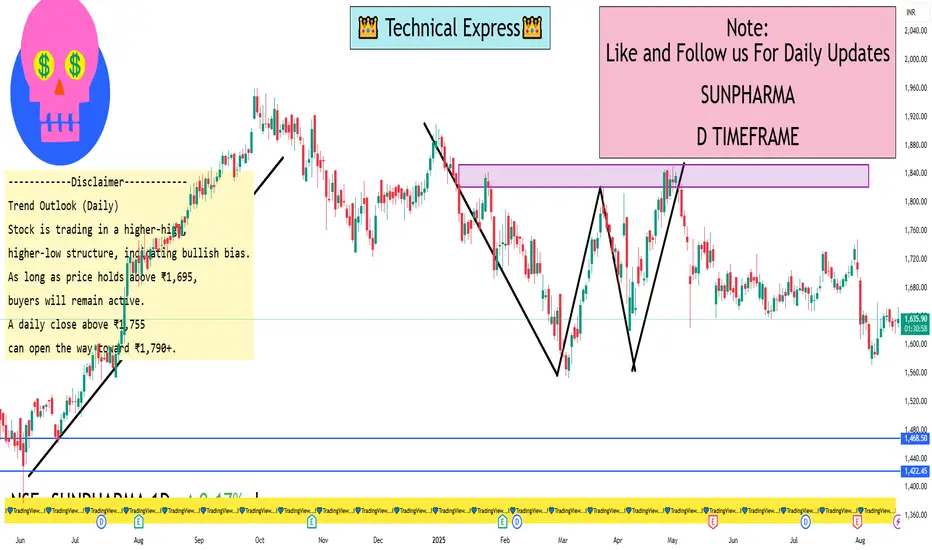
Sunpharma 1 day ViewSun Pharma – Daily Chart Levels
Immediate Resistance: ₹1,745 – ₹1,755
Major Resistance Zone: ₹1,790 – ₹1,810 (breakout zone for further rally)
Immediate Support: ₹1,705 – ₹1,695
Strong Support Zone: ₹1,660 – ₹1,650
Trend Outlook (Daily)
Stock is trading in a higher-high, higher-low structure, indicating bullish bias.
As long as price holds above ₹1,695, buyers will remain active.
A daily close above ₹1,755 can open the way toward ₹1,790+.
A break below ₹1,695 may bring downside toward ₹1,660.
SUN PHARMAHello & welcome to this analysis
From the pandemic lows made in March 2020 till date it has likely completed Wave 1, 2 & 3 and is doing a time wise (TRIANGLE) corrective wave 4.
The sub waves of 4 are suggesting "c" is ending with "d" and "e" pending before it resumes the terminal wave 5 impulse.
This is suggesting that for quite a bit of time the stock could remain range bound.
This wave count of a triangle will be invalid if current decline goes below 1547 and/or the expected bounce in wave "d" goes above 1857.
Wave 5 target could be anywhere between 2400-2500
All the best
Sunpharma - At cheap valuation Sunpharma has potential due to some of the reent developments - new drugs, market & pricing. Sunpharma is beaten down again sentimentally due to the US Tariffs, which is likey to be steering away slowly. Sunpharma is also seeing huge accumulation and is likely to shoot up drastically soon. It might go down for a bit but will change direction basis strong fundamentals. It will not give change to enter once it starts to go up sharply.
Expected range : 1800-2000

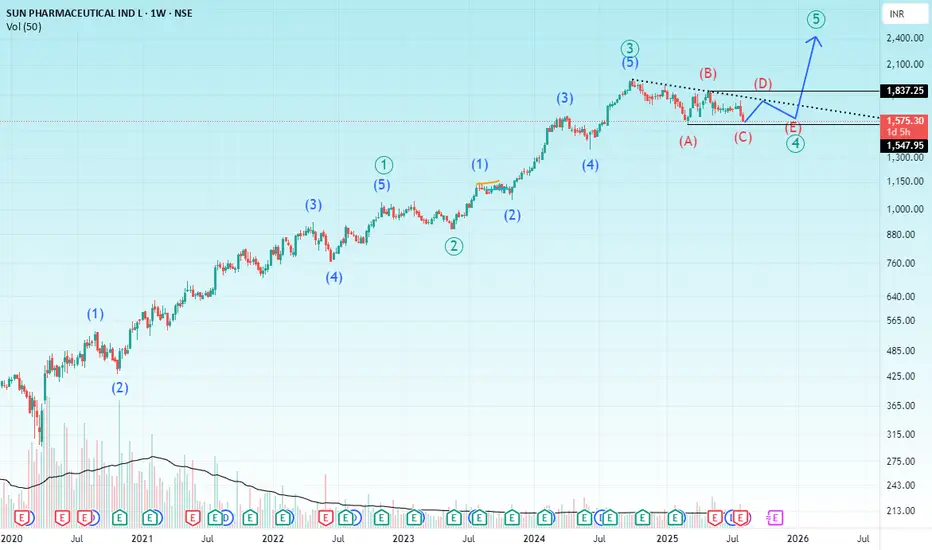
Sun Pharma: A Bullish OutlookHello Friends,
Welcome to RK_Chaarts,
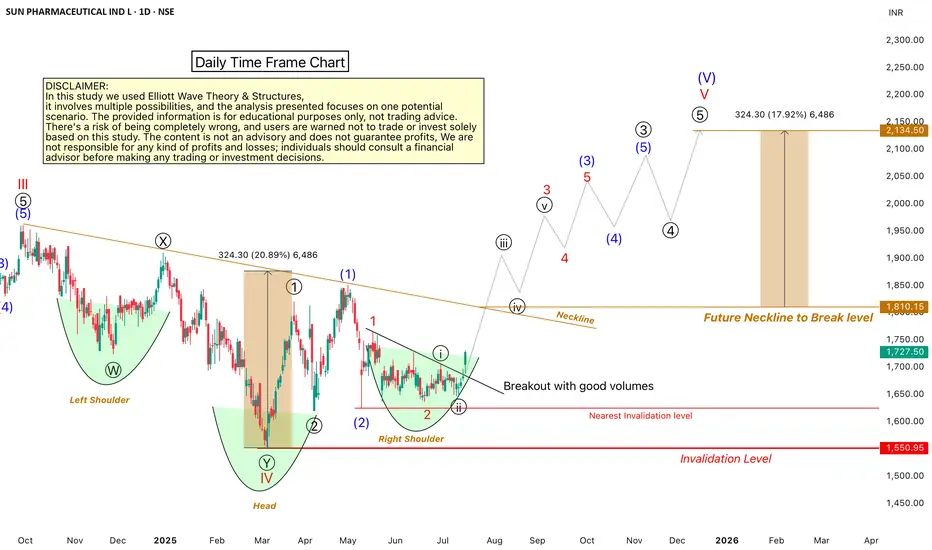
Let's analyze the Sun Pharmaceuticals chart using technical analysis, specifically the Elliott Wave Theory. According to this theory, the September 2024 top marked the end of Wave III cycle degree in red, and the March 2025 bottom marked the end of Wave IV cycle degree in red Now, Wave V of cycle degree in red has begun, which will move upward.
Within Wave V, we should have five sub-divisions of Primary degree in black, with Wave ((1)) & Wave ((2)) already completed. Wave ((3)) has started, with five further sub-divisions of one lower degree intermediate degree, We've marked these in blue, with Wave (1) and Wave (2) completed, and Wave (3) started. Within Wave (3), we have minor degree waves in red, with Wave 1 and Wave 2 completed, and Wave 3 breaking out today with good intensity of volumes.
We can see that the wave counts are super bullish, and so is the RSI, which is above 60. The MACD is also positive, and the price is above the 50-day and 200-day EMAs on the daily and weekly time frames. There's no moving average hurdle, which is another super bullish sign.
We can also see a higher high and higher low formation, which is a bullish sign according to Dow Theory. Additionally, an inverted head and shoulders pattern is forming, with the right shoulder being made. When it breaks out above the neckline, it will give us a target, which aligns with the Elliott Wave Target projection.
All these indicators – technical analysis, price action, and Elliott Wave – point to a bullish trend. However, there's an invalidation level at 1550; if the price falls below this level, our wave counts will be invalidated.
We're projecting targets between 2000-2200 based on Elliott Wave theory projections. Please note that this analysis is for educational purposes only and should not be considered as investment advice.
This post is shared purely for educational purpose & it’s Not a trading advice.
I am not Sebi registered analyst.
My studies are for educational purpose only.
Please Consult your financial advisor before trading or investing.
I am not responsible for any kinds of your profits and your losses.
Most investors treat trading as a hobby because they have a full-time job doing something else.
However, If you treat trading like a business, it will pay you like a business.
If you treat like a hobby, hobbies don't pay, they cost you...!
Hope this post is helpful to community
Thanks
RK💕
Disclaimer and Risk Warning.
The analysis and discussion provided on in.tradingview.com is intended for educational purposes only and should not be relied upon for trading decisions. RK_Chaarts is not an investment adviser and the information provided here should not be taken as professional investment advice. Before buying or selling any investments, securities, or precious metals, it is recommended that you conduct your own due diligence. RK_Chaarts does not share in your profits and will not take responsibility for any losses you may incur. So Please Consult your financial advisor before trading or investing.
upcoming Trade set up Hi Friends I have made visual representation of pattern based trading
this chart represents one of the Most ideal pattern found in the Market
This is education content not an advisory
Good luck
SUNPHARMA 1HRSWING TRADE
- EARN WITH ME DAILY 10K-20K –
SUNPHARMA Looking good for upside..
When it break level 1744 and sustain.. it will go upside...
BUY@ 1744
Target
1st 1760
2nd 1781
FNO
SUNPHARMA MAY FUT – LOT 9 (Qty-3150)
SUNPHARMA MAY 1740 CE – LOT 9 (Qty-3150)
Enjoy trading traders.. Keep add this STOCK in your watch list..
Big Investor are welcome..
Like this Post??? Hit like button..!!!
Follow me for FREE Educational Post and Alert..
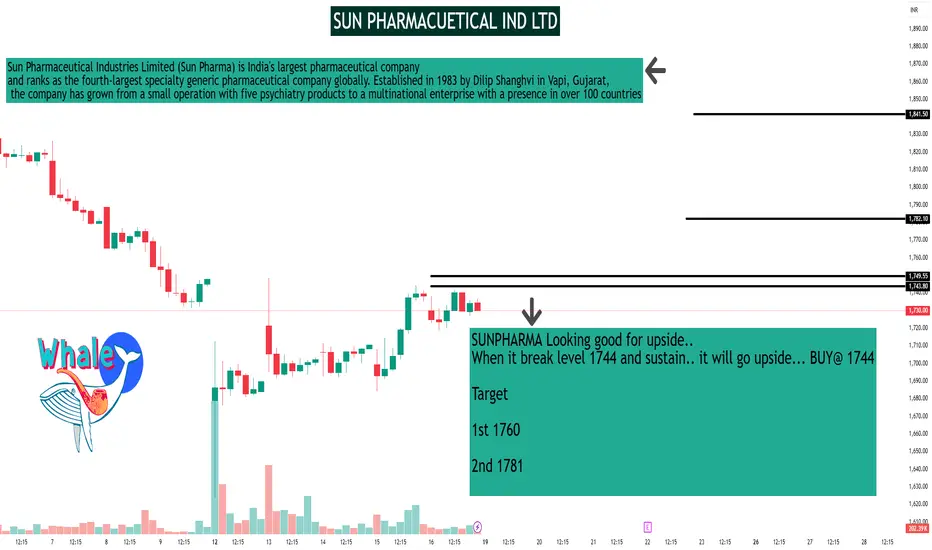
SUN PHARMACUETICAL IND LTDSUN PHARMACEUTICAL IND L
SUNPHARMA THR
SWING TRADE
- EARN WITH ME DAILY 10K-20K -
SUNPHARMA Looking good for upside..
When it break level 1744 and sustain.. it will go upside... BUY@ 1744
Target
1st 1760
2nd 1781
FNO
SUNPHARMA MAY FUT - LOT 9 (Qty-3150)
SUNPHARMA MAY 1740 CE - LOT 9 (Qty-3150)
Enjoy trading traders.. Keep add this STOCK in your watch list..
Big Investor are welcome..
Like this Post??? Hit like button..!!!
Follow me for FREE Educational Post and Alert..
Short Sunpharma on technical analysis till 1680Siunpharma looks week in daily chart and seems it can fall 1680 zone as per price support on that area where bulls vcan activate and bears will close their position.
📈 Technical Indicators
Moving Averages: Strong Sell
Technical Indicators: Strong Sell
RSI (14): 31.939 (Approaching oversold territory)
MACD (12,26): -13.57 (Bearish)
ADX (14): 30.04 (Indicates trend strength)
Williams %R: -97.69 (Oversold)
🔍 Demand & Resistance Zones
Demand Zone: ₹1,840–₹1,850
Sellers' Liquidity Zone: ₹1,920
Major Resistance: ₹1,960 (All-time high on Sep 30, 2024)
📌 Trade Setup
Entry: Consider long positions near ₹1,850 or upon breakout above ₹1,860
Targets:
Target 1: ₹1,920
Target 2: ₹1,960
Stop-Loss: Below ₹1,820
Risk-Reward Ratio: Minimum 1:2
🧠 Fundamental Insights
Analyst Consensus: Buy
12-Month Price Target: Average ₹2,051.84 (Upside of ~14.98%)
EPS Growth Forecast: 12.3% per annum
Revenue Growth Forecast: 9.8% per annum
Return on Equity Forecast: 16.9% over 3 years
🧬 Recent Developments
Acquisition: Acquired Checkpoint Therapeutics for $355 million in March 2025, enhancing oncology portfolio
Earnings Beat: Q3 FY25 EPS of ₹13.40 vs. estimate of ₹11.98; Revenue of ₹136.75B vs. estimate of ₹133.98B
