SUNPHARMA trade ideas

SUNPHARMA - 12% PROFIT POTENTIALIt is on a great trend right now
following all Moving Average and chart patterns that it is going to go UP .
Good time to buy

Sunpharma Bullish reversalTaking support over the lower TL of the channel pattern. Looks good at cmp for swing trade with a decent RR of 1:2.5X . Trade with small qty looking at the global concerns.

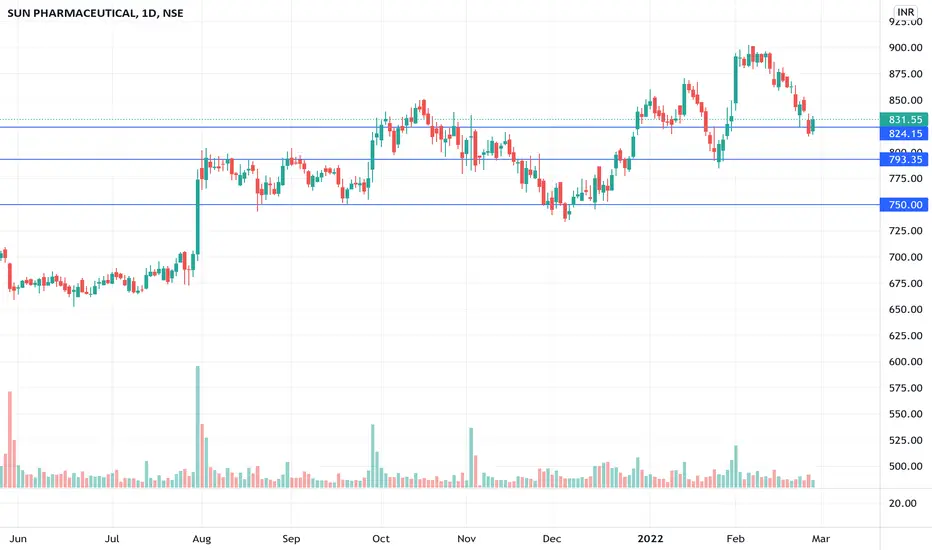
SUNPHARMAThis stock has been in uptrend since long time. It retraced from its all time high and rebound from its support which was resistance earlier. Buy above 835, TGT 900, SL 795. For educational purpose only. Kindly contact your financial advisor before entering any trade.
Swing Opportunity in Sun PharmaGo Long above 837.05 for Targets of 859.1, and 881.15 with SL 815
Reasons to go Long :
1. On a Daily timeframe if we draw the Fibonacci retracement tool from recent swing low (point A) to recent swing high (point B) then we see stock took support from 0.5 Fibonacci level.
2. In addition to this a bullish candlestick pattern Bullish Engulfing (marked with orange color) is formed around 0.5 Fibonacci level.
3. Also there is a strong Trendline (marked with green color), from which the stock is taking support and moving up.

SUNPHARMA ANALYSISAscending Triangle intact.
If candle close above $850.
We can take & hold until it reach $875/$897 & $1002.
Pyramiding is the best option now.

Long #SUNPHARMA for TGT - 890 , Swing Trade- Reason - 120 DMALong #SUNPHARMA for TGT - 890 , Swing Trade- Reason - 120 DMA

Post Analysis of My TradeI have traded this stock yesterday...
And Today also I have found opportunity to trade this,
when it made first long shadow candle in 15 minute time frame after consolidation.

SunPharma Trade Opportunity for Next Week (21-Feb onwards)1 Day Time Frame :
1. Sunpharma may give some correction from here
2. Look for trade setup in intraday
Disclaimer :
> This analysis is for educational purpose only.
> Keep an eye on global market as well, trade as per market condition.

Sunpharma BearishThere was a small range from 2nd Feb 2022 - 11th Feb 2022 which has been broken and stock faced resistance from that range and is currently resting above 20 sma. Sunpharma will go into a bearish trend if the daily candle on 21st march will close below 20 Sma.
For targets shift to weekly chart:-
T1 - 815 (20 sma line)
T2 - 785 (Trend line is being formed since 23rd March 2020 which hasn't been broken yet so we can expect reversal from there)
This is for educational purposes only. I post to test my view. Do not Trade on my idea's 100% loss guaranteed.


SUNPHARMA READY TO BLAST Hello everyone this chart technically measured and filtered by team INFINITYIV.
INDICATORS. you will clear see a 3hr candle out side the BB and its meaning indicated by arrow. You can easily under stand what’s next. Thanx you can paper trade it.

SUNPHARMA | SELL ONLY BELOW 870Sun Pharma has shown a good run-up and looking to play some retracement. Sell only if it sustains below 870 for the lower marked targets on the chart.
To motivate us, Please like the idea If you agree with the analysis.
Happy Trading!
InvestPro India Team

SUNPHARMA Breakout RetestSUNPHARMA Breakout Retesting.
SUNPHARMA gave a breakout with a good volume few days ago, and then it is consolidating in a small range. It hasn't broke the breakout level yet.


Above all key moving averages, relative strong against marketAbove all key moving averages, relative strong against market
Good above 900

SUNPHARMA A HIGH CONVICTION PUT TRADEA very nice uptrend resistance and a combination of harmonic numbers, looks like its ready to tumble down xD

sunpharma flag and pole pattern sunphram flag and pole pattern going long good momentum if break privious day high

Sun Pharma Bullish SetupSun Pharma Bullish Setup with low risk entry. above 50/200 sma, can target upto 965-1000

Sunpharama flag and pole pattren Sunpharama making flag and pole pattren. this chart is on 15 minutes. There is not an tip or stock recommendation there was just an idea.


SunPharma - Ready to go for longDetails explained on Chart.
Simple analysis for learning and growing.
Only for Educational Purpose. Consult your Advisor before any investments.

Breakout in Sun Pharmaceutical...Chart is self explanatory. Entry, Targets and Stop Loss are mentioned on the chart.
Disclaimer: This is for demonstration and educational purpose only. This is not buying or selling recommendations. I am not SEBI registered. Please consult your financial advisor before taking any trade.
