SUNPHARMA trade ideas

trading inside the parallel channel
T- 850
SL : 760 ( closing basis)
Reason : Technically poised to touch the upper line of Parallel channel, launching new product.

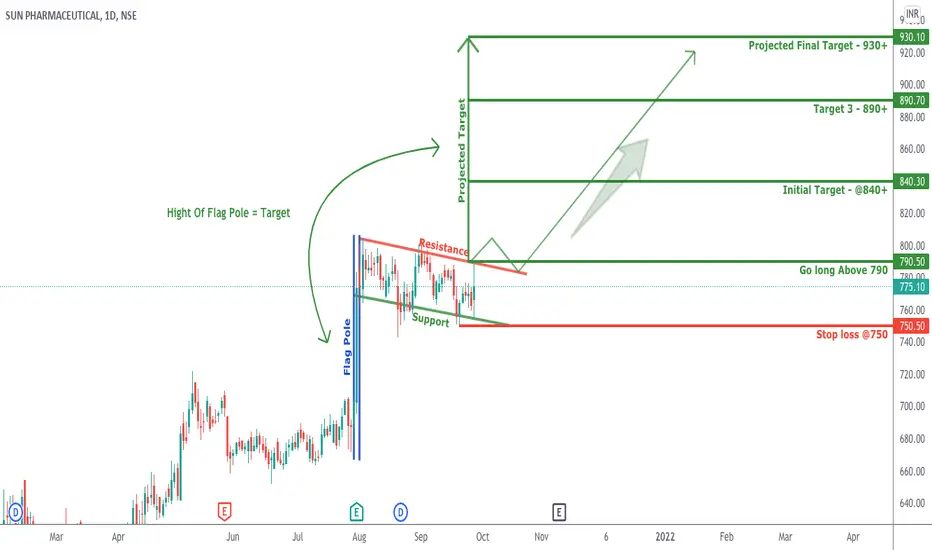
Flag Pattern in SUNPHARMA expected 930+ Target after breakoutOn Daily time frame SUNPHARMA created flag pattern. If this stock gives breakout the resistance zone and started trading above 790 then expected further bullish rally towards the 930+ target in short term period.
high possibility to breakout 1200 level long term stockwhen it break 804 above then it is go beyond 1500 soon very good stock to entry for new comer use paper trading for education purpose keep risk management strategy always 1 to 2 percentage

Sunpharma longSunpharma long
Flag Pattern breakout
Buy at CMP- 794
SL- 758
Target- 822, 865
Disclaimer- We are not SEBI registered advisor.
Charts and views are only for educational purpose.


NSE SUNPHARMA Bullish Gartley HourlyAs per harmonic pattern in Hourly timeframe is showing Bullish Gartley
trade idea is already shared with risk reward ratio of 1:2
Kindly enter in trade when any Bearish or reversal candle is seen at the entry price 👆🙏
best of luck

Sunpharma - sell intraday/stbtSell from cmp to 767
easy target 750
tg2 - 740
Disclaimer : This is my personal analysis for study purpose not intended for trading


Sun pharma Forming a symmetrical triangleSymmetrical triangle is formed in Sun pharma if breakout then 850 is short term target.

DESCENDING TRIANGLE IN SUNPHARMA ( ANALYSIS OF SUNPHARMA)A descending triangle is a bearish chart pattern used in technical analysis that is created by drawing one trend line that connects a series of lower highs and a second horizontal trend line that connects a series of lows. Oftentimes, traders watch for a move below the lower support trend line because it suggests that the downward momentum is building and a breakdown is imminent. Once the breakdown occurs, traders enter into short positions and aggressively help push the price of the asset even lower
How to Trade a Descending Triangle
Most traders look to initiate a short position following a high volume breakdown from lower trend line support in a descending triangle chart pattern. In general, the price target for the chart pattern is equal to the entry price minus the vertical height between the two trend lines at the time of the breakdown. The upper trend line resistance also serves as a stop-loss level for traders to limit their potential losses.
KEY TAKEAWAYS
1. A descending triangle is a signal for traders to take a short position to accelerate a breakdown.
2. A descending triangle is detectable by drawing trend lines for the highs and lows on a chart.
3. A descending triangle is the counterpart of an ascending triangle, which is another trend line-based chart pattern used by technical analysts.


Clear buy call for intraday profitNice pattern breakout for intraday gains.Resistance break and following new trend.right time to buy and want to know how to make 5% to 50% just dm to 7989408915


Wait and buy ( not a recommendation)Wait and buy ( not a recommendation)
Buy price 796.75
Stop Loss at 787
Target Price 840


SUNPHARMA DESCENDING TRIANGLE FORMATIONSUNPHARMA has formed a descending triangle and on a important support levels go short only if breaks the support levels and take the targets as marked on chart or as per your analysis. Comment down if you enter the trade and share your views on this.

[POSITIONAL] SUNPHARMA LONG BET risk: Reward ratio is 1: 2
Rest as per Charts
********
Note -
One of the best forms of Price Action is to not try to predict at all. Instead of that, ACT on the price. So, this chart tells “where” to act in “what direction. Unless it triggers, like, let’s say the candle doesn’t break the level which says “Buy/Sell if it breaks”, You should not buy/sell at all.
=======
I use shorthands for my trades.
“Positional” - means You can carry these positions and I do not see sharp volatility ahead.
“Intraday” -means You must close this position at any cost by the end of the day.
=======
Always follow a stop loss.
In the case of Intraday trades, it is mostly the “Low/High of the Candle”.
In the case of Positional trades, it is mostly the previous swings
********


SUN PAHRMA BUY LEVELSThe stock is looking good to buy around 755 and can add more around 740-735 if we get these levels for 790-780 Target until the lower red line is intact.
To motivate me, Please like the idea If you agree with the analysis.
Happy Trading!
InvestPro India Team
