SUNPHARMA trade ideas

Sun PharmaSun pharma
Big breakout
Ready for 1240
sl 1245
Once cross 1175 sharp upmoves
1180 ce option holders

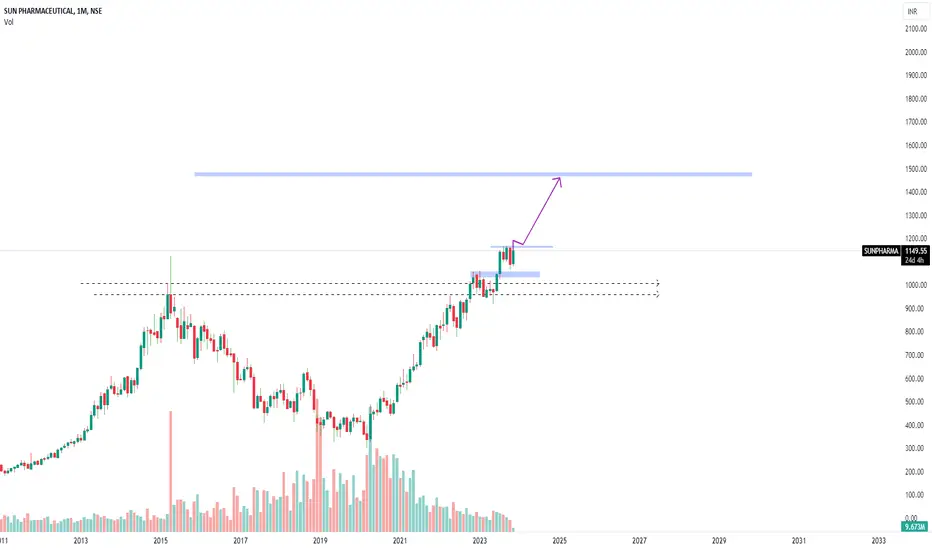
SUNPHARMAMonthly breakout happened in sun pharma Target is 1490. It gets around one and half year.SL below 1040 below.
SunPharma in consolidationstock was in consolidation for many days and looks like ready for a bounce back and also for a breakout or a breakdown
if the stock goes for a breakdown i may go for option buying, if it goes for a bounce back which seems more promising i will go for a swing trade : which is best

FLAG PATTERN ON WEEKLYAccumulation after rally
Forming a good range
Look for a close outside the box & ride for next target.

$NSE:SUNPHARMA Is SUNPHARMA ready to break the channel this timeNSE:SUNPHARMA Is SUNPHARMA ready to break the channel this time ?
Ignore if huge gap down or gap up.
Follow strict stop loss.
Disclaimer:
This is not a financial, investment or trade advice. Its only for educational purpose.

#Sunpharma cash : Breakout level is 1170 closing basis#Sunpharma cash -Positional call
18.10.2023
Breakout level is 1170 on closing basis
Cmp 1153.40


Sun pharma consolidation breakSun pharma has been consolidating after good runup up to 1160 from its low around 950. MACD is showing now good strength as MACD line about to cross its signal line, moreover scrip is trading above its 21 EMA on daily chart which further indicating bullishness in this stock, hence, more risk appetite traders can initiate adding this stock for the target of 1230-40 and more risk avers traders should wait this stock to break it resistance at 1160 with good volume.
Place strict SL at 1110-12 as this is a great support for the scrip.

📈 Exciting Bullish Pattern Alert! 🐂📈 Exciting Bullish Pattern Alert! 🐂
📊 Pattern: Symmetric Triangle
📌 Symbol/Asset: SUNPHARMA ( Updated )
🔍 Description: Stock is in a consolidation and making pattern. Soon we can see momentum after breakout !!
👉 Disclosure: We are not SEBI registered analysts, this is not a buy or sell recommendation. Technical patterns are just one piece of the puzzle. Consider conducting further research, consulting with a financial advisor, and managing your risks appropriately.

$NSE:SUNPHARMA Looks bearish for Mon 16th, but follow strict SLNSE:SUNPHARMA Looks bearish for Mon 16th, but follow strict stoploss.
Ignore if huge gap down or gap up.
Disclaimer:
This is not a financial, investment or trade advice. Its only for educational purpose.

$NSE:SUNPHARMA Looking bearish for tomorrow,but follow strict SLNSE:SUNPHARMA Looking bearish for tomorrow, but follow strict stop loss.
Disclaimer:
This is not a financial, investment or trade advice. Its only for educational purpose.

$NSE:SUNPHARMA Looks bearish, but follow strict stop lossNSE:SUNPHARMA Looks bearish, but follow strict stop loss
Disclaimer:
This is not a financial, investment or trade advice. Its only for educational purpose.


Sun pharma short setup is one of its major suppliers. The Isra
Sun Pharma, which is the largest pharmaceutical company in India by revenue. Sun Pharma has a strong presence in Israel, where it acquired Taro Pharmaceutical Industries in 2010. Taro is one of the leading generic drug makers in Israel and the US, and contributes significantly to Sun Pharma’s earnings. The Israel war may affect the production and distribution of Taro’s products, which may impact Sun Pharma’s performance and reputation.

Symmetrical Triangle Breakout and pull back pattern seenHello Traders and Investors, i hope you all will be doing good.
I have seen symmetrical breakout in SunPharma so publishing this..you can take advantage with that.
Guy's Sun Pharma is looking good on chart, as it has given a breakout of kind of symmetrical triangle pattern and today price has make a pull back pattern which is going to retest the levels. Price is above 200-EMA which is positive sign for this and MACD also giving bullish crossover.. there is higher chances that we can see this above 1200 in coming few days. So for triangle pattern i already have explained earlier in other stocks. I will add below for your reference. Go and check about this pattern.
Important levels for Sun Pharma:-
Take from now cmp 1144
Keep stop loss at 1121
Targets we can see in upside 1186/1211++
Let's focus on about company:-
Sun Pharmaceutical Industries Ltd is engaged in the business of manufacturing, developing and marketing a wide range of branded and generic formulations and Active Pharma Ingredients (APIs). The company and its subsidiaries has various manufacturing facilities spread across the world with trading and other incidental and related activities extending to global market. It is the largest pharmaceutical company in India.
Market Cap
₹ 2,74,508 Cr.
Current Price
₹ 1,144
High / Low
₹ 1,170 / 922
Stock P/E
31.1
Book Value
₹ 233
Dividend Yield
1.00 %
ROCE
16.4 %
ROE
16.6 %
Face Value
₹ 1.00
Debt
₹ 6,886 Cr.
EPS
₹ 35.2
PEG Ratio
1.18
Promoter holding
54.5 %
Intrinsic Value
₹ 518
Pledged percentage
2.29 %
EVEBITDA
21.3
PROS
Company has delivered good profit growth of 26.4% CAGR over last 5 years
Company has been maintaining a healthy dividend payout of 56.0%
CONS
The company has delivered a poor sales growth of 10.6% over past five years.
Tax rate seems low
Company has a low return on equity of 14.0% over last 3 years.
Disclaimer:- Please always do your own analysis or consult with your financial advisor before taking any kind of trades.
Dear traders, If you like my work then do not forget to hit like and follow me, and guy's let me know what do you think about this idea in comment box, i would be love to reply all of you guy's.
Thankyou

Sun Pharma new waveSun Pharma can start a new rally foe new highs if hold these levels around 1100-1110.. Will update

Buy Sun PharmaSun Pharma is in bullish trend and after correction it has taken support near 1117 forming a doji candle and also on RSI taken support near 40. Now again started its up move. On weekly and monthly charts it is uptrend. Looks favorable bet for one to go long. Buy around 1133 with stop loss 1118 and a target of 1160

Sun Pharma 1400 forming Flag & Poll target Sun Pharma consolidating after giving Cup and Handle pattern breakout.
Forming poll and flag pattern on weekly time frame.
breaking above 1170 would activate flag pattern and Target would be 1400


SUNPHARMA bullish with tgt 1220- 1250 18/09/23Sun Pharmaceutical Industries Ltd. Seems to be trending and bullish for a target of 1220 - 1250 and major trend line support near 1100-1127 levels
1. RSI daily / weekly / monthly above 60
2. Price taking trend line support
3. Narrowing Bollinger bands
4. Price near Upper Bollinger bands
5. Price under congestion for last 3-4 days
Disclaimer: I am not an expert I just share interesting charts here, Please seek expert opinion before investing and trading as trading/ investing in market is subject to market risks. I do not hold any position in the stock as on date but I may look to buy on dips with my own Risk Reward matrix

#Sunpharma cash : Looks good above 1170.10#Sunpharma cash -
Positional call for 6 months
12.09.2023
Flag pattern formation
Looks good above 1170.10
Stoploss 1100
Tgt 1380-1400 and above
Cmp 1145.25
