SUNPHARMA - possible correction SUNPHARMA -- Quick up move from 925 to 1050+ levels in 2 weeks.
Based on Harmonic pattern - we can see Bearish Cypher in hourly time frame.
And even though the Market is in a strong uptrend yesterday - we see a fall from 1053 to 1032.
If the trend continues after slight consolidation at 1026- 1018 levels, we should be testing 972 soon.
1024 will be critical for support - keep an eye & trade carefully.
Add to watchlist.
SUNPHARMA trade ideas

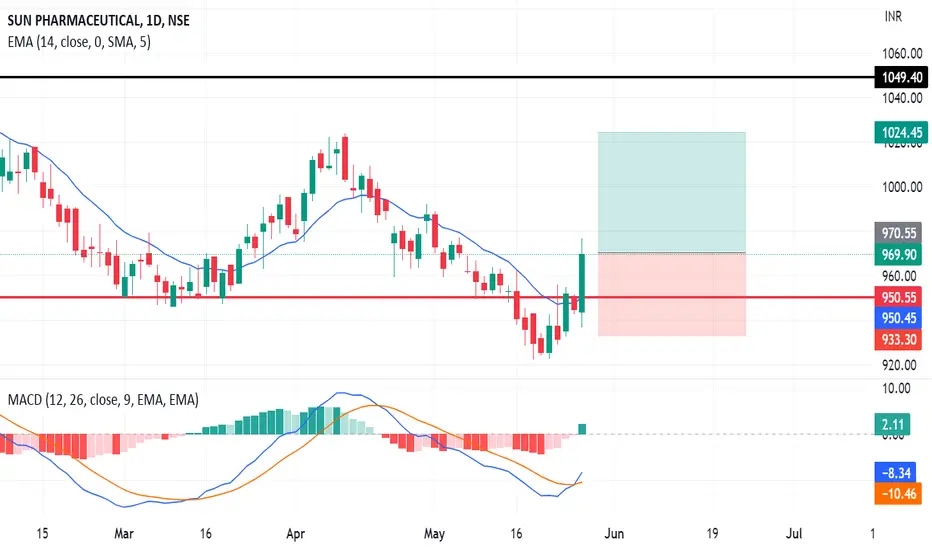
Swing Trading Opportunity in Sun PharmaOn the daily timeframe chart of Sun Pharmaceutical, the price is approaching a resistance zone that has been tested multiple times. As this resistance has been tested multiple times, it may be considered a weak resistance. If the price gives a strong breakout above this resistance zone, it could present a great opportunity to take a swing trade.
For entry, we can go long after a breakout of a strong bullish candle above the resistance zone. It is advisable to initially enter with half quantity, as most breakouts tend to fail. After the breakout, when the price pulls back to the flip zone to take support and then starts moving in the direction of the breakout, we can add the other half quantity. Sometimes, the price doesn't pull back, which is why we enter the trade with half quantity after the breakout candle closes.
Regarding the stop loss, we can keep it below the resistance zone with some buffer.
We can set the target near the all-time high, as it may provide a significant resistance level and a potential area of profit-taking for traders. However, it is important to note that we should also monitor the price action closely and adjust our target accordingly if we see any signs of weakness or reversal in the trend.
If you enjoyed this content, please consider giving it a like and following me for more updates on market analysis and trading strategies. Your support is greatly appreciated!

📈 Exciting Bullish Pattern Alert! 🐂📈 Exciting Bullish Pattern Alert! 🐂
📊 Pattern: Bullish Broadning Pattern
📌 Symbol/Asset: Sun Pharma
🔍 Description: Breakout stock with momentum
👉 Remember: Technical patterns are just one piece of the puzzle. Consider conducting further research, consulting with a financial advisor, and managing your risks appropriately.

Sun PharmaSun Pharma - Ready to fly
Buy above 1007 | Tgt 1055 | Sl 984
Keep following to catch the moment

Sunparma - Near All time high (Resistance)The information provided in this TradingView post is for educational and informational purposes only. It should not be construed as financial or investment advice. Trading in financial markets involves risk, and past performance is not indicative of future results. The author of this post is not a licensed financial advisor or broker, and they do not provide personalized investment recommendations.

SUN PHARMA longPresently, Sun Pharma is looking good for short-term trading. In the last trading session, the bullish candle has given the breakout of the inside candle and trading above 14 days EMA. And, MACD turned positive.
Disclaimer - I am not a SEBI-registered technical analyst and advisor so contact your financial advisor and make a self-decision. I will not be responsible for any profit and loss
sun pharma This is only for education purpose only. I am not SEBI register. This equity scrip is subject to market risk. Please check your own analysis before you take a trade.


SUN PHARMA INDUSTRIES IS READY?DISCLAIMER
Our video is intended only to provide general and preliminary information to traders/investor and shall not be considered as any investment decision. Do your own analysis, This is not a buy or sell tip. This is just for educational purpose only. And I'm not responsible for your Profit or loss as I'm not a SEBI registered financial advisor.

#Sunpharma cash : Flag pattern target 1120#Sunpharma cash -Positional call
29.06.2023
Looks good above 1025.10
Stoploss 980
Target 1060-1065/1120
Cmp 1022

SUNPHARMA IHNS Breakout Buy!Attached: SUNPHARMA Daily Chart as of 28th June 2023
- On Wednesday Price gave a Strong Bull Power Candle Breakout signal activating a Bull Flag + Inverted Head & Shoulder Pattern, pay attention to the Green Neckline
- Moreover this Stock has the Highest Weightage in the Nifty Pharma Index so Pharma cannot move up without Sun Pharma participating (I have already maintained a bullish stance on pharma and it is paying off well, see my related ideas)
The Target for the Breakout is 1070
Stop Loss for same can be Day's Low or below 1000 closing

SUNPHARMA breaks out. Finally, after 10 months of consolidation Sun Pharma had broken out its resistance level on a daily timeframe. We can see a good uptrend from here.


#SUNPHARMAShunted till 992 above 972
Shunted tlll 946 if enters 972
Crossing 980 confirms the upside trend till 993

Sunpharma Analysis Stock is trading in a narrow zone after BD, IB BO awaiting, follow chart for proper support and resistance levels.

sunpharma resistance zone 1019-1030#sunpharma astro level 1019..
coming back near supply zone of 1019-1030..
bulls need to be cautious here..
note : above info is for educational purpose

Sunpharma Channel Pattern Sun Pharma is more potent occurs with the breakout. Falling channel pattern breakout either on upper or lower side.....
" MY VIEW ON DOWNSIDE "

Sunpharma - BearishLooks Weak on Charts
Keep upper trendline as SL for the target of lower trendline.
SL: 1015
Target: 950 / 930 / 910

Long Sun Pharmaa strong candle above 1018 on 15 min TF can give a good upside. Do your own analysis before execution, it is for educational purpose only

Short Sun PharmaBreakdown possible below 941. Came out of the channel after quite some time.
Short on Monthly Basis
T1-T3-868-803-721 SL 1000
Monthly Setup 3-6 months

Sun Pharma It has been coming out of Regression Trend, now channel break out candidate
New 52 week high , positional 1200 target

SUNPHARMASUNPHARMA - Channel pattern breakout
Buy above 1005, the target is 1022.
It is just a view, please trade at your own risk.

#Sunpharma cash : Looks good around 990-995#Sunpharma cash -Positional call
04.06.2023
Looks good around 990-995
Stoploss 965
Tgt 1040/1080
Cmp 999.60
