Supreme Industries: Breakdown Below Ascending SupportThe daily chart of Supreme Industries is showcasing a strong bearish signal with a breakdown below a long-held ascending trendline. The structure clearly resembles a descending triangle pattern, and the breakdown confirms growing weakness in price action, favoring sellers in the near term.
1. Bear
Next report date
—
Report period
—
EPS estimate
—
Revenue estimate
—
70.05 INR
9.61 B INR
103.82 B INR
60.20 M
About Supreme Industries Limited
Sector
Industry
CEO
Mahaveer Prasad S. Taparia
Website
Headquarters
Mumbai
Founded
1942
ISIN
INE195A01028
FIGI
BBG000D0M7M0
Supreme Industries Ltd. engages in the business of manufacturing plastic products. Its product segments include plastic piping, industrial, packaging, consumer, and others. The company was founded on February 17, 1942 and is headquartered in Mumbai, India.
Related stocks
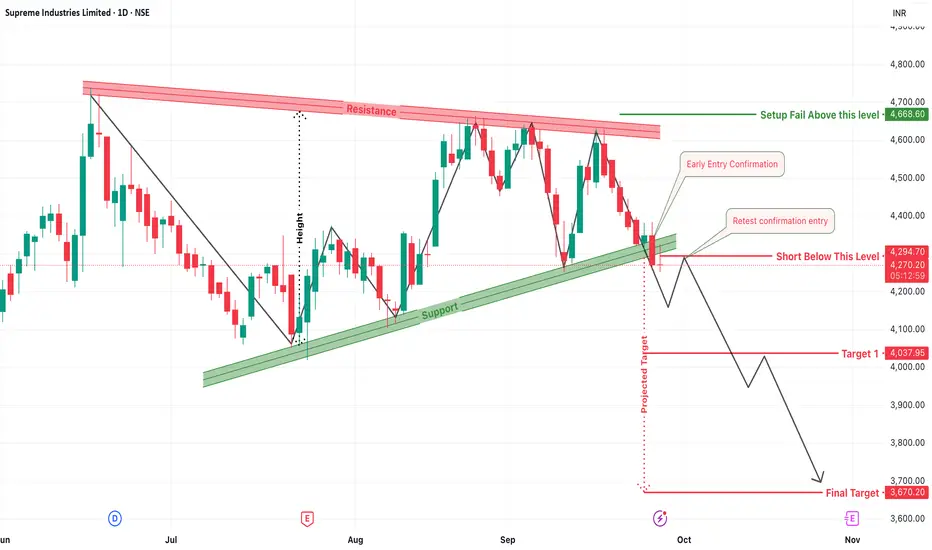
Supreme industries Short opportunity !!!Supreme industries is looking good for a down move with very nice risk reward ratio...
Nothing much to explain.
Target and SL levels given in the chart
Just sharing my view...not a tip nor advice!!!
Thank you!!!

SupremeKeep an eye on Supreme CMP 4612; it looks good above 4680 and sustained, then we can see 5000/5200++
Potential Upside Stocks!
#Disclaimer: View shared it for educational purposes only.
Follow for more upcoming charts.

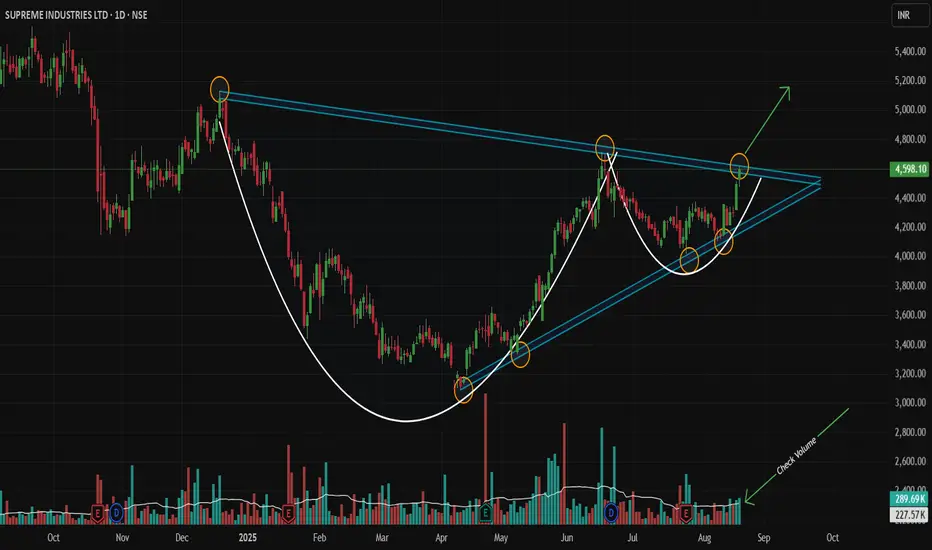
Supreme Ind (Daily) - Approaching Critical Res ConfluenceAfter a significant uptrend that concluded in June 2024, Supreme Industries entered a corrective downtrend lasting until April 2025. Since then, the stock has shown signs of a bullish reversal by establishing a pattern of higher lows , indicating that buyers are stepping in at progressively higher

SUPREMEINDSUPREMEIND
bullish trend is Showing on the chart.
buy signals in
50&200 ema golden croses over and
cup with handle chart pattern.
Watch for a breakout above 4700-4725 to sustain the bullish trend. If the resistance holds, there could be a retest towards 4300-4325 and an uptrend from here.

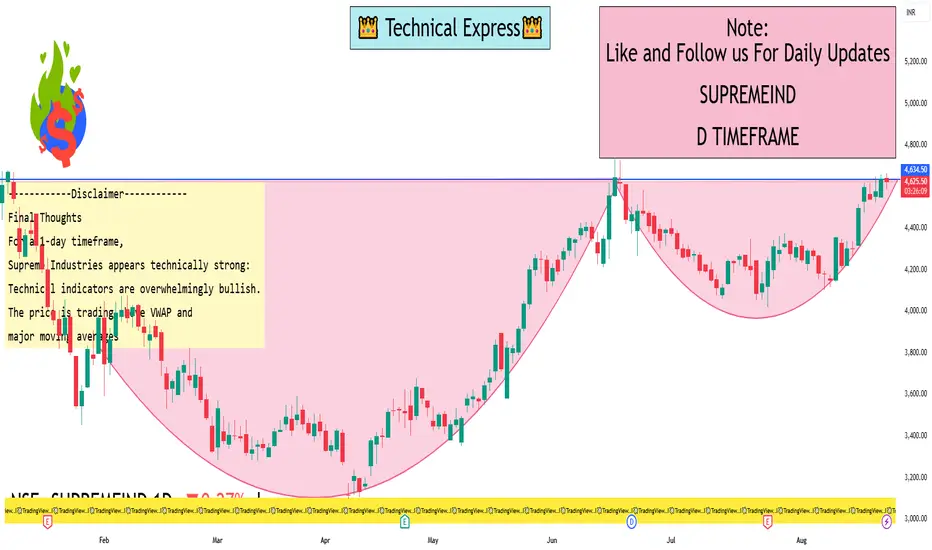
Supreme Industries 1 Day View1-Day Technical Overview
Consensus Ratings
TradingView signals a Buy rating for today, with a Strong Buy for the 1-week timeframe
Investing.com offers a robust Strong Buy across multiple timeframes (30 min, hourly, daily, weekly, and monthly)
Similarly, another Investing.com source reiterates: S
Breakout soon in Supreme Industries Supreme Industries – Cup & Handle Breakout Setup 🚀
Pattern: Cup & Handle formation nearing breakout
RSI: Above 65 and rising → momentum building
Trend: Price holding strong above EMA50
Volume: Steadily increasing
Enter after confirmation
Disc: For study, not a recommendation. DYOR

SUPREMEIND Price ActionSupreme Industries (SUPREMEIND) price analysis as of August 2025:
- **Current Price:** The stock closed at ₹4,637.80 on August 22, 2025.
- **Trend:** It has gained about 7.9% in the past week, 13.4% in the last month, and 26.4% over 6 months. However, there’s been a decline of about 16% over the la

Nested Bullish Patterns Signal Major Breakout!Script: NSE:SUPREMEIND | Timeframe: Daily | Analysis Type: Technical (Pure Price Action) | Patterns: Symmetrical Triangle + Cup & Handle
Idea Summary 💡
A powerful, nested pattern setup is concluding on the daily chart! A large Symmetrical Triangle contains a secondary Cup and Handle (Bullish) patte
Inv Head and Shoulder in Supreme industriesVery good reversal in supreme industries.
It can reach nr All time high.
This has also bounced nr weekly 200ma
Since it is spotted on weekly targets can come in 4~6 months time.

See all ideas
Summarizing what the indicators are suggesting.
Neutral
SellBuy
Strong sellStrong buy
Strong sellSellNeutralBuyStrong buy
Neutral
SellBuy
Strong sellStrong buy
Strong sellSellNeutralBuyStrong buy
Neutral
SellBuy
Strong sellStrong buy
Strong sellSellNeutralBuyStrong buy
An aggregate view of professional's ratings.
Neutral
SellBuy
Strong sellStrong buy
Strong sellSellNeutralBuyStrong buy
Neutral
SellBuy
Strong sellStrong buy
Strong sellSellNeutralBuyStrong buy
Neutral
SellBuy
Strong sellStrong buy
Strong sellSellNeutralBuyStrong buy
Displays a symbol's price movements over previous years to identify recurring trends.
Frequently Asked Questions
The current price of SUPREMEIND is 4,210.85 INR — it has decreased by −0.55% in the past 24 hours. Watch Supreme Industries Limited stock price performance more closely on the chart.
Depending on the exchange, the stock ticker may vary. For instance, on BSE exchange Supreme Industries Limited stocks are traded under the ticker SUPREMEIND.
SUPREMEIND stock has fallen by −4.31% compared to the previous week, the month change is a −6.22% fall, over the last year Supreme Industries Limited has showed a −20.43% decrease.
We've gathered analysts' opinions on Supreme Industries Limited future price: according to them, SUPREMEIND price has a max estimate of 5,400.00 INR and a min estimate of 3,265.00 INR. Watch SUPREMEIND chart and read a more detailed Supreme Industries Limited stock forecast: see what analysts think of Supreme Industries Limited and suggest that you do with its stocks.
SUPREMEIND reached its all-time high on Jun 12, 2024 with the price of 6,482.40 INR, and its all-time low was 14.55 INR and was reached on May 17, 2004. View more price dynamics on SUPREMEIND chart.
See other stocks reaching their highest and lowest prices.
See other stocks reaching their highest and lowest prices.
SUPREMEIND stock is 1.28% volatile and has beta coefficient of 1.08. Track Supreme Industries Limited stock price on the chart and check out the list of the most volatile stocks — is Supreme Industries Limited there?
Today Supreme Industries Limited has the market capitalization of 537.86 B, it has increased by 3.63% over the last week.
Yes, you can track Supreme Industries Limited financials in yearly and quarterly reports right on TradingView.
Supreme Industries Limited is going to release the next earnings report on Nov 3, 2025. Keep track of upcoming events with our Earnings Calendar.
SUPREMEIND earnings for the last quarter are 15.90 INR per share, whereas the estimation was 19.18 INR resulting in a −17.08% surprise. The estimated earnings for the next quarter are 14.51 INR per share. See more details about Supreme Industries Limited earnings.
Supreme Industries Limited revenue for the last quarter amounts to 26.09 B INR, despite the estimated figure of 27.83 B INR. In the next quarter, revenue is expected to reach 24.61 B INR.
SUPREMEIND net income for the last quarter is 2.02 B INR, while the quarter before that showed 2.94 B INR of net income which accounts for −31.18% change. Track more Supreme Industries Limited financial stats to get the full picture.
Supreme Industries Limited dividend yield was 0.99% in 2024, and payout ratio reached 44.95%. The year before the numbers were 0.71% and 35.62% correspondingly. See high-dividend stocks and find more opportunities for your portfolio.
As of Sep 29, 2025, the company has 21.9 K employees. See our rating of the largest employees — is Supreme Industries Limited on this list?
EBITDA measures a company's operating performance, its growth signifies an improvement in the efficiency of a company. Supreme Industries Limited EBITDA is 13.63 B INR, and current EBITDA margin is 13.58%. See more stats in Supreme Industries Limited financial statements.
Like other stocks, SUPREMEIND shares are traded on stock exchanges, e.g. Nasdaq, Nyse, Euronext, and the easiest way to buy them is through an online stock broker. To do this, you need to open an account and follow a broker's procedures, then start trading. You can trade Supreme Industries Limited stock right from TradingView charts — choose your broker and connect to your account.
Investing in stocks requires a comprehensive research: you should carefully study all the available data, e.g. company's financials, related news, and its technical analysis. So Supreme Industries Limited technincal analysis shows the sell today, and its 1 week rating is sell. Since market conditions are prone to changes, it's worth looking a bit further into the future — according to the 1 month rating Supreme Industries Limited stock shows the neutral signal. See more of Supreme Industries Limited technicals for a more comprehensive analysis.
If you're still not sure, try looking for inspiration in our curated watchlists.
If you're still not sure, try looking for inspiration in our curated watchlists.