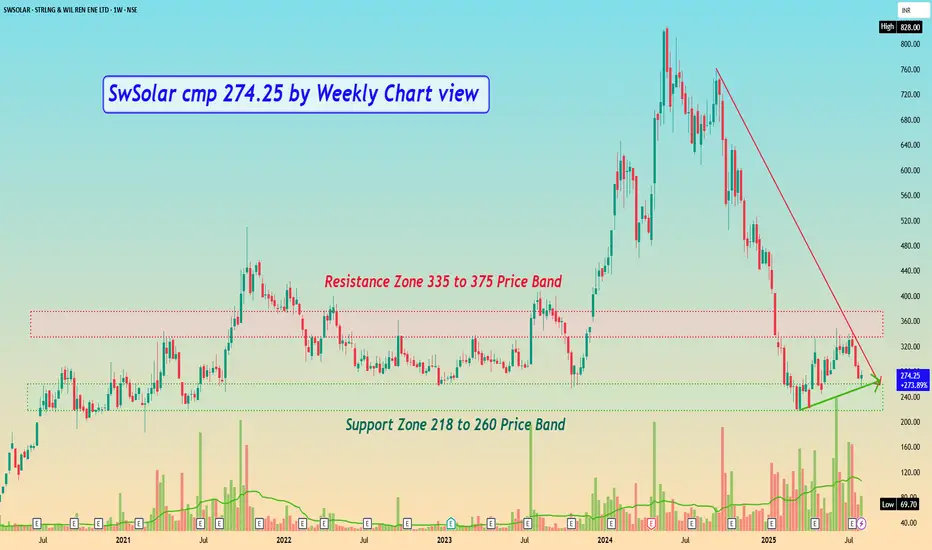
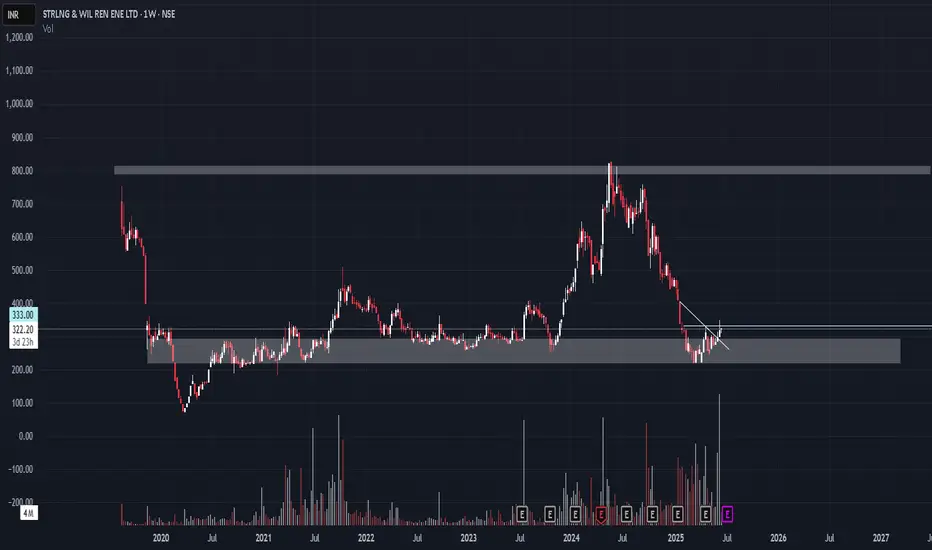
SwSolar cmp 274.25 by Weekly Chart viewSwSolar cmp 274.25 by Weekly Chart view
- Support Zone 218 to 260 Price Band
- Resistance Zone 335 to 375 Price Band
- Stock Price currently around Old Times Strong Support Zone
- Price reversal probability by past chart data seen basis Support Zone is sustained
- Price will need good incremental Volumes to breakout from fairly strong Resistance Zone
Trade ideas
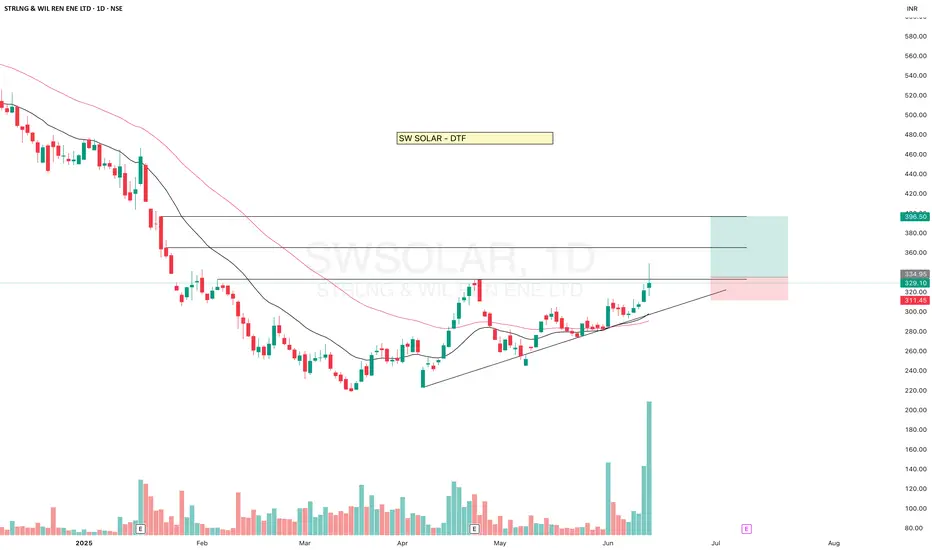
SW SOLARSW SOLAR gave BO but came down, heavy volume, if sustain this level then it may give a good upside move.
Moving above 20-50ema.
✅ If you like my analysis, please follow me as a token of appreciation :)
in.tradingview.com/u/SatpalS/
📌 For learning and educational purposes only, not a recommendation. Please consult your financial advisor before investing.
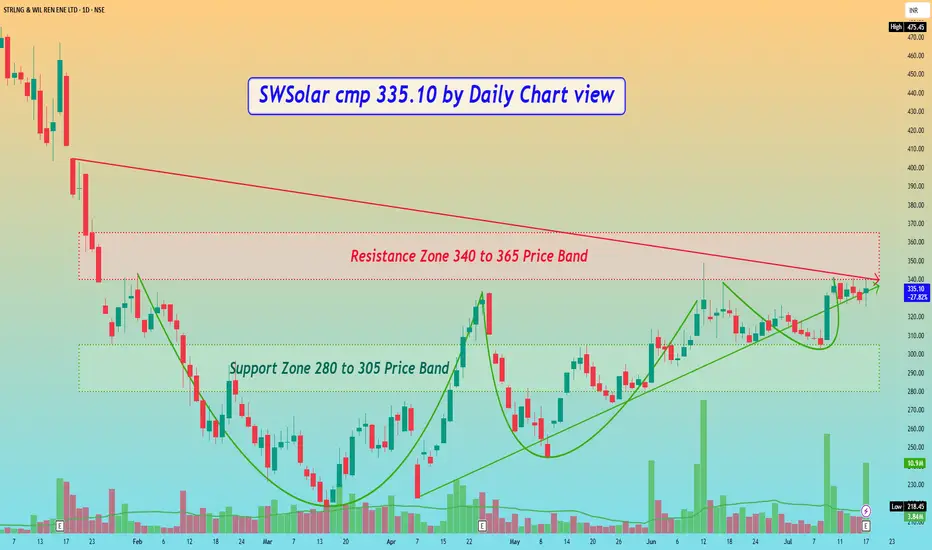
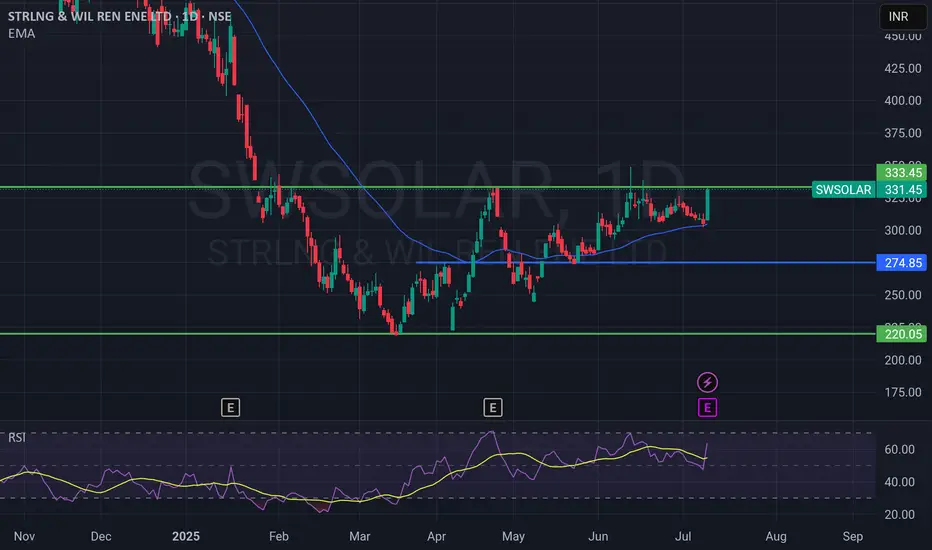
SWSolar Sterling & Wilson cmp 335.10 by Daily Chart viewSWSolar cmp 335.10 by Daily Chart view
- Support Zone 280 to 305 Price Band
- Resistance Zone 340 to 365 Price Band
- Bullish VCP Pattern completed on stock chart
- Volumes spiking heavily at regular intervals by demand based buying
- Resistance Zone Neckline Breakout maybe seen unfolding in the near future
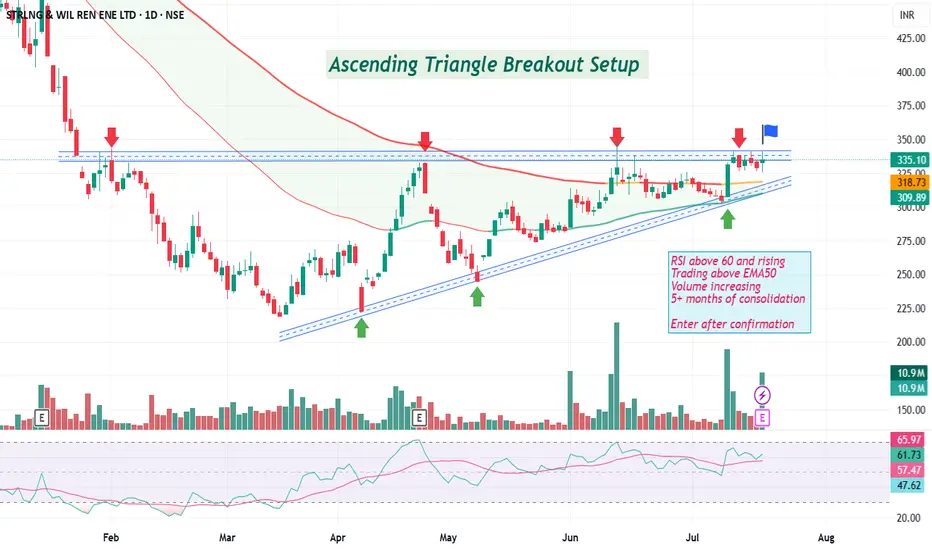
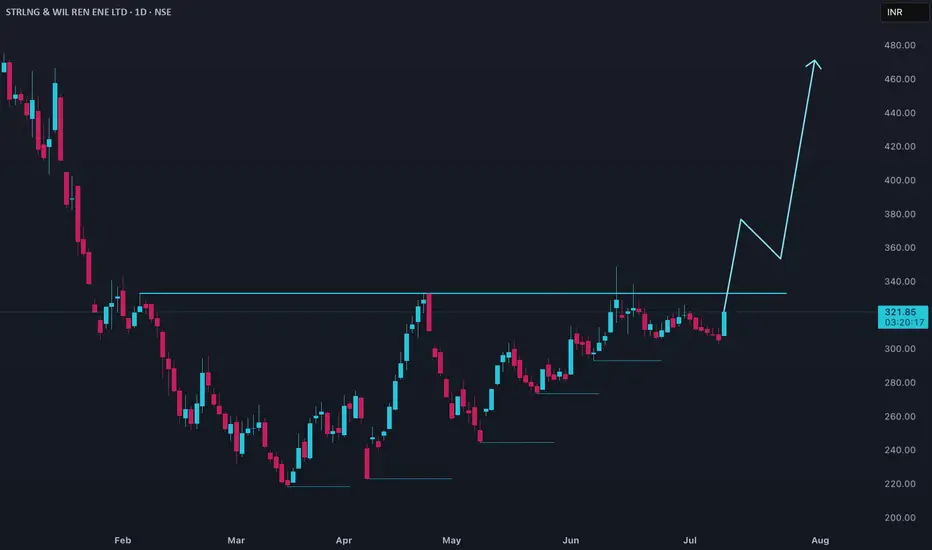
Breakout Soon in SWSOLARAscending Triangle Breakout Setup
RSI above 60 and rising
Trading above EMA50
Volume increasing
5+ months of consolidation
Enter after confirmation
Disc: not a recommendation, DYOR
SWSOLAR Breaks Out of Key ResistanceSWSOLAR has given a strong breakout above ₹330 resistance zone with volume support and 8.5% upmove!
Here’s what’s notable:
📈 Breakout above ₹333.45 – a major resistance level.
📊 EMA Support – Price trading above the 50 EMA (~₹304).
💪 RSI at 63.77 – Showing strong bullish momentum but not overbought yet.
🔄 Previous consolidation range was between ₹275 – ₹330.
What to watch next:
Immediate resistance near ₹345–₹360 (if momentum continues).
Support now at breakout zone ~₹330 and strong base at ₹274.
RSI nearing 70 – could see some consolidation before next leg.
📍Possible trade idea:
Long on retest of ₹330 zone with SL below ₹304 EMA.
Target ₹360+ short-term, ₹400 medium-term if strength continues.
📝 What do you think? Is this the start of a fresh uptrend or a fake breakout?
---
🏷️ Tags:
#SWSOLAR #BreakoutStocks #NSEIndia #TechnicalAnalysis #SwingTrading #EMA50 #RSI #CleanEnergyStocks
BUY TODAY SELL TOMORROW for 5%DON’T HAVE TIME TO MANAGE YOUR TRADES?
- Take BTST trades at 3:25 pm every day
- Try to exit by taking 4-7% profit of each trade
- SL can also be maintained as closing below the low of the breakout candle
Now, why do I prefer BTST over swing trades? The primary reason is that I have observed that 90% of the stocks give most of the movement in just 1-2 days and the rest of the time they either consolidate or fall
Cup and Handle Breakout in SWSOLAR
BUY TODAY SELL TOMORROW for 5%

SWSOLAR Price action### SWSOLAR Price Analysis
#### Current Price and Performance
- Sterling and Wilson Renewable Energy (SWSOLAR) is trading near ₹305 as of early July 2025.
- The stock has seen significant volatility over the past year, with a 52-week high near ₹400 and a low around ₹230.
- Over the last month, the stock delivered a modest gain of about 1.5%, while in the last three months, it rebounded strongly with a return of nearly 25%.
- Despite recent gains, the one-year return is sharply negative, down over 50%, reflecting a challenging period for the company.
#### Trend and Technical Overview
- The medium-term trend shows a recovery from earlier lows, supported by improved financial results and order inflows.
- Short-term price action indicates consolidation, with the stock trading in a narrow range after a recent rally.
- Technical indicators suggest resistance around ₹320–₹330, with support near ₹290.
#### Valuation and Financial Metrics
- SWSOLAR trades at a high price-to-earnings (P/E) ratio above 80, indicating premium valuation despite recent earnings improvement.
- The price-to-book (P/B) ratio is above 7, which is elevated compared to sector norms.
- The company recently returned to profitability, reporting a net profit margin of about 1.3% and positive earnings per share after several loss-making quarters.
- Revenue growth has been robust, with the latest quarter showing a year-on-year increase of over 110%.
- Operating cash flow turned positive in the latest fiscal year, a significant improvement from previous negative figures.
#### Market Sentiment and Outlook
- Analyst sentiment is cautiously optimistic, with most recommendations skewed toward buying, and an average target price suggesting potential upside of over 35% from current levels.
- The company’s strong order book and improving execution are seen as key positives.
- However, high valuation multiples and recent volatility warrant caution for new investors.
- The long-term outlook depends on continued execution of large-scale projects and maintaining profitability.
#### Summary
SWSOLAR has staged a notable turnaround in recent quarters, moving from losses to profitability and delivering strong revenue growth. The stock has rebounded from its lows but remains volatile and highly valued relative to peers. Investors should monitor execution risks and broader market sentiment, as further upside may depend on sustained financial performance and sector stability.
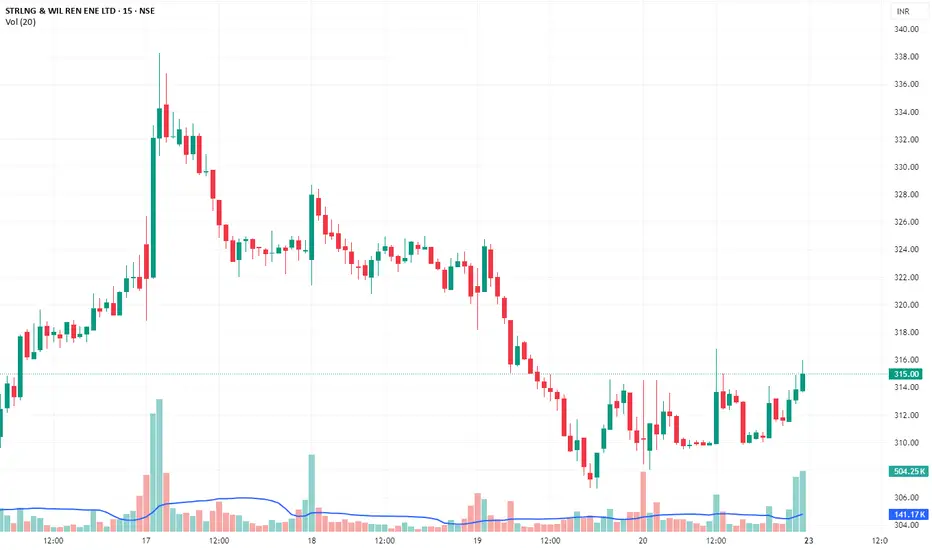
SWSOLAR – Tight Range Breakout with Volume SWSOLAR – Tight Range Breakout with Volume | BTST & 3–Day Swing Trade
CMP: ₹314.55
Trade Type: BTST / Short-Term Positional (2–4 Days)
Confidence Level: ⭐⭐⭐⭐½ (90%)
🧠 Technical Setup & Reasoning:
✅ Tight Consolidation Breakout: Price has broken out of a narrow sideways range between ₹307–311, closing strongly above resistance.
✅ High Volume Candle: Volume surged along with price expansion — suggests genuine breakout supported by buyer interest.
✅ VWAP & EMA Alignment: Price is above both VWAP and short-term EMAs, indicating trend alignment and strength.
✅ MACD: Bullish crossover confirmed on the 1-hour chart, with histogram expanding — signals momentum build-up.
✅ RSI: Trending above 60 and rising steadily — confirming strength with room to run before overbought.
✅ Sector Sentiment: Renewable energy sector is seeing capital rotation and fresh inflows — adds a macro tailwind to the setup.
📊 Trade Levels
🎯 Target 1: ₹322
🎯 Target 2: ₹329
🚀 Stretch Target: ₹338+
🛑 Stop-Loss: ₹307 (closing basis)
📌 Why This Trade Has High Conviction
First strong breakout after a long consolidation phase
Clear signs of institutional volume push
Bullish indicator alignment: MACD + RSI + Price > VWAP
Green energy theme adds to short-term momentum potential
📌 Strategy:
Buy above ₹314–315, or on small dips with SL at ₹307
Trail SL to ₹311 once ₹322 is crossed
Book partial near ₹329, ride balance for ₹338+
💬 SWSOLAR is emerging from a tight coil — ideal for a 2–4 day momentum play. Keep it on radar for clean continuation.
🧠 #SWSOLAR #BreakoutTrade #BTST #SwingTrade #CleanEnergy #VolumeBreakout #PriceAction
swsolar at the verge of breakout!!!???most people will see this post after the big movement is already done!
give me a follow if u r seeing this post after the movement!
Increasing EPS
Company is expected to give good quarter
Debtor days have improved from 105 to 72.6 days.
Company's working capital requirements have reduced from 145 days to 47.2 days
SWSOLAR in bullish modeRSI is overbought (about 83).The broad picture (daily & intraday) is bullish, but overbought conditions signal a possible short-term pause or minor pullback before further upside .
Bull trend intact - Above all SMAs and EMAs confirms buying momentum.
High RSI/Stoch - Price may consolidate or retrace before continuing.
Strong ADX/MACD/MFI - Confirms trend strength, though possibly overextended.
Support levels to monitor - ₹297–₹291 zone is key for stability.
Volume & news - Keep an eye on fresh order wins or catalysts

SW Solar - Turn around story ?SW Solar - Rounded Bottom normally signifies a turn around and this chart also is giving a rounded bottom. Looks like it completed a 3 wave ABC correction and is breaking out creating new higher highs. So hope to see a very good impulse move... And good returns on this one counter
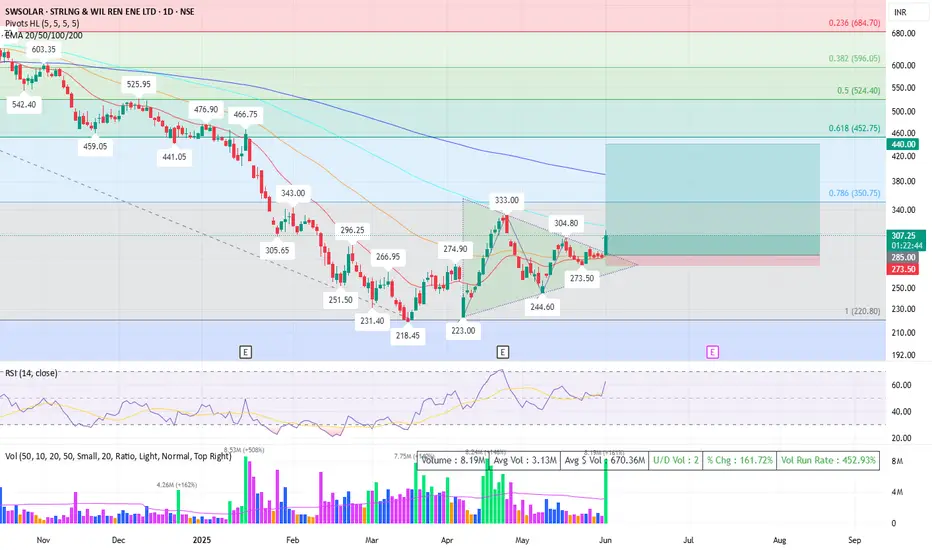
$NSE:SWSOLAR : Triangle Breakout with Volume ConfirmationNSE:SWSOLAR
🧠 CHART OVERVIEW
Exchange: NSE
Current Price: ₹304
Volume: 7.4M (above avg: 3.11M)
Indicators Used in this analyis: EMA (20/50/100/200), RSI (14-day), Volume, Fibonacci Retracement, Support/Resistance, Pivot HL, Symmetrical Triangle Breakout
---
🔍 TECHNICAL ANALYSIS
1️⃣ Breakout & Trend Structure
- Symmetrical triangle breakout confirmed with high volume
- Strong buying interest (7.4M vs 3.1M avg volume)
2️⃣ Support & Resistance Levels
- Support: ₹273.50, ₹244.60
- Resistance: ₹333.00, ₹350.75, ₹390.00–452.75
3️⃣ Fibonacci Retracement Insights
- Reversed from ₹220 (1.0 retracement), now approaching ₹350.75 (0.786 Fib)
- Key targets: ₹452.75 (0.618 Fib), ₹524.40 (0.5 Fib)
4️⃣ Moving Averages
- Price above EMA 20/50/100 but below 200 EMA (₹390.44)
- Short-term momentum bullish, long-term trend yet to confirm
5️⃣ RSI & Momentum
- RSI: 64.05 – Bullish but near overbought
- Momentum picking up, supporting breakout
6️⃣ Volume & Price Action
- 137% above avg volume suggests institutional interest
- Bullish marubozu candle with no upper wick
---
🎯 PRICE TARGETS (Next 3 Months)
- ₹333.00: Short-term resistance
- ₹350.75: 78.6% Fib retracement
- ₹390.00: 200 EMA & major resistance
- ₹452.75: 61.8% Fib breakout zone
---
🛑 STOP LOSS & SCENARIOS
- SL: ₹244.60 (conservative), ₹273.50 (moderate)
- Bullish: Above ₹312 → Buy dips, trail SL
- Neutral: ₹273–333 range → Observe
- Bearish: Below ₹273 → Exit, re-enter near ₹244
---
📢 DISCLAIMER
This analysis is for **educational purposes** only. Not investment advice. Markets are volatile; consult a financial expert before making decisions.
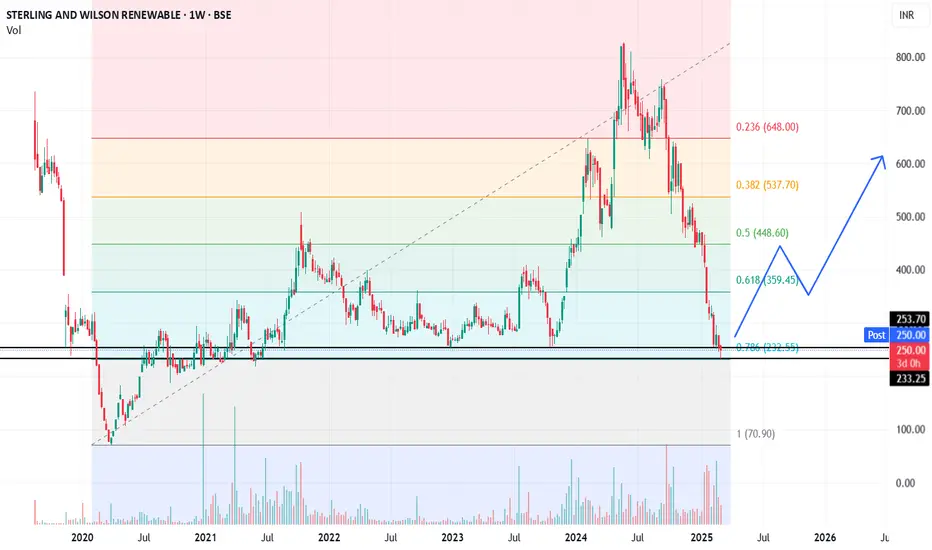
The worst seems to be over for SWSOLAR ! CMP 250Technical Analysis:
Currently taking support at .78 fib we can expect a bounce from here or may consolidate for a while before making any further move.
Expecting this to be a multibagger, looking at the order book and backing of RIL group
In the Q4 FY2024 earnings call, the company reported total order inflows of approximately ₹6,023 crores, marking a 37% increase compared to the previous fiscal year. Notably, Sterling and Wilson secured international orders from Spain and Italy after a three-year hiatus, aligning with their strategy to mitigate risks associated with module price fluctuations.
These developments indicate a robust order pipeline and strategic international expansion, potentially enhancing the company's revenue streams and market position in the renewable energy sector.
Sterling and Wilson Solar Ltd. (SW Solar) ### **Sterling and Wilson Solar Ltd. (SW Solar) Stock Analysis**
---
#### **Fundamental Analysis:**
- **Company Overview:**
Sterling and Wilson Solar Ltd. (SW Solar) is a leading global solar EPC (Engineering, Procurement, and Construction) company, with a strong track record of executing large-scale solar projects. The company offers end-to-end solutions for solar power generation, from project design to construction and maintenance. SW Solar has a significant presence in both the Indian and international markets, with projects spanning multiple countries.
- **Revenue & Profit Growth:**
- **Revenue Trends:** SW Solar’s revenue has fluctuated in the past few years, impacted by project execution timelines and the cyclical nature of the solar industry. However, it has seen a steady increase in revenue over the past few quarters, driven by the growing demand for renewable energy solutions.
- **Profitability:** The company reported a decline in profits for FY2024, mainly due to rising raw material costs and some delays in project execution. However, the outlook for 2025 is positive as the company has secured a strong order book, and government incentives for solar projects are expected to boost growth.
- **Valuation (as of Feb 2025):**
- **P/E Ratio:** 17.4 (this valuation is relatively attractive when compared to industry peers, indicating reasonable growth expectations)
- **Price-to-Book Ratio:** 1.3 (suggesting that the company is trading at a fair price relative to its book value)
- **Dividend Yield:** 0.6% (modest dividend, typical for a company reinvesting profits into growth and expansion)
- **Key Ratios:**
- **Return on Equity (ROE):** 10.5% (moderate, indicating potential for improvement with increased scale)
- **Return on Assets (ROA):** 5.2% (reflecting good use of assets but still leaving room for improvement)
- **Debt-to-Equity Ratio:** 1.2 (higher than the industry average, indicating a reliance on debt to finance projects, which could pose risks in case of project delays or cash flow challenges)
- **Outlook:**
SW Solar is positioned well in the solar EPC industry, benefiting from global renewable energy trends. With governments worldwide pushing for cleaner energy and the cost of solar technology decreasing, the company’s long-term growth prospects are promising. However, the company is exposed to project execution risks, fluctuations in raw material costs, and currency risks in its international operations.
---
#### **Technical Analysis:**
- **Current Price:** ₹365 (as of February 2025)
- **Chart Overview:**
SW Solar has been in a consolidation phase over the past few months, trading within a defined range. The stock has recently tested its resistance around ₹380 but has struggled to break above it. A successful breakout above this level could open up further upside potential.
- **Support and Resistance Levels:**
- **Immediate Support:** ₹350 (the stock has found support at this level on multiple occasions)
- **Next Major Support:** ₹330 (a critical level that could hold if there is a broader market correction)
- **Immediate Resistance:** ₹380 (the stock has faced resistance here recently, and a breakout could signal further bullish momentum)
- **Next Major Resistance:** ₹400 (the next psychological level, which could provide significant resistance)
- **Moving Averages:**
- **50-Day Moving Average (50-DMA):** ₹360 (indicating a neutral to slightly bullish trend in the short term)
- **200-Day Moving Average (200-DMA):** ₹330 (providing a solid support zone in case of a downtrend)
- **Relative Strength Index (RSI):**
- RSI stands at 62, indicating that the stock is approaching overbought territory, but there is still room for potential upside. A pullback or consolidation near the resistance level could be expected before further upward movement.
- **MACD:**
- The MACD is showing a bullish crossover, suggesting that the stock could maintain its positive momentum, but it might face resistance near the ₹380–₹400 range.
---
#### **Key Metrics:**
- **Market Capitalization:** ₹8,500 crore (approx.)
- **52-Week High:** ₹395
- **52-Week Low:** ₹270
---
#### **Risk Considerations:**
- **Execution Risks:** SW Solar’s business is project-based, and delays or cost overruns in project execution could negatively impact its profitability and cash flow.
- **Commodity Price Risks:** The company is exposed to fluctuations in the prices of raw materials (e.g., steel, aluminum), which could affect margins and project timelines.
- **Foreign Exchange Risk:** Since SW Solar operates globally, currency fluctuations could impact the profitability of its international projects.
- **Debt Risks:** The high debt-to-equity ratio suggests the company has significant debt. In the case of slower project execution or delays in payment collection, this could strain the company's financials.
---
### **Conclusion:**
Sterling and Wilson Solar Ltd. (SW Solar) is a prominent player in the solar EPC industry with a growing international presence. The stock is currently trading at a reasonable valuation with attractive growth prospects, especially in light of the increasing demand for solar energy. Technically, the stock is in a consolidation phase, with key support at ₹350 and resistance at ₹380. A breakout above ₹380 could trigger further upside, but caution is advised due to potential short-term volatility.
The company is poised for growth in the renewable energy space, but its performance will depend on successful project execution, cost management, and macroeconomic factors. For long-term investors, the company could provide a solid opportunity, though short-term risks related to debt and raw material price fluctuations should be considered.
---
**Disclaimer:** This analysis is based on publicly available information, and I am not a SEBI-registered advisor. Please conduct your own research and consult a certified financial advisor before making any investment decisions. This is for informational purposes only and should not be considered as financial advice.

SW Solar, Trendline Breakout. Risky Proposition!!🔍Stock Analysis: SWSOLAR (Sterling and Wilson Renewable)
Entry & Stop Loss (SL):
🟢Entry: ₹478.00
🔴Stop Loss (SL): ₹402.10 (on a closing basis)
📊Targets:
T1: ₹530.90
T2: ₹608.05
T3: ₹639.00
Positional Long-Term Target: ₹761.80 - ₹790.00
All-Time High (ATH): ₹830.20
Setup Overview:
Trend: Downtrend. Now showing signs of a trendline breakout.
Moving Average Position: Trading below the 50 and 200 DMA
Volume: Huge volume spike today, signalling possible accumulation
Earnings: Posted good results today
Risk Considerations:
Risk Level: High
Counter-trend trade with the stock still in a downtrend.
Below 50 DMA and 200 DMA, indicating overall bearish sentiment.
Reasons for Risk Level:
The stock is currently against the primary trend (downtrend).
Significant resistance levels need to be broken for sustained upward movement.
Notes:
While today's huge volume and positive results are encouraging, remember this is a risky bet as we are trading against the trend.
Entry requires patience and discipline, and SL must be strictly adhered to on a closing basis.
🛑Disclaimer:
This analysis is for educational purposes only. Trading involves risks, and you should consult your financial advisor before making any trades.

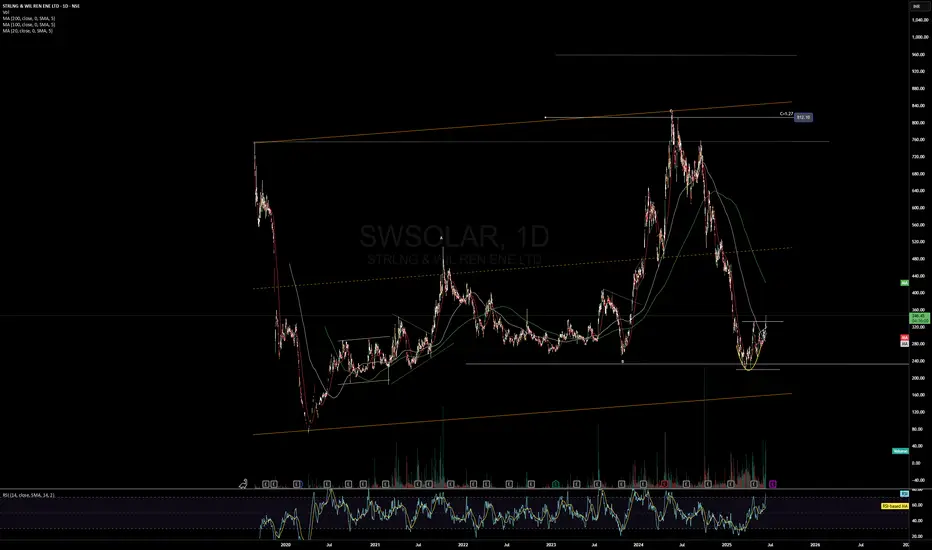
SWSolar cmp 467.60 by Weekly Chart viewSWSolar cmp 467.60 by Weekly Chart view
- Price Band 414 to 441 Support Zone
- Price respecting Rising Support Trendline
- 2+ year's long timeframe Bullish Rounding Bottom
- Volumes seem steady but yet below avg traded quantity
- Weekly Support at 377 > 285 > 190 with Resistance at 541 > 638 > 732
- Stock Price seems testing retesting the Support Zone currently for probable upside movement

Strong bearish trend:Sterling and Wilson Renewable Energy LtdSterling and Wilson Renewable Energy Ltd has been in a strong downtrend for a long time.
It is consolidating near the strong support zone of 482 levels
20 EMA (Black line) is trading below 50 EMA (Orange line) which in turn trading below 100 EMA (Blue line) confirming the bearish trend.
Recently it has bagged a solar project order of Rs. 504 Cr from a private firm in Rajasthan.
The 482 levels has been firmly held for more than 10 sessions.
Technically, the downside risk is limited.
RSI is also showing some strength
The next resistance levels are 535, 616, 66, 795

Buy the Multibagger Company has a big orderbook worth rs.8084cr for Q1 FY25
> Company is trading below the IPO price
> Easy short term target of 720 rupees
> Global present with management and operations


Sterling and Wilson Renewable Energy near supportSterling and Wilson Renewable Energy at near good support at 600 with good volume

Sterling and Wilson Renewable Energy Date 14.09.2024
Sterling and Wilson Renewable Energy
Timeframe : Weekly
Sector : Engineering - Construction
Inventory turnover ratio :
Inventory Turnover ratio is an activity ratio and is a tool to evaluate the liquidity of a company's inventory. It measures how many times a company has sold and replaced its inventory during a certain period of time. Sterling and Wilson has an Inventory turnover ratio of 1,997.17 which shows that the management is efficient in relation to its Inventory and working capital management.
Company Essentials
Market Cap ₹ 17,314.57 Cr. II Enterprise Value ₹ 17,505.92 Cr.
P/E 94.29 II P/B 6.29
Book Value (TTM) ₹ 117.87 II CASH ₹ 285.31 Cr.
DEBT ₹ 476.66 Cr II Promoter Holding 52.91 %
EPS (TTM) ₹ 7.87 II Sales Growth 85.62%
ROE 4.55 % II ROCE 10.48%
Profit Growth 124.58 %
Regards,
Ankur

SW Solar - BreakoutAfter a long consolidation SW Solar seems to be breaking out again..
Long above 760 (Todays high) with Stoploss below 700.
Potential triangle breakout here..
The stock has good tailwinds and a good sized Orderbook in place.

STRLNG & WIL REN ENE LTDSTRLNG & WIL REN ENE LTD
Sterling & Wilson Renewable Energy Ltd. provides solutions for solar engineering, procurement, and construction (EPC).
.
CMP 726
.
Chart Looks Good.
IPO Breakout.
BB Blast in daily TF.
Supertrend positive.
Consolidation since 21 May 2024
SL 9 September low CB.
Deep SL 660
.
TG of 830.
.
This is Kartik Thakur,
Signing off
:)
