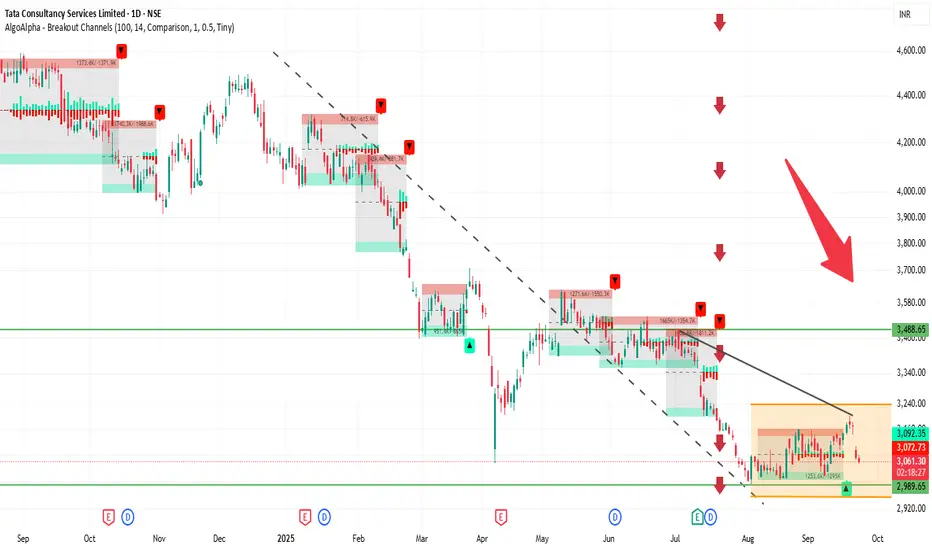
TCS 1D Time frame📍 Current Price & Range
Current price: ₹3,063.80
Day’s High / Low: ₹3,106.90 / ₹3,052.00
52-week High / Low: ₹4,494.90 / ₹2,991.60
🔍 Key Levels
Immediate resistance: ₹3,100–₹3,110
Next resistance: ₹3,200–₹3,250
Immediate support: ₹3,050–₹3,060
Psychological / strong support: ₹3,000
📊 Indica
Next report date
—
Report period
—
EPS estimate
—
Revenue estimate
—
136.20 INR
485.53 B INR
2.55 T INR
1.02 B
About Tata Consultancy Services Limited
Sector
Industry
CEO
Kunchitham Krithivasan
Website
Headquarters
Mumbai
Founded
1968
ISIN
INE467B01029
FIGI
BBG000Q0WF56
Tata Consultancy Services Limited (TCS) is engaged in providing information technology (IT) services, digital and business solutions. The Company's segments include banking, finance and insurance services (BFSI); manufacturing; retail and consumer packaged goods (CPG); telecom, media and entertainment, and others, such as energy, resources and utilities, hi-tech, life science and healthcare, s-Governance, travel, transportation and hospitality, and other products. Its services portfolio consists of IT and assurance services, business intelligence and performance management, business process services, cloud services, connected marketing solutions, consulting, engineering and industrial services, enterprise solutions, IT infrastructure services, mobility products and services and platform solutions. Its software offerings include Digital Software and Solutions, TCS BaNCS and TCS MasterCraft, among others. It serves industries, including insurance, healthcare, retail, telecom and others.
Related stocks
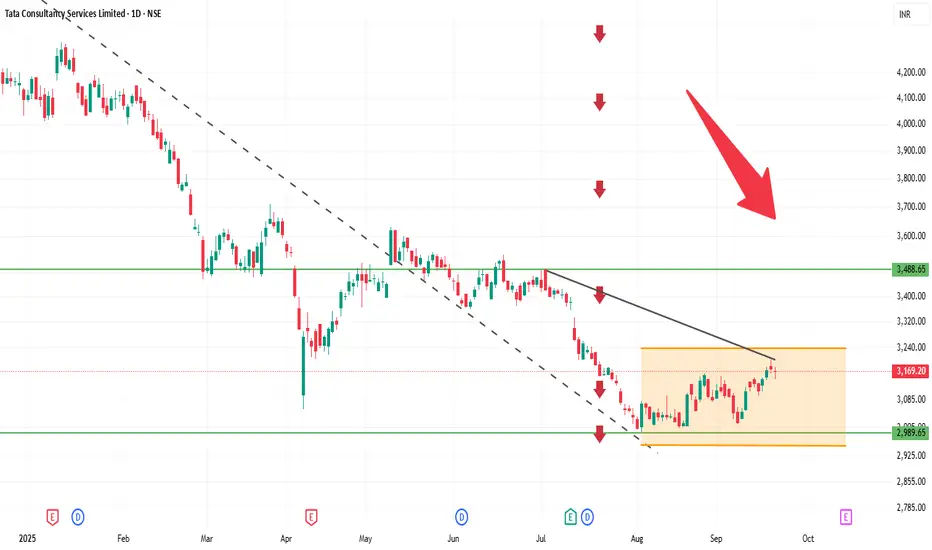
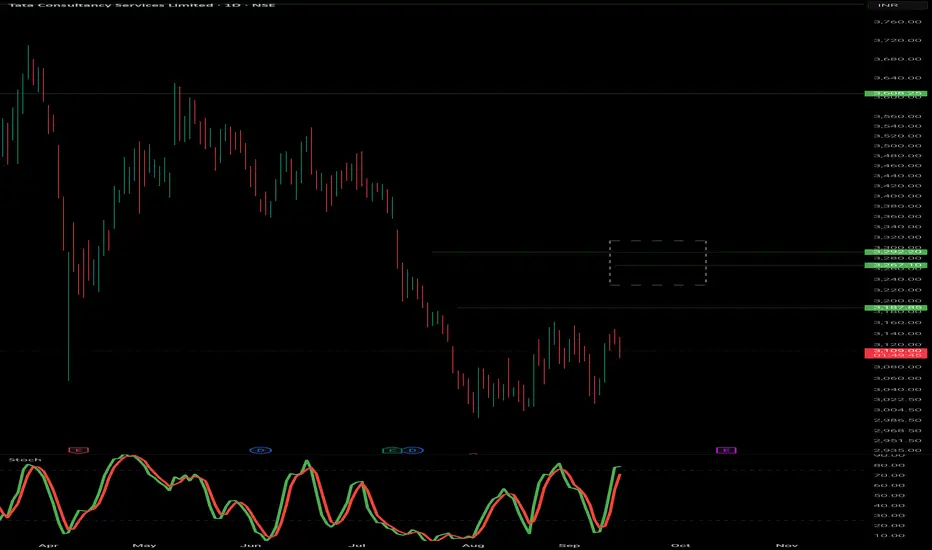
TCS 1D Time frameCurrent Price: Around 3,174
Current Trend: Stock is in a sideways to slightly bullish phase after consolidation.
Support Zone: Strong support at 3,140 – 3,150. Buyers may defend this level.
Resistance Zone: Key resistance at 3,200 – 3,220. A breakout above 3,220 can trigger fresh upside.
Indicato
TCS 1D Time frame🔍 Current Price & Context
Trading around ₹3,089
Day’s range: ₹3,065 – ₹3,107
Previous close: ₹3,171
Market sentiment: Bearish, influenced by external factors affecting IT stocks.
📊 Technical Indicators
Moving Averages: Short-term averages are slightly above current price, acting as resistance.
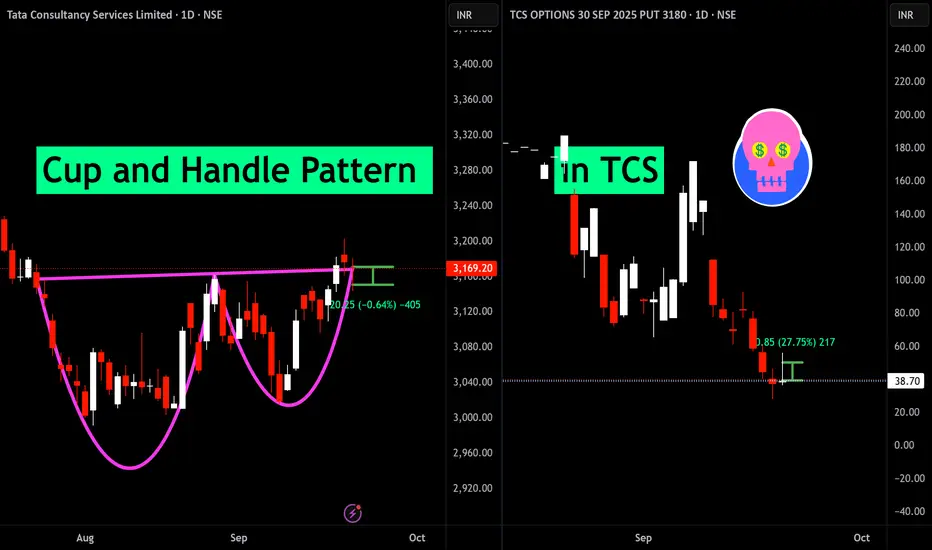
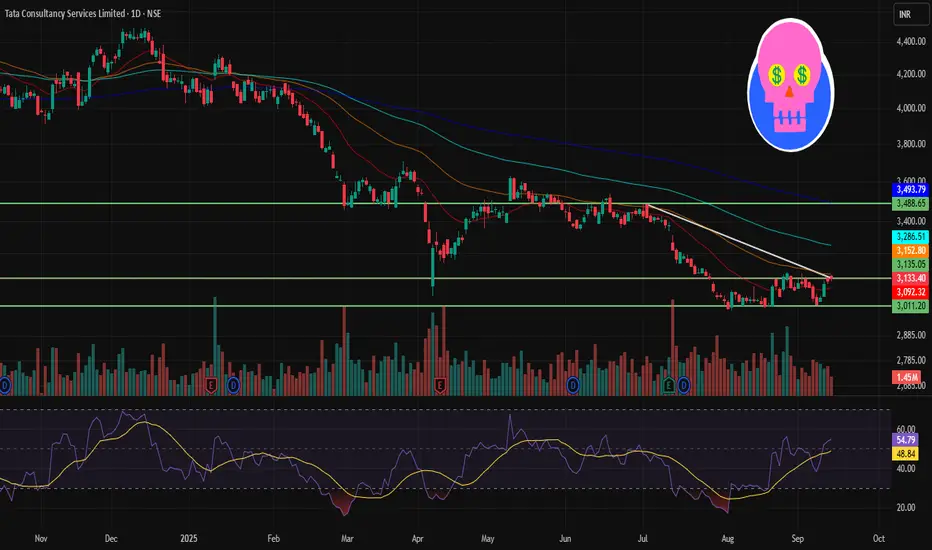
Cup and Handle Pattern failed in TCSThe cup and handle pattern has formed, but the anticipated breakout has not materialized. This failed breakout may indicate the potential for further downside movement in the stock
TCS 1D Time frame📉 Current Market Snapshot
Closing Price: ₹3,133.40
Day's Range: ₹3,121.00 – ₹3,148.70
52-Week High: ₹4,547.00
52-Week Low: ₹2,991.60
Market Cap: ₹11,21,000 crore
P/E Ratio (TTM): 22.8
Dividend Yield: 1.93%
Book Value: ₹262
ROE: 52.4%
Debt-to-Equity Ratio: 0.10
EPS (TTM): ₹136.19
Face Val
TCS on bullishBuy @ CMP -3108
Stoploss - 3030.75
Target - 3230.20
3267.10
3315.00
Follow me for update on the calls.
Maintain stoploss strictly
Happy Trading
Jai Hind
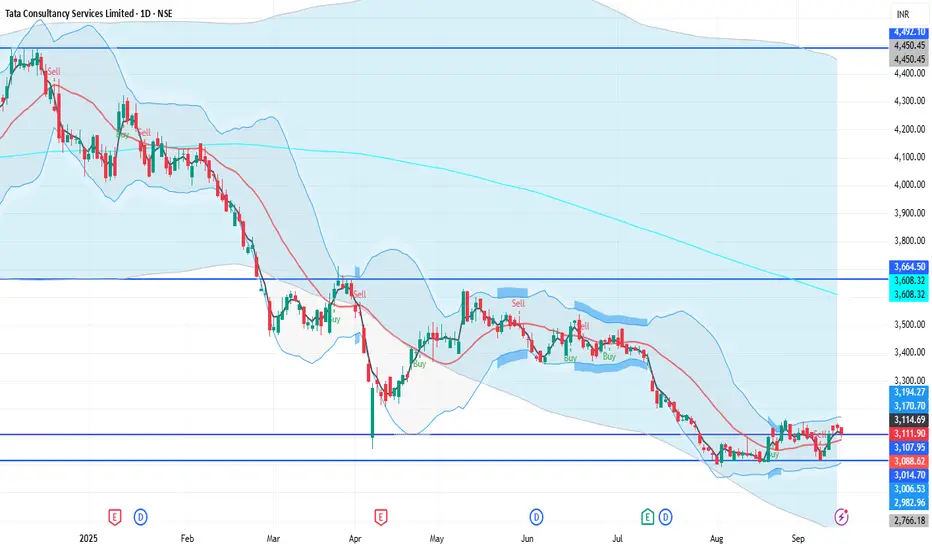
TCS 1D Time framePrice Action
Current Price: ₹3,111.60
Previous Close: ₹3,124.20
Day’s Range: ₹3,096 – ₹3,134
52-Week Range: ₹2,991.60 – ₹4,546.05
🔹 Support & Resistance
Support 1: ₹3,096
Support 2: ₹3,050 – ₹3,060
Resistance 1: ₹3,134
Resistance 2: ₹3,150 – ₹3,160
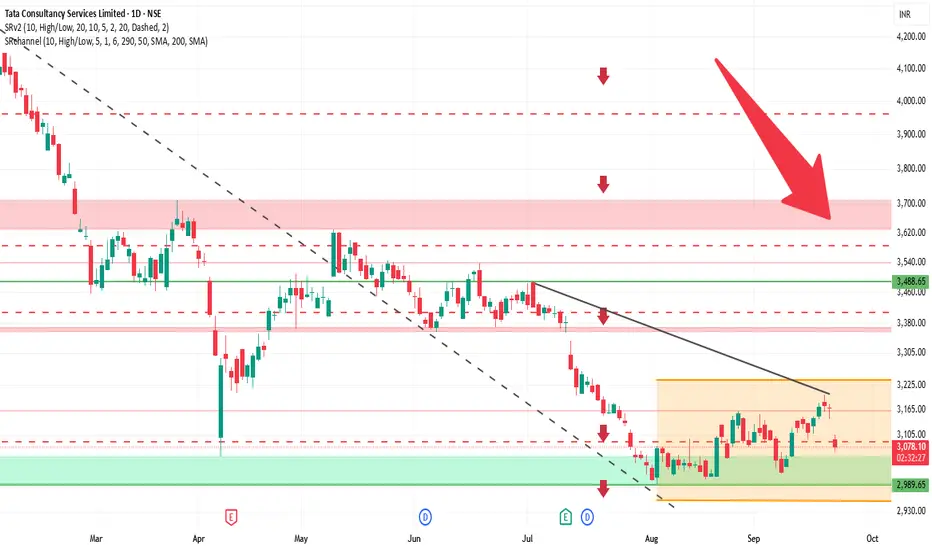
TCS 1D Time frame🔢 Current Level
~ ₹3,131
🔑 Key Resistance & Support Levels
Resistance Zones:
~ ₹3,160 – ₹3,180 (near-term resistance)
~ ₹3,200 – ₹3,220 (stronger resistance above)
Support Zones:
~ ₹3,120 – ₹3,100 (immediate support)
~ ₹3,050 – ₹3,000 (secondary support)
~ ₹2,900 (deeper support if weakness
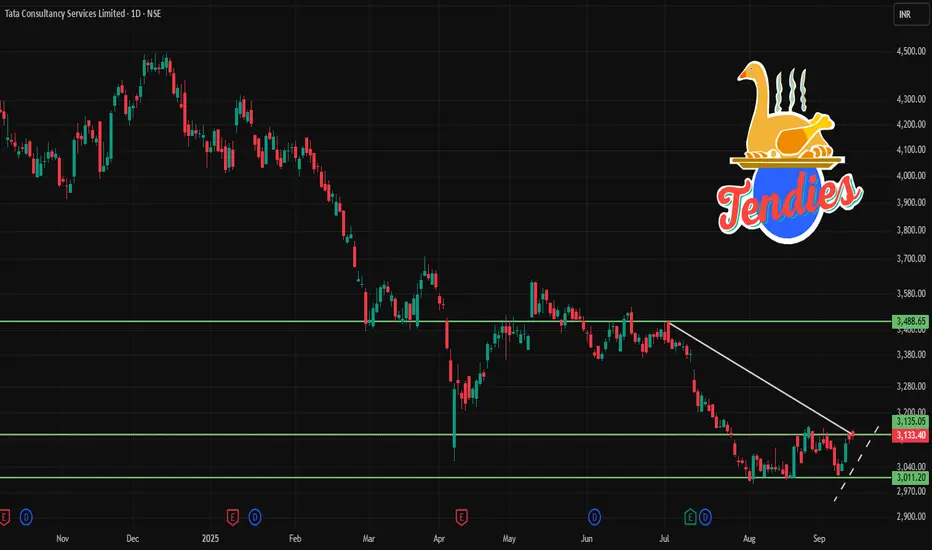
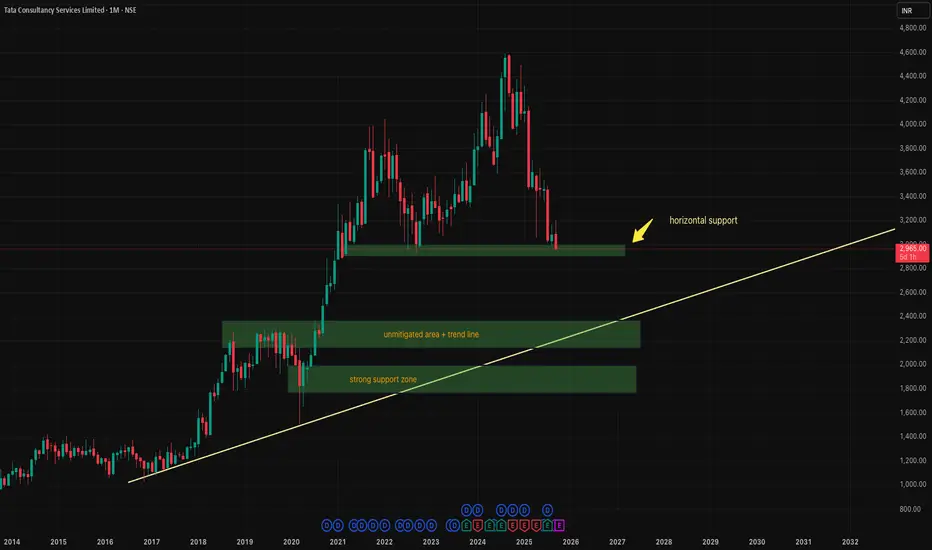
long trade on TCS for positional tradingas there is support on monthly tf we can expect price to rise from there
and if it does not happen there is a trend line and a combination of horizontal support
TCS at Confluence of Resistance / EMA / ST/ GAP/ AVWAP / FIB
Between 3500-3550, TCS could face strong resistance on multiple fronts and they are listed below.
Daily SuperTrend
GAP Zone
50 DEMA at 3540 (retesting it after a long time, expect a rejection)
Fib retracement of 61.8% of the recent swing
Avwap from the recent swing (at 3530)
100% (abc pullback) fr
See all ideas
Summarizing what the indicators are suggesting.
Neutral
SellBuy
Strong sellStrong buy
Strong sellSellNeutralBuyStrong buy
Neutral
SellBuy
Strong sellStrong buy
Strong sellSellNeutralBuyStrong buy
Neutral
SellBuy
Strong sellStrong buy
Strong sellSellNeutralBuyStrong buy
An aggregate view of professional's ratings.
Neutral
SellBuy
Strong sellStrong buy
Strong sellSellNeutralBuyStrong buy
Neutral
SellBuy
Strong sellStrong buy
Strong sellSellNeutralBuyStrong buy
Neutral
SellBuy
Strong sellStrong buy
Strong sellSellNeutralBuyStrong buy
Displays a symbol's price movements over previous years to identify recurring trends.
Curated watchlists where TCS is featured.

Indian stocks: Racing ahead
46 No. of Symbols
See all sparks
Frequently Asked Questions
The current price of TCS is 2,960.35 INR — it has decreased by −1.85% in the past 24 hours. Watch Tata Consultancy Services Limited stock price performance more closely on the chart.
Depending on the exchange, the stock ticker may vary. For instance, on BSE exchange Tata Consultancy Services Limited stocks are traded under the ticker TCS.
TCS stock has fallen by −6.49% compared to the previous week, the month change is a −4.79% fall, over the last year Tata Consultancy Services Limited has showed a −30.47% decrease.
We've gathered analysts' opinions on Tata Consultancy Services Limited future price: according to them, TCS price has a max estimate of 4,500.00 INR and a min estimate of 1,939.41 INR. Watch TCS chart and read a more detailed Tata Consultancy Services Limited stock forecast: see what analysts think of Tata Consultancy Services Limited and suggest that you do with its stocks.
TCS stock is 2.89% volatile and has beta coefficient of 0.84. Track Tata Consultancy Services Limited stock price on the chart and check out the list of the most volatile stocks — is Tata Consultancy Services Limited there?
Today Tata Consultancy Services Limited has the market capitalization of 10.99 T, it has increased by 1.56% over the last week.
Yes, you can track Tata Consultancy Services Limited financials in yearly and quarterly reports right on TradingView.
Tata Consultancy Services Limited is going to release the next earnings report on Oct 9, 2025. Keep track of upcoming events with our Earnings Calendar.
TCS earnings for the last quarter are 35.27 INR per share, whereas the estimation was 33.97 INR resulting in a 3.83% surprise. The estimated earnings for the next quarter are 34.52 INR per share. See more details about Tata Consultancy Services Limited earnings.
Tata Consultancy Services Limited revenue for the last quarter amounts to 634.37 B INR, despite the estimated figure of 646.88 B INR. In the next quarter, revenue is expected to reach 652.40 B INR.
TCS net income for the last quarter is 127.60 B INR, while the quarter before that showed 122.24 B INR of net income which accounts for 4.38% change. Track more Tata Consultancy Services Limited financial stats to get the full picture.
Tata Consultancy Services Limited dividend yield was 1.66% in 2024, and payout ratio reached 44.71%. The year before the numbers were 1.42% and 43.69% correspondingly. See high-dividend stocks and find more opportunities for your portfolio.
As of Sep 25, 2025, the company has 607.98 K employees. See our rating of the largest employees — is Tata Consultancy Services Limited on this list?
EBITDA measures a company's operating performance, its growth signifies an improvement in the efficiency of a company. Tata Consultancy Services Limited EBITDA is 676.20 B INR, and current EBITDA margin is 26.49%. See more stats in Tata Consultancy Services Limited financial statements.
Like other stocks, TCS shares are traded on stock exchanges, e.g. Nasdaq, Nyse, Euronext, and the easiest way to buy them is through an online stock broker. To do this, you need to open an account and follow a broker's procedures, then start trading. You can trade Tata Consultancy Services Limited stock right from TradingView charts — choose your broker and connect to your account.
Investing in stocks requires a comprehensive research: you should carefully study all the available data, e.g. company's financials, related news, and its technical analysis. So Tata Consultancy Services Limited technincal analysis shows the strong sell today, and its 1 week rating is strong sell. Since market conditions are prone to changes, it's worth looking a bit further into the future — according to the 1 month rating Tata Consultancy Services Limited stock shows the sell signal. See more of Tata Consultancy Services Limited technicals for a more comprehensive analysis.
If you're still not sure, try looking for inspiration in our curated watchlists.
If you're still not sure, try looking for inspiration in our curated watchlists.