TCS 1 Month Time Frame 📉 Technical Overview (1-Month Timeframe)
Price Range: ₹2,867.55 – ₹3,202.95
Current Price: ₹2,962.
Trend: Bearish
According to TradingView, the 1-month technical analysis for TCS indicates a neutral outlook. However, moving averages suggest a strong sell signal. Oscillators are neutral, and pivot points are not specified.
🔍 Key Technical Indicators
Relative Strength Index (RSI): Not specified.
Moving Averages: Short-term and long-term moving averages indicate a bearish trend.
MACD: Not specified.
Pivot Points: Not specified.
🔮 Short-Term Outlook
Analysts forecast that TCS may reach ₹2,953.43 within a week and ₹2,707.65 within four weeks.
⚠️ Conclusion
The current technical indicators suggest a bearish trend for TCS over the past month. Investors should exercise caution and consider these factors when making investment decisions.
TCS trade ideas
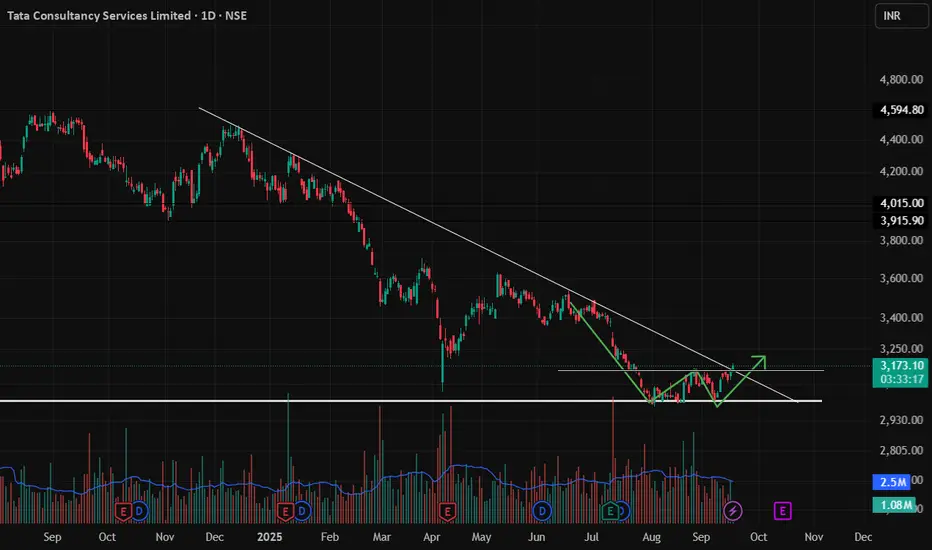
TCS - Time to go up towards 3500+ Bullish CRAB PRZ at play
TF: Daily
CMP: 2965
Here is my previous post on this script for a detailed review.
Price has completed the potential target as per the Bullish Crab pattern.
Results are due in the next couple of weeks.
I expect the stock to bounce from this zone 2900-2950 and potentially march towards 3500+ in the coming weeks
Internal wave counts are also marked in this chart.
I will await bullish confirmation candle in this zone for a good RR entry.
Disclaimer: I am not a SEBI registered Analyst and this is not a trading advise. Views are personal and for educational purpose only. Please consult your Financial Advisor for any investment decisions. Please consider my views only to get a different perspective (FOR or AGAINST your views). Please don't trade FNO based on my views. If you like my analysis and learnt something from it, please give a BOOST. Feel free to express your thoughts and questions in the comments section.
Option Trading Derivatives (FAO)1. Introduction to FAO
FAO stands for Futures and Options, two major categories of derivatives. Derivatives are financial contracts whose value depends on an underlying asset, such as stocks, indices, commodities, currencies, or interest rates. The primary purpose of derivatives is to provide risk management, speculation, and arbitrage opportunities.
Key Features of FAO:
Leverage: Traders can control large positions with relatively small capital.
Hedging: Protect against adverse price movements in underlying assets.
Speculation: Profit from both rising and falling markets.
Liquidity: Popular derivatives are highly liquid, allowing easy entry and exit.
2. Understanding Options
Options are contracts that give the buyer the right, but not the obligation, to buy or sell an underlying asset at a predetermined price (strike price) before or on a specific date (expiry date). There are two primary types of options:
Call Option: Gives the holder the right to buy the underlying asset at a fixed price.
Put Option: Gives the holder the right to sell the underlying asset at a fixed price.
Key Terminology:
Strike Price: Price at which the option can be exercised.
Premium: Price paid to purchase the option.
Expiry Date: Date on which the option contract becomes invalid.
In-the-Money (ITM), Out-of-the-Money (OTM), At-the-Money (ATM): Terms describing the relationship between the strike price and current market price.
Options provide flexibility and multiple strategies for traders, allowing them to maximize profits or minimize losses.
3. Understanding Futures
Futures are standardized contracts that oblige the buyer to purchase and the seller to sell an asset at a predetermined price and date. Unlike options, futures contracts carry an obligation to buy or sell, not just a right. They are widely used in commodities, indices, currencies, and interest rate markets.
Key Features:
Leverage: Futures allow traders to control large positions with a fraction of the total contract value.
Mark-to-Market: Daily settlement of gains and losses ensures liquidity and transparency.
Hedging and Speculation: Corporations hedge against price fluctuations, while traders speculate on market direction.
4. FAO Trading Mechanics
Trading FAO requires understanding market participants, contract specifications, and trading platforms.
Market Participants:
Hedgers: Minimize risk exposure. Example: Farmers selling crop futures.
Speculators: Profit from market movements. Example: Traders buying stock options.
Arbitrageurs: Exploit price differences across markets.
Contract Specifications:
Lot Size: Minimum quantity for trading a contract.
Expiry Cycle: Monthly or weekly expirations.
Margin Requirements: Funds required to maintain positions.
Trading FAO occurs on regulated exchanges, such as NSE, BSE, CME, and ICE, providing standardized contracts, clearing mechanisms, and transparent pricing.
5. FAO Trading Strategies
5.1 Option Strategies:
Covered Call: Holding underlying shares and selling call options to earn premium.
Protective Put: Buying a put option to protect against downside risk.
Straddle: Buying call and put options simultaneously to profit from volatility.
Iron Condor: Combining multiple options to profit from low volatility.
5.2 Futures Strategies:
Hedging: Lock in future prices to mitigate risk.
Speculation: Taking positions to profit from expected price movements.
Spread Trading: Buying and selling related futures to benefit from relative price changes.
6. Risk Management in FAO
Trading derivatives involves high risk due to leverage and market volatility. Effective risk management strategies include:
Setting Stop-Loss Orders: Automatically exit losing trades.
Position Sizing: Allocate only a fraction of capital to each trade.
Diversification: Spread exposure across assets and strategies.
Volatility Analysis: Understand implied and historical volatility for better decision-making.
7. Advantages of FAO Trading
Leverage for Higher Returns: Small capital can control large positions.
Hedging Capabilities: Protect investments from market swings.
Flexibility and Variety: Multiple strategies suit different market conditions.
Transparency and Regulation: Exchange-traded derivatives ensure standardized practices.
8. Challenges and Risks
High Volatility: Prices can move quickly against traders.
Complexity: Advanced knowledge is required for strategy execution.
Margin Calls: Traders may need to deposit additional funds if losses occur.
Liquidity Risk: Not all options or futures are highly liquid.
9. Regulatory Environment
FAO markets are tightly regulated to protect investors:
Securities and Exchange Board of India (SEBI) regulates derivatives trading in India.
Commodity Futures Trading Commission (CFTC) and SEC regulate U.S. markets.
Exchange Rules: Each exchange sets contract specifications, margin requirements, and trading hours.
10. Practical Examples of FAO Trading
Hedging Example: A wheat farmer sells wheat futures to lock in a price before harvest.
Speculation Example: A trader buys Nifty call options expecting an upward movement.
Volatility Trading: Traders implement straddles and strangles during earnings season to profit from price swings.
11. Technology and FAO
Modern FAO trading relies heavily on algorithmic trading, AI analytics, and real-time data. Platforms offer:
Option Chain Analysis: View all available options for a stock or index.
Greeks Monitoring: Delta, Gamma, Theta, Vega – to understand option sensitivity.
Risk Management Tools: Automated alerts and portfolio analytics.
12. Conclusion
Option trading derivatives (FAO) represent a powerful set of financial instruments that combine leverage, flexibility, and risk management. While they provide opportunities for profit maximization, they also carry substantial risks, making knowledge, discipline, and strategy essential. Successful FAO trading requires understanding market mechanics, advanced strategies, and effective risk management to harness the potential of these derivatives responsibly.
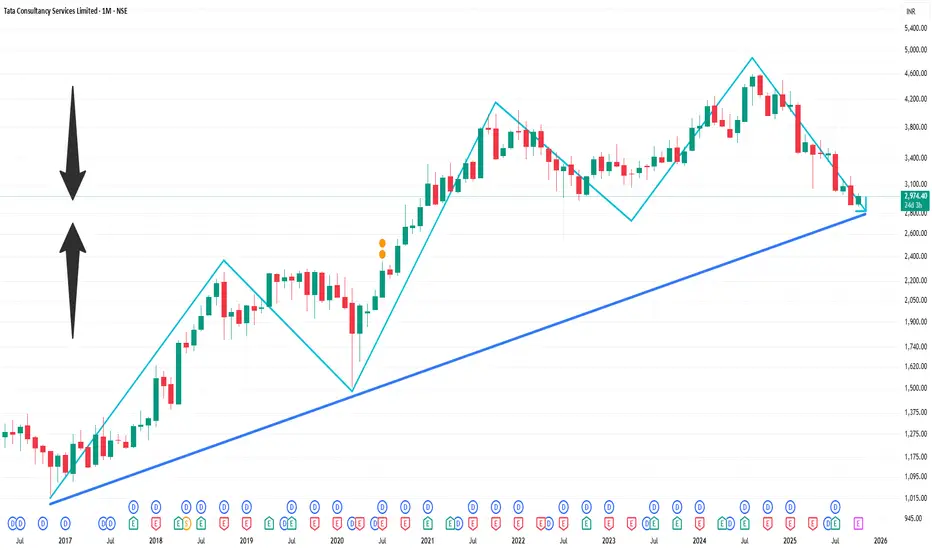
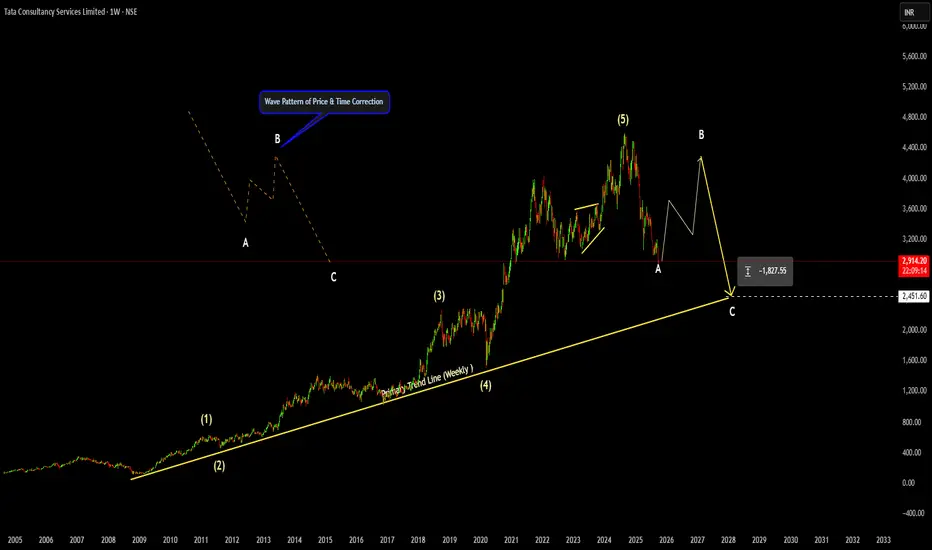
Wave Pattern Identified This is an ideal pattern found after a Breif Bull Run in the Market
These type of patterns repeat themself on all time factors
This cycle is Weekly Price & Time cycle
I have left side explained how the pattern of 3 Stroke will look like in Text Book
and on real time You can witness one movement of 3 stroke pattern is complete
Expect an Pull back move before heading for final Retest of Primary Trend on weekly time frame
This is education content
Good luck
TCS Projection For Next 52 Weeks Bullish View From 01Oct25Key Strength of TCS
1. The full name of TCS is Tata Consultancy Services Limited.
2. It is a company of the Tata Group.
3. It was founded in 1968.
4. Its headquarters is located in Mumbai, Maharashtra.
5. It is one of India’s largest IT service companies.
6. TCS provides IT consulting and digital solutions at the global level.
7. The company operates in more than 46 countries.
8. It has over 600,000 employees.
9. The company functions through more than 200 delivery centers.
10. The company’s revenue is around 30 billion US dollars.
11. TCS focuses mainly on IT services and business solutions.
12. It provides application development services.
13. TCS is also a leader in cloud computing.
14. The company places strong emphasis on digital transformation.
15. Business Process Outsourcing (BPO) is part of its services.
16. It offers specialized solutions for banking and finance.
17. The healthcare sector is also a major client base.
18. It provides services to the retail industry as well.
19. Telecom and manufacturing sectors are its clients.
20. The company develops AI and machine learning solutions.
21. Data analytics is also part of its offerings.
22. It works in the field of the Internet of Things (IoT).
23. It also provides cybersecurity solutions.
24. The company is known for its Global Network Delivery Model.
25. It serves Fortune 500 companies.
26. The United States is TCS’s largest market.
27. It also has a strong presence in Europe and Asia.
28. It has numerous development centers in India.
29. Its R&D unit is located in Pune.
30. This unit is named TRDDC.
31. TRDDC works on software research and engineering.
32. The company has developed tools like MasterCraft.
33. iON is its platform for education and examination solutions.
34. TCS BaNCS is a product for financial institutions.
35. The company’s mission is to enable business through technology.
36. It continually invests in innovation.
37. It has a Co-Innovation Network.
38. It collaborates with universities and startups.
39. K. Krithivasan is its current CEO.
40. Before him, Rajesh Gopinathan was the CEO.
41. Tata Sons is its largest shareholder.
42. The company is listed on the Indian stock market.
43. Its ticker symbol on NSE is TCS.
44. It is known as a major dividend-paying company.
45. In 2018, it crossed a market cap of 100 billion dollars.
46. It holds a leading position in India’s IT industry.
47. It is also a top company by employee strength.
48. Employees come from various countries.
49. A large number of women are employed.
50. The company has focused on digital skill training.
51. It is preparing itself for an AI-driven future.
52. Recently it launched an AI transformation unit.
53. Amit Kapur has been appointed as the head of this unit.
54. The company has extended contracts with global firms like Virgin Atlantic.
55. During Covid-19, it adopted a work-from-home model.
56. Its Secure Borderless Workspaces model became well known.
57. It is active in CSR activities.
58. It works in education and healthcare under CSR.
59. It contributes to environmental protection as well.
60. It has participated in the Digital India initiative.
61. The company has trained lakhs of youth in skill development.
62. It promotes diversity and equal opportunities.
63. It places special emphasis on women leadership.
64. It is a leader in campus recruitment.
65. It is highly popular among engineering students.
66. The company’s work culture is considered professional and collaborative.
67. Employee development programs are conducted.
68. Digital platforms are available for learning.
69. The company has registered many patents.
70. It develops innovation-based solutions.
71. Its financial performance has been consistently strong.
72. Its global client retention rate is high.
73. Customer satisfaction is its priority.
74. It also works with governments of many countries.
75. The company provides IT infrastructure services.
76. Cloud migration solutions are also available.
77. Partnerships with AWS and Azure are included.
78. It also offers SAP and Oracle services.
79. The demand for digital banking solutions is growing.
80. The company contributes significantly to India’s export sector.
81. Its share in the Indian economy is notable.
82. It ranks at the top in IT exports.
83. The company’s brand value is considered trustworthy.
84. It has won numerous technology awards.
85. It follows governance and transparency standards.
86. Its management structure is strong.
87. Global recession can be seen as a challenge.
88. Infosys, Wipro, and HCL are its competitors.
89. Employee costs and visa rules are also challenges.
90. Even then, the company’s performance has remained stable.
91. Its focus on new technologies has increased.
92. Artificial intelligence is part of its future strategy.
93. It is working on generative AI solutions.
94. The company provides digital advantages to its clients.
95. It is efficient in handling long-term contracts.
96. Client loyalty is its major strength.
97. The trust of the Tata brand gives it strong support.
98. It has a strong identity in the global economy.
99. It is considered the face of India’s IT industry.
100. TCS will continue to lead in technology and innovation in the future.
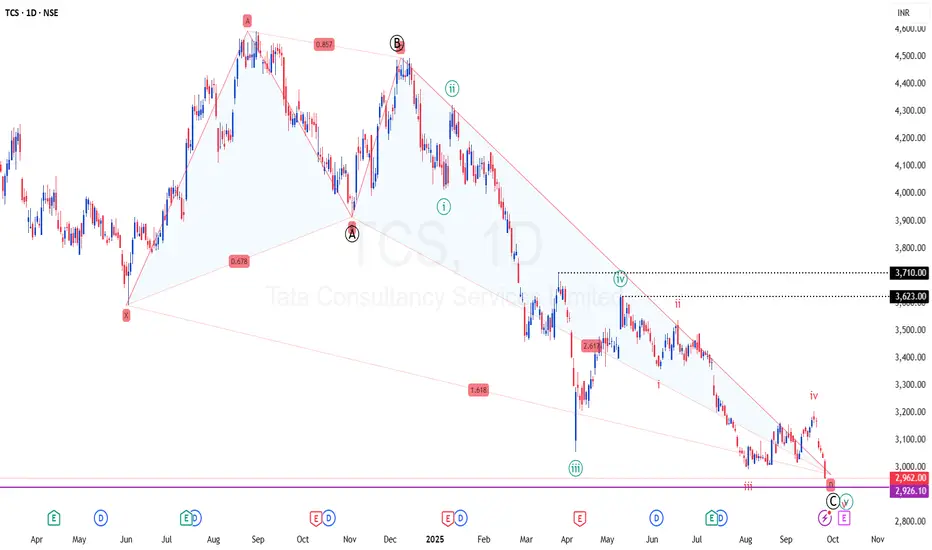
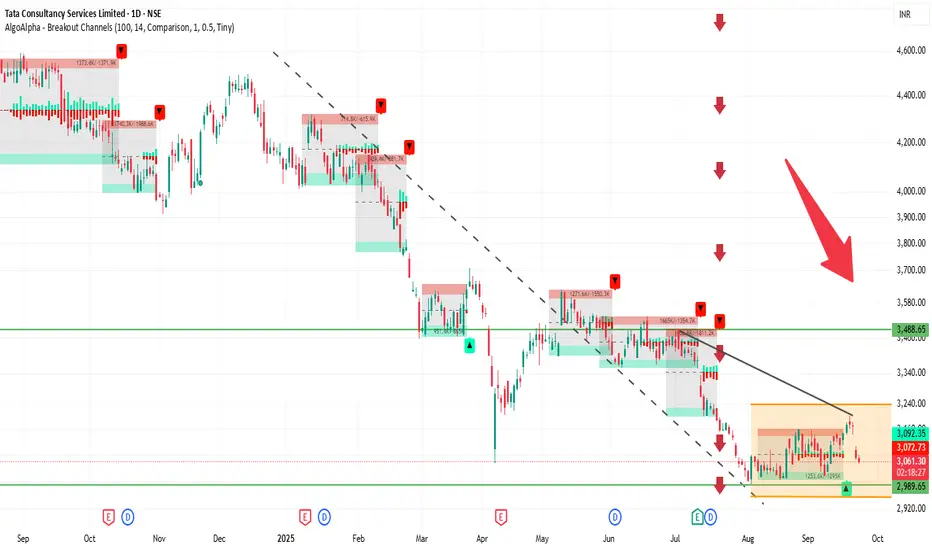
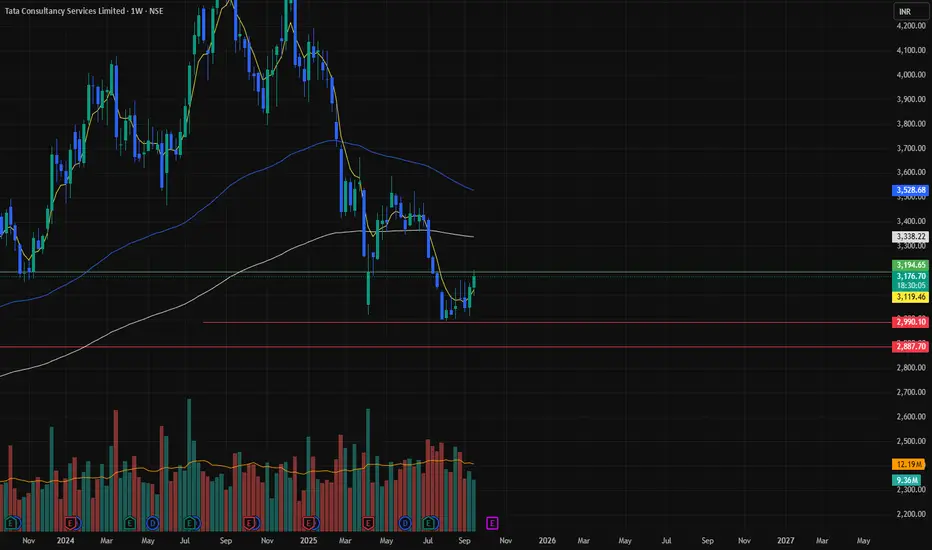
TCS – Bearish Outlook Intact, But a Wave B Bounce in Play?Chart Structure (Weekly)
TCS has been locked in a corrective decline since the 4592.25 peak. The latest fall into the historical support cluster (near 3056–2890) completed a five-wave structure within wave A. From here, a bounce toward wave B is possible, with resistance around 3350–3600.
Bullish trigger: RSI shows a bullish divergence (price made a lower low, RSI made a higher low).
Upside potential: A move towards the 3350 resistance zone.
Downside risk: If support fails, the next major level sits near 2292 — aligning with a larger wave C.
So the long-term outlook remains bearish, but a short-term bounce looks probable.
Fundamental Headwind
Adding to the technical picture, the looming H1-B visa fee hike is a structural negative for Indian IT companies. TCS, Infosys, and peers with heavy US revenue exposure could see margin pressure in the quarters ahead. This reinforces the larger bearish bias, making any bounce counter-trend in nature.
Illustrative Option Play – Bull Call Spread
For those looking to play the short-term bounce while limiting risk, one way is to structure a bull call spread:
Buy 3000 CE (Oct Expiry) at ₹42.1
Sell 3040 CE (Oct Expiry) at ₹31.25
Lot size: 175
Net Cost: ₹1,899
Max Profit: ₹5,101 (~26%)
Max Loss: ₹1,899 (~10%)
Breakeven: 3011(4%)
Reward/Risk: 2.7
(Note: Prices are as of EoB 29th September 2025. This is only an example to demonstrate risk-managed structures. Not a trade recommendation.)
Summary
Long-term: Bearish, with risk of a wave C drop toward 2292.
Short-term: Bounce into wave B likely, targeting 3350–3600.
Strategy: A bull call spread provides a clean, limited-risk way to play this bounce, while respecting the larger bearish setup.
Disclaimer: This analysis is for educational purposes only and does not constitute investment advice. Please do your own research (DYOR) before making any trading decisions.

TCS 1 Week Time Frame Weekly Technical Overview
Current Price: ₹3,028.30 on the NSE
52-Week Range: ₹2,866.60 – ₹4,494.90
Volume: Approximately 8.8 million shares traded this week
VWAP: ₹3,032.15
Market Cap: ₹1.095 trillion
Beta: 0.97 (indicating moderate volatility
🔍 Key Technical Indicators
Moving Averages: TCS is trading below its 200-day moving average, suggesting a bearish trend.
RSI: The Relative Strength Index is in the neutral zone, indicating balanced buying and selling pressures.
MACD: The Moving Average Convergence Divergence is showing a bearish crossover, which may signal a potential downward movement.
📈 Outlook
Support Levels: Immediate support is observed around ₹2,950, with a stronger support zone near ₹2,870.
Resistance Levels: Key resistance is at ₹3,100, followed by ₹3,200.
Volatility: The stock's beta of 0.97 suggests that it moves in line with the broader market, with moderate volatility.
Part 3 Institutional TradingPart 1: Introduction to Option Trading
Option trading is a sophisticated financial instrument that allows traders to speculate on or hedge against the future price movements of an underlying asset. Options provide rights, not obligations, giving traders flexibility compared to traditional stock trading. Unlike futures, where contracts are binding, options give the choice to exercise or let expire. This makes them attractive for hedging, income generation, and speculative strategies.
Part 2: What is an Option?
An option is a contract between a buyer and seller that gives the buyer the right, but not the obligation, to buy or sell an underlying asset at a predetermined price (strike price) on or before a specific date (expiration).
Call Option: Right to buy the underlying asset.
Put Option: Right to sell the underlying asset.
Options derive their value from the underlying asset, which can be stocks, indices, commodities, or currencies.
Part 3: Key Terminology in Option Trading
Understanding options requires familiarity with core terms:
Strike Price: Price at which the option can be exercised.
Expiration Date: Last date the option can be exercised.
Premium: Price paid by the buyer to purchase the option.
In-the-Money (ITM): Option has intrinsic value.
Out-of-the-Money (OTM): Option has no intrinsic value.
At-the-Money (ATM): Option’s strike price is near the current market price.
Part 4: Types of Option Contracts
Options can be categorized as:
American Options: Can be exercised any time before expiration.
European Options: Can be exercised only on expiration.
Exotic Options: Complex options with non-standard features, e.g., barrier, Asian, or digital options.
Part 5: Option Payoff Structure
Option payoffs determine profit or loss:
Call Option Payoff: Profit if underlying price > strike price at expiration.
Put Option Payoff: Profit if underlying price < strike price at expiration.
Graphs are often used to visualize potential profit/loss for both buyers and sellers.
Part 6: Option Pricing Components
Option prices (premiums) are influenced by:
Intrinsic Value: Difference between strike price and underlying price.
Time Value: Additional value due to time remaining until expiration.
Volatility: Higher volatility increases option premiums.
Interest Rates & Dividends: Affect option valuation for stocks.
Part 7: Option Pricing Models
Common models used to calculate option premiums:
Black-Scholes Model: For European options, considers volatility, interest rate, strike price, and time.
Binomial Model: Uses a tree of possible prices to calculate option value.
Monte Carlo Simulation: Used for complex or exotic options.
Part 8: The Greeks – Measuring Risk
Greeks quantify how an option’s price changes with market variables:
Delta: Sensitivity to underlying price.
Gamma: Rate of change of delta.
Theta: Time decay impact.
Vega: Sensitivity to volatility.
Rho: Sensitivity to interest rates.
Greeks help traders manage risk and structure positions.
Part 9: Option Strategies for Beginners
Simple strategies include:
Long Call: Buying a call to profit from price rise.
Long Put: Buying a put to profit from price fall.
Covered Call: Selling a call against owned stock for income.
Protective Put: Buying a put to hedge an existing stock.
Part 10: Advanced Option Strategies
Advanced strategies include:
Spreads: Buying and selling options of the same type to limit risk.
Vertical Spread, Horizontal/Calendar Spread, Diagonal Spread.
Straddles & Strangles: Betting on high volatility without direction bias.
Butterfly & Condor: Complex strategies for range-bound markets.

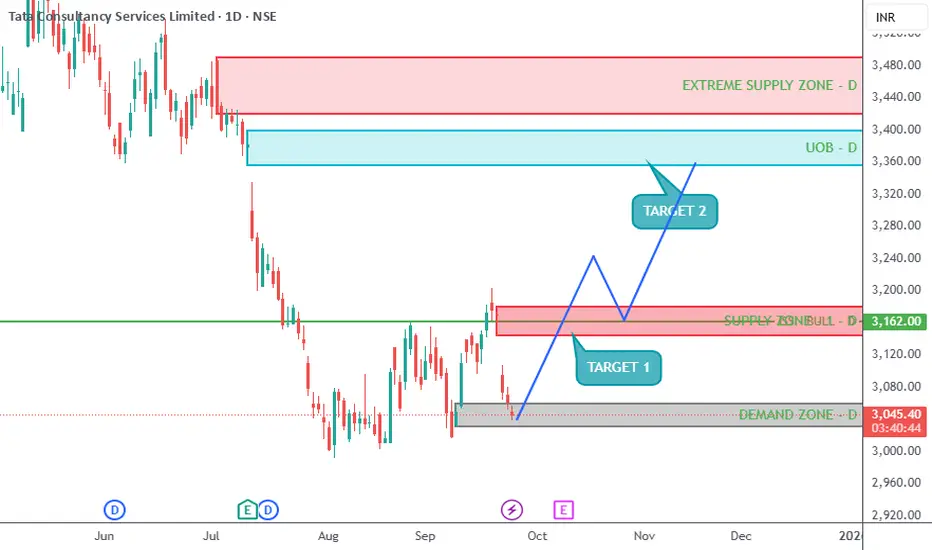
BULLISH TREND - TCS - CASH OR OCT FUTURETCS is being respected at the extreme demand zone and now upside movement will start. TCS can be bought with the stoploss of 3000 and extreme target of 3500. INTERMEDIATE target of 3150-3300 are also there.
TOTAL BULLISH ON TCS TILL NOVEMBER 2025
📉 THIS CHANNEL IS ONLY FOR EDUCATIONAL PURPOSES.
Disclaimer: I am Not a SEBI registered analyst. I just share my positions to do paper trading and no where its a recommendation! Please do your own analysis before taking any trade.
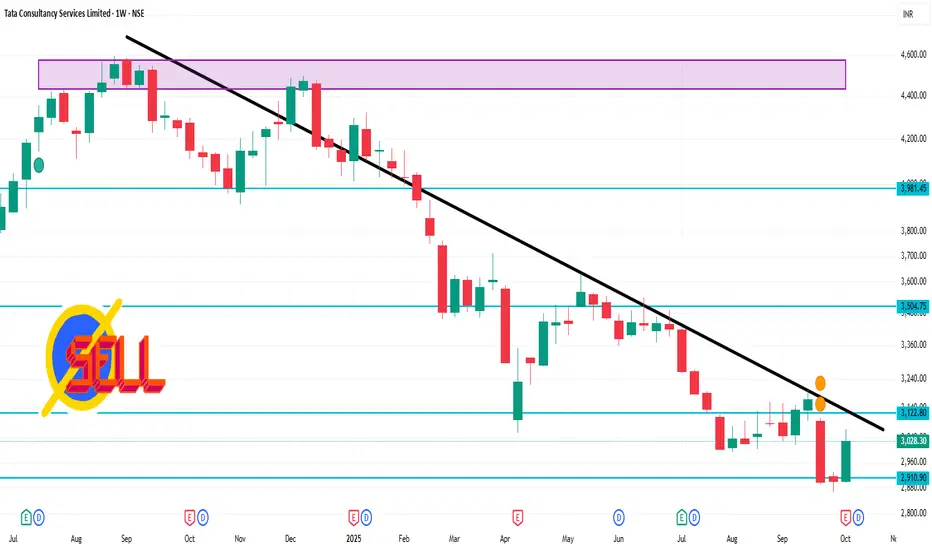
Tcs 52 week low - Today creates a new and fresh 52 week low
- Also breaks 5 Years important support
- expecting this fall may continue
- Next important support 2600 and 2200
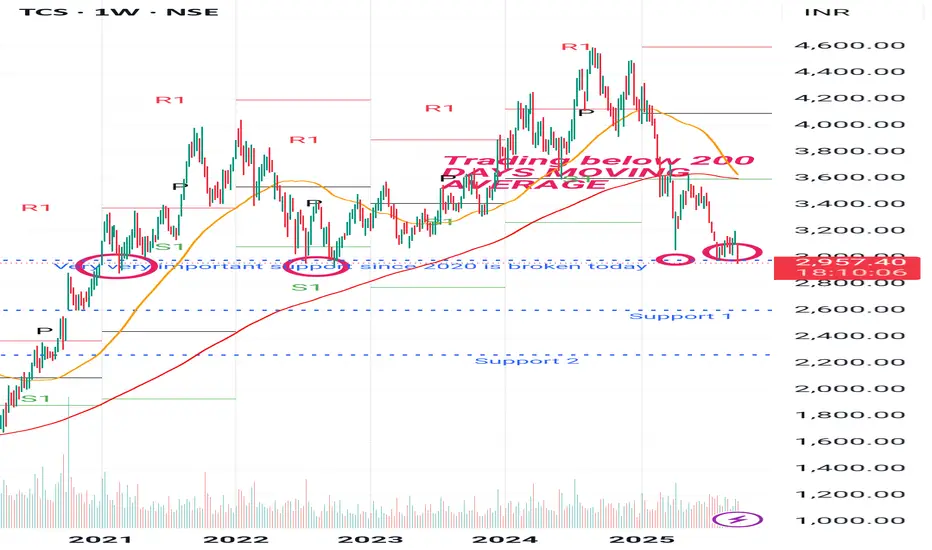
Tcs 52 week low - Trading below 200days moving average
- today breaks 5 years of strong support level 2950
- expecting this fall may continue
- Next support 2600 and 2200
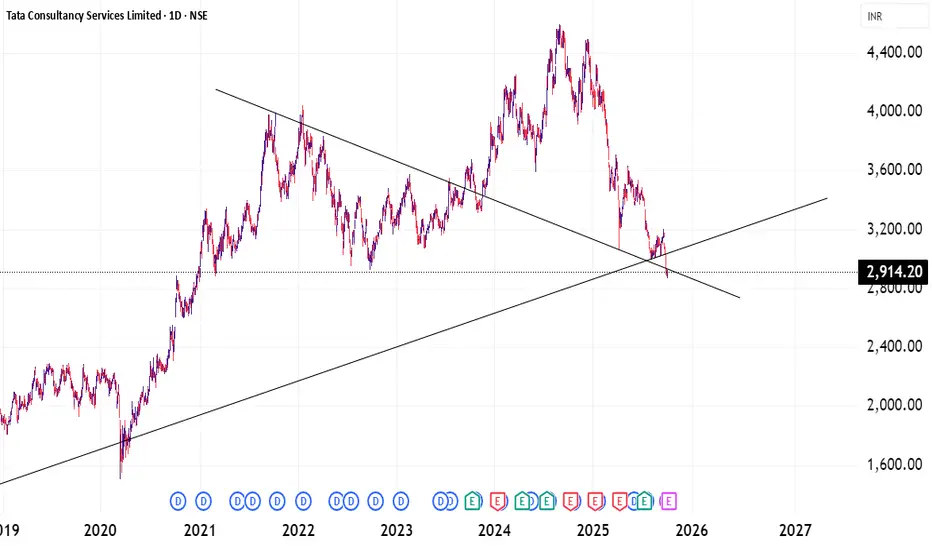
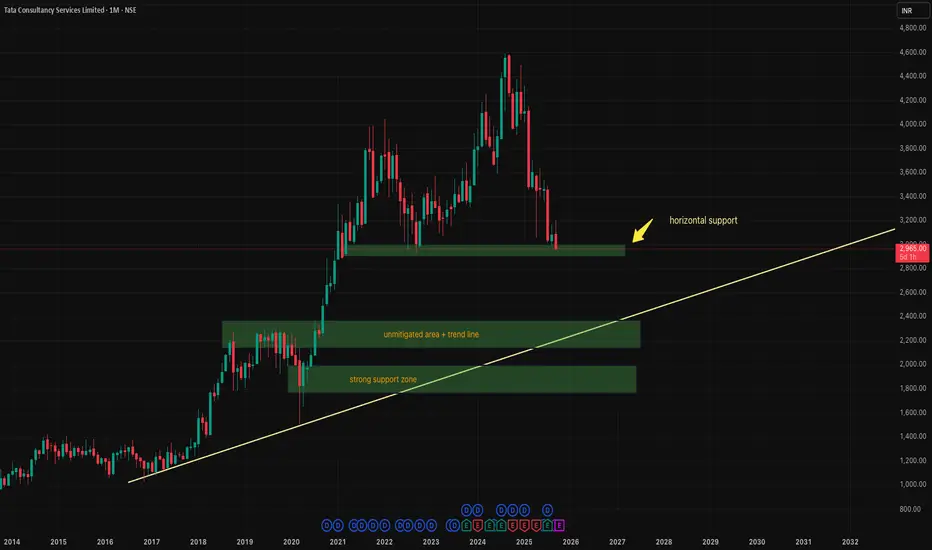
long trade on TCS for positional tradingas there is support on monthly tf we can expect price to rise from there
and if it does not happen there is a trend line and a combination of horizontal support
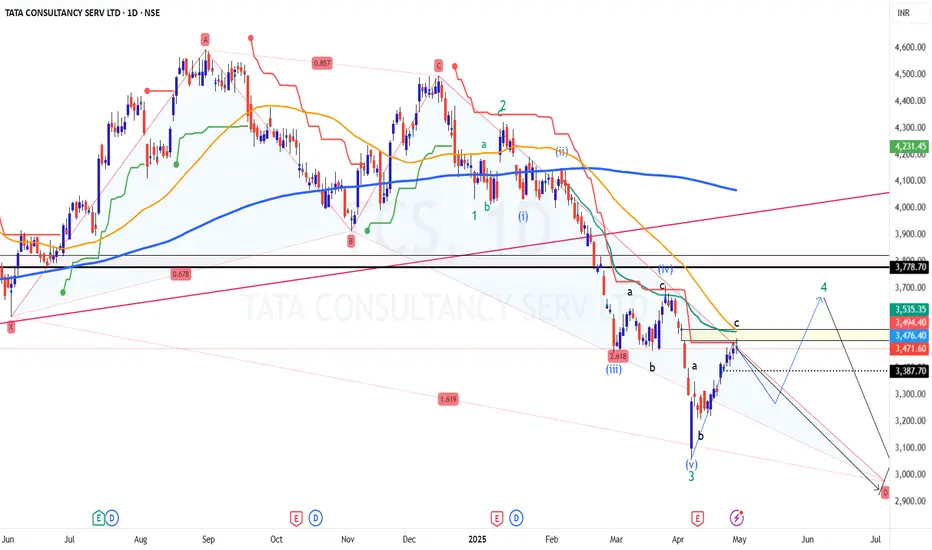
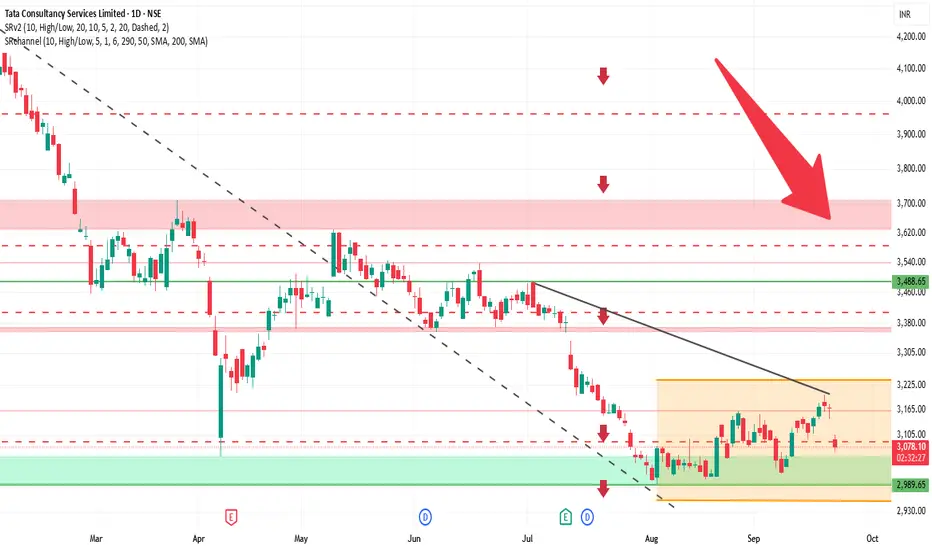
TCS at Confluence of Resistance / EMA / ST/ GAP/ AVWAP / FIB
Between 3500-3550, TCS could face strong resistance on multiple fronts and they are listed below.
Daily SuperTrend
GAP Zone
50 DEMA at 3540 (retesting it after a long time, expect a rejection)
Fib retracement of 61.8% of the recent swing
Avwap from the recent swing (at 3530)
100% (abc pullback) from the swing low (at 1498)
Daily chart with Harmonic pattern, suggests that one more low at 3000 odd levels is due. The same is being observed as per the EW counts
Here is the chart with possible path/count/target destinations
Finally, this is a first bounce after a sharp correction; expect first bounces to be sold in to, similarly, first dip will be bought in to.
In all likelihood, I am not expecting TCS to go up much from here.. expecting a meaningful decline before resuming the upmove.
Disclaimer: I am not a SEBI registered Analyst and this is not a trading advise. Views are personal and for educational purpose only. Please consult your Financial Advisor for any investment decisions. Please consider my views only to get a different perspective (FOR or AGAINST your views). Please don't trade FNO based on my views. If you like my analysis and learnt something from it, please give a BOOST. Feel free to express your thoughts and questions in the comments section.
TCS 1D Time frame📍 Current Price & Range
Current price: ₹3,063.80
Day’s High / Low: ₹3,106.90 / ₹3,052.00
52-week High / Low: ₹4,494.90 / ₹2,991.60
🔍 Key Levels
Immediate resistance: ₹3,100–₹3,110
Next resistance: ₹3,200–₹3,250
Immediate support: ₹3,050–₹3,060
Psychological / strong support: ₹3,000
📊 Indicators & Momentum
Price is just below near-term resistance, showing hesitation.
Short-term trend is neutral to slightly bearish; momentum is weak.
RSI and MACD suggest neutral to weak momentum, no strong reversal yet.
Stock is trading well below its 52-week high, indicating it has already corrected significantly.
🔮 Possible Scenarios
Bullish breakout → Sustaining above ₹3,110 could push price toward ₹3,200–₹3,250.
Sideways / consolidation → Likely to trade between ₹3,050–₹3,110 if no strong catalyst.
Bearish pullback → Breaking below ₹3,050 may take price toward ₹3,000, and further down to ₹2,950–₹2,900 if weakness continues.
👉 Outlook: At the current level (₹3,073.80), TCS is in a neutral zone. The next directional move depends on either a breakout above resistance or a fall below support.
Best Candlestick Patterns for Traders1. Doji Candle
Definition
A Doji candle is formed when the open and close prices are virtually equal, creating a candle with a small or non-existent body and long shadows. The Doji signifies indecision in the market. Neither buyers nor sellers have control, indicating a potential reversal or a continuation depending on context.
Types of Doji Candles
Standard Doji: Equal open and close prices with long upper and lower wicks.
Dragonfly Doji: Small body at the top, long lower shadow. Indicates bullish reversal if found at the bottom of a downtrend.
Gravestone Doji: Small body at the bottom, long upper shadow. Indicates bearish reversal if found at the top of an uptrend.
Long-Legged Doji: Long upper and lower wicks with a tiny body. Shows extreme indecision.
Trading Implications
Appears after strong trends to indicate potential reversals.
Confirmation is critical; traders often wait for the next candle to determine the market’s direction.
Risk management is essential because Doji candles alone do not guarantee a reversal.
Example
Imagine a strong bullish trend; suddenly, a Gravestone Doji appears. This could indicate that buyers are losing control, and a bearish reversal might follow. Traders might consider exiting long positions or preparing for a short opportunity.
2. Engulfing Pattern
Definition
The Engulfing Pattern consists of two candles:
Bullish Engulfing: A small bearish candle followed by a larger bullish candle that completely engulfs the previous candle’s body.
Bearish Engulfing: A small bullish candle followed by a larger bearish candle that engulfs the previous candle.
This pattern signifies a strong shift in market sentiment.
Characteristics
Bullish Engulfing:
Occurs at the bottom of a downtrend.
Indicates buyers taking control.
Bearish Engulfing:
Occurs at the top of an uptrend.
Indicates sellers taking control.
Trading Strategy
Look for significant volume during the engulfing candle for confirmation.
Place stop-loss below the swing low for bullish or above swing high for bearish setups.
Often paired with support and resistance levels for higher accuracy.
Example
During a downtrend, a small red candle is followed by a large green candle engulfing it. This signals that bulls are overpowering bears and a potential trend reversal is imminent.
3. Hammer and Hanging Man
Definition
These patterns have small bodies and long lower shadows. They often signal potential reversals but depend on their placement in the trend:
Hammer: Bullish reversal at the bottom of a downtrend.
Hanging Man: Bearish reversal at the top of an uptrend.
Characteristics
Body is small.
Lower shadow is at least twice the size of the body.
Upper shadow is minimal or absent.
Trading Insights
Hammer:
Appears after a downtrend.
Buyers start to gain momentum.
Confirmation comes from the next bullish candle.
Hanging Man:
Appears after an uptrend.
Sellers might be gaining control.
Confirmation comes from a bearish candle following it.
Example
In an uptrend, a Hanging Man appears. The next candle is red, confirming that sellers are exerting pressure. Traders may look to short or exit long positions.
4. Morning Star and Evening Star
Definition
These are three-candle patterns that indicate trend reversals:
Morning Star: Bullish reversal at the bottom of a downtrend.
Evening Star: Bearish reversal at the top of an uptrend.
Components
Morning Star:
First candle: Large bearish candle.
Second candle: Small-bodied candle (Doji or spinning top) indicating indecision.
Third candle: Large bullish candle closing at least halfway into the first candle’s body.
Evening Star:
First candle: Large bullish candle.
Second candle: Small-bodied candle showing indecision.
Third candle: Large bearish candle closing at least halfway into the first candle’s body.
Trading Approach
Confirm the pattern with volume.
Look for support/resistance levels aligning with the pattern.
Set stop-loss just below the lowest point (Morning Star) or above the highest point (Evening Star).
Example
In a downtrend, a Morning Star appears. The first candle is red, the second a small Doji, and the third a large green candle. This indicates a potential bullish reversal, signaling a long trade setup.
5. Shooting Star and Inverted Hammer
Definition
These patterns are opposite of Hammer and Hanging Man and indicate potential reversals based on trend location:
Shooting Star: Bearish reversal at the top of an uptrend.
Inverted Hammer: Bullish reversal at the bottom of a downtrend.
Characteristics
Small body.
Long upper shadow, at least twice the length of the body.
Minimal or no lower shadow.
Trading Implications
Shooting Star:
Appears after an uptrend.
Suggests bulls are losing control.
Confirmation comes from the next bearish candle.
Inverted Hammer:
Appears after a downtrend.
Suggests buyers are gaining momentum.
Confirmation comes from the next bullish candle.
Example
An uptrend sees a Shooting Star appear. The next candle is red, confirming sellers’ dominance, signaling potential short opportunities.
Conclusion
Candlestick patterns are invaluable tools in technical analysis, helping traders anticipate potential reversals, continuations, and market sentiment shifts. Among the myriad of patterns, the Doji, Engulfing, Hammer/Hanging Man, Morning/Evening Star, and Shooting Star/Inverted Hammer are considered the top 5 due to their reliability and simplicity.
Key Takeaways:
Always use candlestick patterns in context with trend and volume.
Confirmation is crucial; no single pattern guarantees a reversal.
Combine candlestick analysis with other technical tools like support/resistance, moving averages, and RSI for higher probability trades.
Risk management, stop-losses, and position sizing are essential for trading success.
By mastering these top 5 candlestick patterns, traders can gain a powerful edge in analyzing market behavior and making informed decisions.
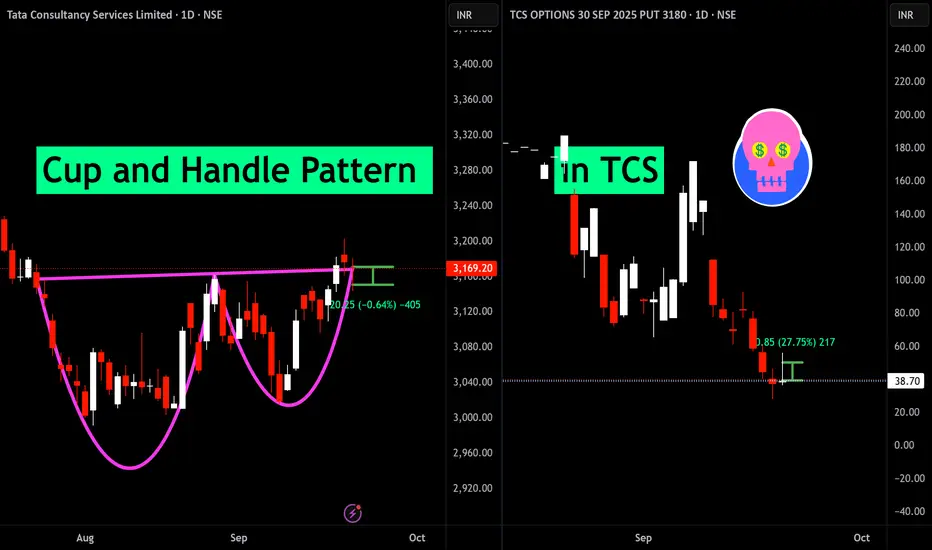
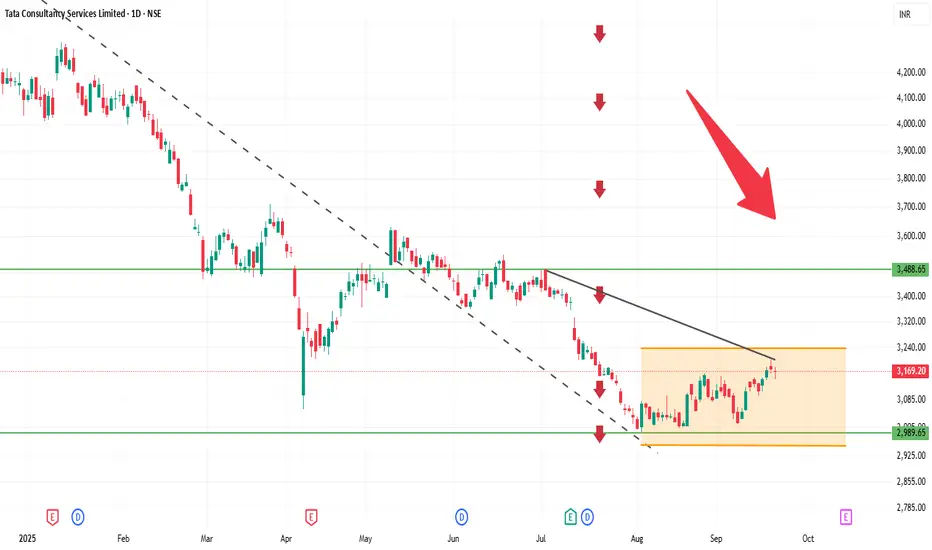
Cup and Handle Pattern failed in TCSThe cup and handle pattern has formed, but the anticipated breakout has not materialized. This failed breakout may indicate the potential for further downside movement in the stock
TCS 1D Time frame🔍 Current Price & Context
Trading around ₹3,089
Day’s range: ₹3,065 – ₹3,107
Previous close: ₹3,171
Market sentiment: Bearish, influenced by external factors affecting IT stocks.
📊 Technical Indicators
Moving Averages: Short-term averages are slightly above current price, acting as resistance.
RSI (14): ~30, indicating oversold conditions.
MACD: Negative, showing bearish momentum.
Stochastic Oscillator: Oversold, may suggest a short-term reversal.
CCI (20): Below zero, confirming bearish trend.
ROC (20): Negative, indicating declining momentum.
🧮 Strategy / Trade Ideas
Long Setup:
Entry near support (~3,050) if bullish reversal appears
Stop Loss: Below 3,000
Targets: 3,100 first, then 3,150
Short / Pullback Setup:
Entry if price fails near resistance (~3,100)
Stop Loss: Above 3,150
Targets: 3,050 first, then 3,000
✅ Summary
TCS on daily chart is bearish but oversold. Watch immediate support (~3,050) for potential reversal, and resistance (~3,100 – 3,120) for pullback risk. A breakout above resistance could target 3,150+, while failure of support may lead toward 3,000.
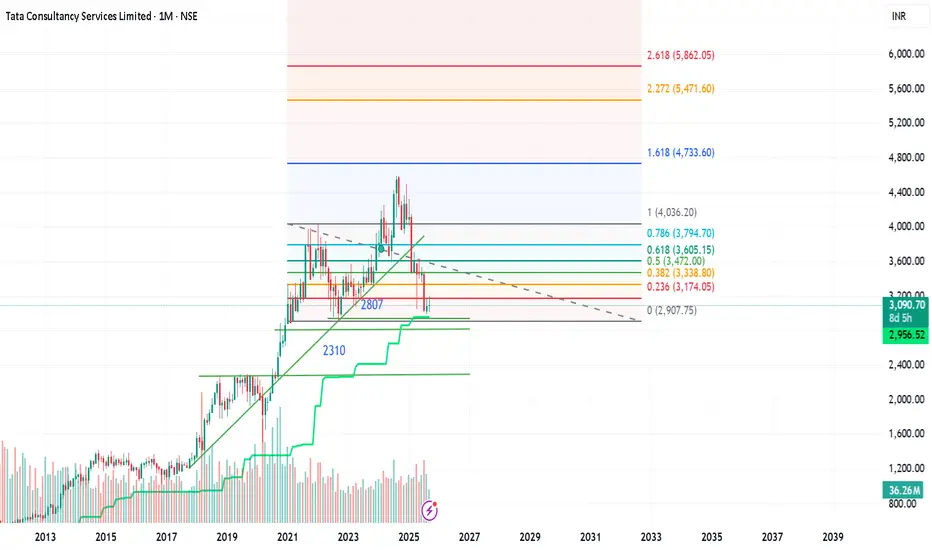
TCS Status Trend Overview
- Long-term uptrend: From 2013 to around 2021, TCS showed a strong bullish trajectory.
- Recent consolidation: Post-2021, the price has been range-bound, suggesting indecision or accumulation.
🔍 Key Technical Insights
1. Fibonacci Levels
These help identify potential support/resistance zones and price targets:
- Current price: ₹3,094 is hovering near the 0.382 retracement level (₹3,059.60), which often acts as a pivot.
- Support zones:
- ₹2,891.10 (0.5 level)
- ₹2,722.60 (0.618 level)
- ₹2,488.35 (0.786 level)
- Upside targets (if bullish momentum resumes):
- ₹3,763.60 (1.618 extension)
- ₹4,191.10 (2.0 extension)
- ₹5,085.10 (2.618 extension)
2. Support Levels
- ₹2,800: A strong horizontal support, tested multiple times.
- ₹2,310: Deeper support, possibly a long-term floor if broader correction occurs.
3. Buy/Sell Signal
- BUY: ₹3,094.00
- SELL: ₹3,091.30
This narrow spread suggests a neutral stance or low volatility at the moment.
4. Trend Line
- The green line likely represents a moving average or trendline support, reinforcing the ₹2,800 zone as a key level to watch.
5. Volume
- Volume bars show participation. Any spike near support/resistance levels can confirm breakout or reversal strength.
🧠 Interpretation for Traders
- Bullish bias if price holds above ₹3,059 and breaks ₹3,263 (0.236 level).
- Bearish risk if price breaks below ₹2,891 and heads toward ₹2,722 or ₹2,488.
- Neutral zone between ₹2,891 and ₹3,263—ideal for range trading or waiting for confirmation.
Would you like me to overlay Gann levels or model a payoff scenario based on this chart? I can also help you build a dynamic dashboard to track these zones live.
TCS 1D Time frameCurrent Price: Around 3,174
Current Trend: Stock is in a sideways to slightly bullish phase after consolidation.
Support Zone: Strong support at 3,140 – 3,150. Buyers may defend this level.
Resistance Zone: Key resistance at 3,200 – 3,220. A breakout above 3,220 can trigger fresh upside.
Indicators: Daily candles indicate mild buying interest; volume is stable.
Outlook:
Above 3,220 → bullish momentum may extend toward 3,250+.
Below 3,140 → weakness may push toward 3,100–3,120.
👉 In short:
Range: 3,140 – 3,220.
Neutral to slightly bullish; breakout will determine next move.
WAIT FOR PULLBACK 3125Please consult your financial advisor before investing.This is only for learning purpose of chart.
We are NISM certified EQ and MCX trader but not SEBI register investment advisor.
TGT 3490-3530..
SL 2990....
TRY TO GET PRICE < 3130....
TCS 1D Time frameCurrent Snapshot
Price: ₹3,174
Stock has moved above earlier resistance zones (₹3,150 – ₹3,170).
Momentum looks positive, buyers are holding strength.
📌 Key Levels
Immediate Resistance: ₹3,190 – ₹3,200
Next Resistance: ₹3,220 – ₹3,250
Immediate Support: ₹3,150 – ₹3,160
Stronger Support: ₹3,100 – ₹3,120
✅ Outlook
If TCS sustains above ₹3,170, it can extend the rally toward ₹3,200 – ₹3,220.
If it slips back below ₹3,160, consolidation may happen around ₹3,120 – ₹3,150.
Larger trend remains bullish as long as price stays above ₹3,100.
Options Greeks & Advanced Hedging Strategies1. Introduction to Options
Options are derivative instruments that provide the right, but not the obligation, to buy or sell an underlying asset at a predetermined price before or on a specified expiry date. There are two main types:
Call Options – Give the holder the right to buy the underlying asset.
Put Options – Give the holder the right to sell the underlying asset.
Unlike equities, options are inherently more complex because their value is influenced by multiple variables such as underlying price, strike price, time to expiration, volatility, interest rates, and dividends. This multidimensionality is captured by the Greeks, which form the backbone of options risk management.
2. Understanding Options Greeks
The Greeks quantify the sensitivity of an option’s price to various market factors. They are indispensable for assessing risk and structuring trades. The primary Greeks are Delta, Gamma, Theta, Vega, and Rho, each serving a specific purpose.
2.1 Delta (Δ) – Price Sensitivity
Delta measures the rate of change of an option's price with respect to the price movement of the underlying asset.
Call Delta ranges from 0 to 1.
Put Delta ranges from -1 to 0.
Interpretation:
A delta of 0.6 for a call option indicates that if the underlying asset moves up by ₹1, the call option price will increase by ₹0.60.
Traders use delta to gauge the directional exposure of their portfolio, often referred to as delta exposure.
Delta Hedging:
Delta hedging is a strategy where traders neutralize the delta of a position by taking an offsetting position in the underlying asset. For example, if you hold a call option with a delta of 0.6 on 100 shares, you can short 60 shares of the underlying to make the position delta-neutral.
2.2 Gamma (Γ) – Rate of Change of Delta
Gamma measures the rate of change of delta with respect to changes in the underlying asset price.
High Gamma indicates that delta changes rapidly with underlying price movement.
Low Gamma implies delta is stable.
Importance of Gamma:
Gamma is crucial for understanding convexity risk, especially near the option’s expiry or at-the-money options.
Traders use gamma to anticipate how delta hedges will change as the market moves.
Gamma Hedging:
Gamma hedging involves balancing a portfolio such that it remains neutral to delta changes. Typically, it requires frequent adjustments because gamma fluctuates as underlying prices move.
2.3 Theta (Θ) – Time Decay
Theta represents the rate at which an option loses value as time passes, holding other factors constant.
Options are decaying assets, losing value every day due to time erosion.
Call and put options experience negative theta for holders (long positions) and positive theta for writers (short positions).
Applications:
Long options traders must account for theta decay, especially in volatile markets.
Strategies like calendar spreads or selling options exploit theta decay to generate income.
2.4 Vega (ν) – Volatility Sensitivity
Vega measures an option’s sensitivity to changes in implied volatility of the underlying asset.
Options prices increase with higher volatility (for both calls and puts).
Vega is higher for at-the-money options and long-dated options.
Volatility Trading:
Traders can take positions purely on expected volatility changes without relying on directional movement.
Long Vega positions profit from volatility spikes, while short Vega strategies benefit from declining volatility.
2.5 Rho (ρ) – Interest Rate Sensitivity
Rho measures sensitivity to changes in the risk-free interest rate.
More significant for long-term options.
A call option’s price rises with increasing interest rates, while put options decline.
Practical Relevance:
Rho is relatively minor compared to delta or vega but becomes crucial in macroeconomic shifts, especially for options with long maturities.
3. Combining Greeks for Portfolio Management
While each Greek provides specific insights, professional traders consider multiple Greeks simultaneously to manage comprehensive risk. This multidimensional approach allows traders to:
Maintain delta neutrality – minimize directional risk.
Control gamma exposure – manage rapid changes in delta.
Optimize theta decay – benefit from time erosion.
Manage vega risk – protect against volatility shocks.
Monitor rho impact – for long-term interest-sensitive trades.
Example:
A trader holding a long call may delta-hedge by shorting the underlying. If gamma is high, the hedge needs frequent adjustments. Additionally, they must consider theta decay, particularly if the position is near expiry.
4. Advanced Hedging Strategies
Hedging with options is a way to protect portfolios from adverse movements while retaining profit potential. Advanced hedging strategies involve using combinations of options, futures, and the underlying asset.
4.1 Delta Neutral Hedging
Objective: Make a portfolio insensitive to small price movements.
Method: Offset delta of options with underlying asset or other derivatives.
Example: Long call delta of 0.6 → Short 60 shares of the underlying.
Advantages:
Reduces directional risk.
Can be dynamically adjusted to changing deltas.
Limitations:
Frequent rebalancing is required due to gamma exposure.
4.2 Gamma Scalping
Objective: Profit from price swings in the underlying asset while remaining delta neutral.
Method: Buy options with high gamma. As underlying moves, delta changes are hedged dynamically, locking in profits from volatility.
Applications: Used by market makers and professional traders to extract profit from intraday volatility.
4.3 Vega Hedging
Objective: Neutralize exposure to volatility changes.
Method: Offset vega by taking positions in options with opposite volatility sensitivity (e.g., long a call and short a call with different strike prices or maturities).
Applications: Useful during earnings announcements, geopolitical events, or expected market turbulence.
4.4 Calendar and Diagonal Spreads
Calendar Spread: Buy a long-dated option and sell a short-dated option of the same strike.
Diagonal Spread: Combine different strikes and expiries.
Purpose: Exploit theta decay and volatility differences while limiting directional risk.
Example: A trader expecting stable markets but rising volatility may buy a long-term call and sell a near-term call.
4.5 Protective Puts & Collars
Protective Put: Buying a put option to safeguard a long stock position.
Collar: Combining a protective put with a covered call to limit downside while capping upside.
Applications: Hedging large equity positions during uncertain markets.
4.6 Ratio & Backspread Strategies
Ratio Spread: Buy/sell unequal number of options to balance cost and risk.
Backspread: Sell a small number of near-term options and buy a larger number of far-term options.
Use Case: Profitable in high volatility expectations, providing leveraged exposure with hedged downside.
5. Greeks-Based Risk Management
A sophisticated options trader actively monitors Greeks to:
Adjust positions dynamically – react to price, time, and volatility changes.
Measure risk-reward tradeoffs – understand potential loss in extreme scenarios.
Stress-test portfolios – simulate scenarios like sharp price jumps or volatility spikes.
Optimize hedging costs – reduce capital expenditure while maintaining protection.
Conclusion
Options Greeks are the foundation for advanced options trading and risk management. Understanding delta, gamma, theta, vega, and rho enables traders to quantify risk, structure trades, and implement sophisticated hedging strategies. By combining these metrics with advanced approaches like delta neutral hedging, gamma scalping, vega hedging, spreads, and collars, traders can protect portfolios against adverse movements while seizing opportunities in volatile markets.
For Indian traders, these strategies are highly relevant in indices like Nifty, Bank Nifty, and sectoral options, as well as in individual stocks. Mastery of Greeks and hedging not only enhances risk management but also opens avenues for strategic income generation, volatility trading, and portfolio optimization.
In an increasingly complex and volatile market environment, leveraging Options Greeks and advanced hedging strategies is no longer optional—it is essential for any serious options trader aiming for consistent, risk-adjusted returns.
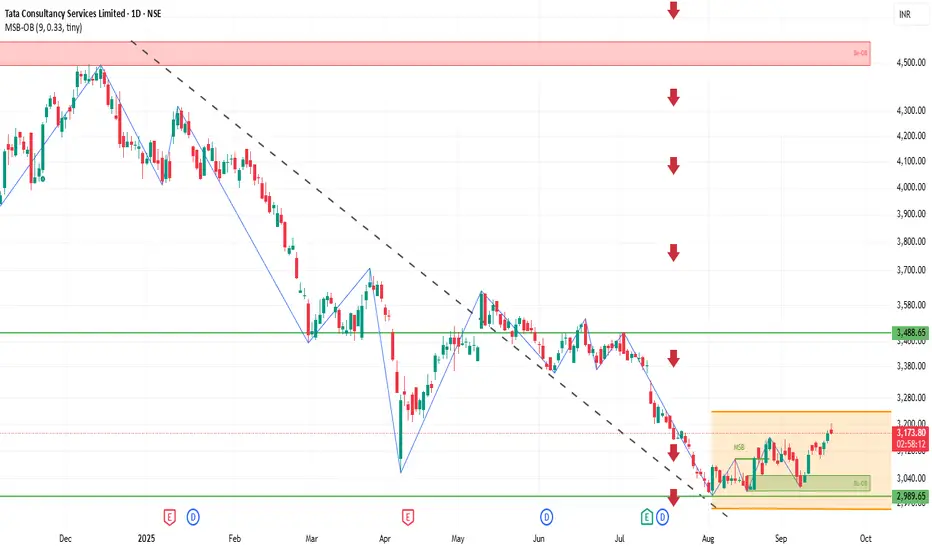
TCS Breaking outPrice consolidating near resistance after a strong base formation. A breakout above this zone may trigger momentum towards higher levels.