TCS Ready for quick fall,TCS seem to be falling for a next couple of days, may try to test 3000 again
Trade ideas

TCS is in UptrendAs per my analysis , TCS is in Uptrend and I was updated all the support and resistance levels in this chart

TCS View for Earning Season - Oct 2022 Another view of TCS for this earning season..
WIll it follow the Elliot wave or harmonic pattern post results let me know who is successful in which direction in comments...
Downside 2930 Double bottom for Harmonic Entry
If breaks this level next going to see elliot wave 5 @ 2800 - 2700 levels
If holds 2930 and good results are posted since last few Qtr's have been negative
Upside good targets of Fib level 1.618 level last Target of 3490
Short & Medium level targets: 2198 / 2232 / 2375 / 3358
Support: tradingview.com/ gopro /?share_your_love=Gunshot321
All the Best Guys!!! :)
Regards

TCS Trend and financial Analysis Financial Analysis:
1) Debt free company
2) Higher PE Ratio compare to other
IT company
3) OPM Higher than other company
4) ROCE more than 40%
5) Cash Rich Company
6) Operating Expense increase will leads to shrink in Gross Margin(even though revenue increase).
7) if revenue and gross margin get shrink in upcoming Quarter definitely TCS will touch 2073 by end of mid 2024
8) if revenue decrease in upcoming Quarter definitely we can except pressure in IT Sector in upcoming Quarter

TCS at critical point. Make or break
Good Day
Hello Traders,
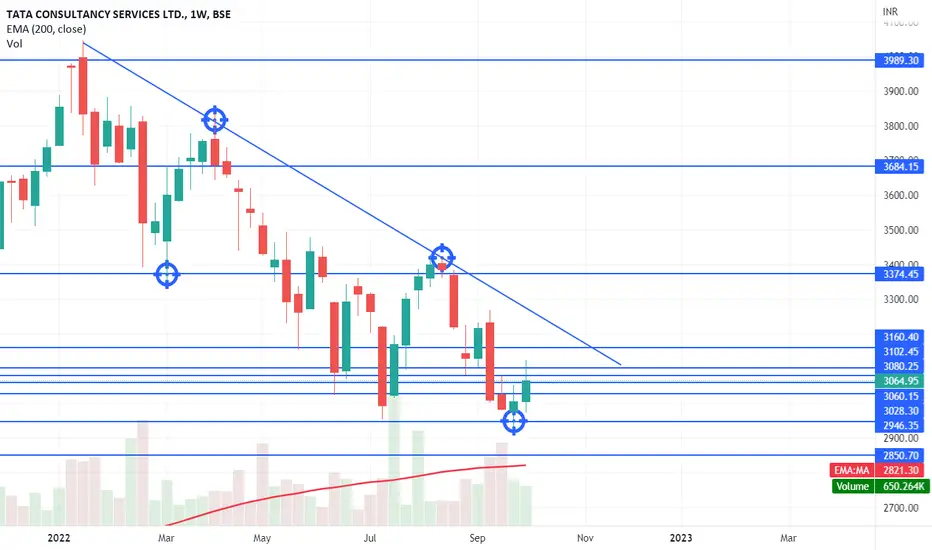
With Nifty IT Index falling from the All-Time high of 39446 to 26245 , a fall of 13201 points (-33.46% )
TCS with the weightage of 29.33% in Nifty IT Index made an all time high of 4043 made a recent low of 2926 (-27.62%).
If it started trading below 3000 then can go as low as 2880 very sharply, but with the current scenario one can
start accumulating for long term portfolio as it 28% cheaper. also you keep holding with strict stop loss of 3000 for a quick upside as its been IT stocks
are lagging behind.
Disclaimer : I am not SEBI registered analyst, this is for educational purposes.
Please trade as per your risk and do consult with your financial advisor before taking any
trading decisions.
If you really like the analysis , please do comments, LIKE and Follow me.

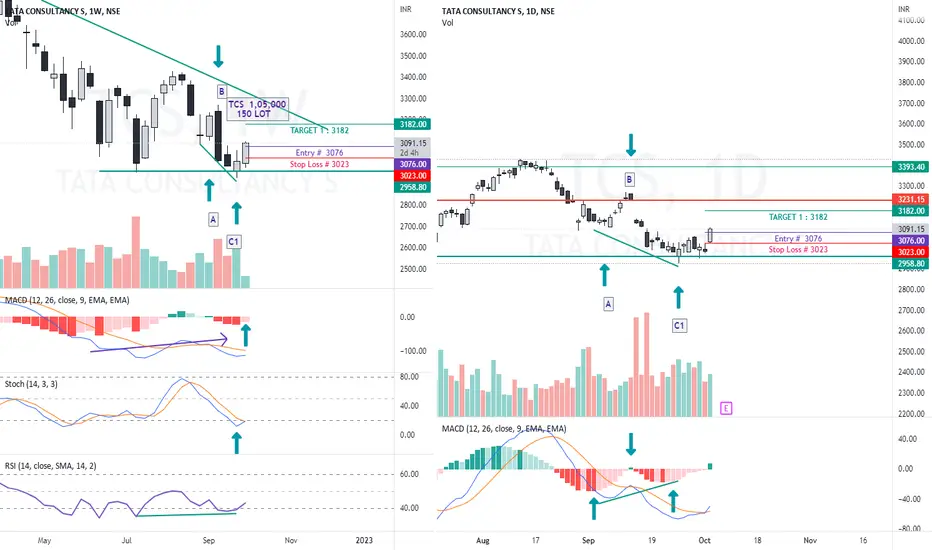
TCS As per Elder Impulse System Divergnceweekly MACD give Divergence Histogram Bar
Daily also give Divergence
Buy below as possible 3076
Stoploss 3023
target at least 1:2
TCS - Inverted HnS breakout - Good for LongTCS has given inverted Head and shoulder breakout at 3025 resistance level with good volume.
This seems to be good signal of trend reversal in the stock after underperformance since long.
Good for short / medium trade/investment.
SL: Hrly close below 2975 levels.


breakoutscript broke its tight range
tested the level with 1-2 candles above range
looks tempting to go long
based on resistance level breakout theory
getting support of volume and also RSI
disclaimer - trade @ own risk, stop and target based on risk appetite

TCS 10 Percentage Upside Swing TradeTCS 10 Percentage Upside Swing Trade xabcd activate in tcs... you can buy from green line red line your target...nifty it bullish ho sakta hai usme tcs achyya kr sakta hai

This idea forshort team treader TCS Stock only education preposethe Disclaimer for all of this tcs stock is going to break out on downtrend two to three days

TCS LONG FOR INVESTING AT 2900tcs is about to complete its correction at 2800, thats very good for investing in this bluechip stock.
entry- 2900.
stopped- 2600.
target 1- 4423
target 2- 4890.


TCSPrice action is nearing support at 2960 - 2980.
Possoble scenarios :
1. Price may take 3000 - 3010 support and have a pull back towards 3060 before falling.
2. Price may take support at 2960 - 2980.
3. Price may break the support and fall further.

Oversold BuechipThis is one of those oversold bluechip. For a quick 10% return in a month's time. Just jump in now. A relief rally is coming. Maintain SL

It looks like its forming an "W" pattern. Its an early entry. Its an early entry which will give an great risk to reward if the analysis comes true and if not can give very small stop loss. This pattern will already give 1:3 risk to reward trade till it goes to its neck line. and after its neck line breakout we can even sit for an technical pattern of W. Which will again give as very huge risk to reward ratio.

TCS GOOD FOR SWING TCS GOOD FOR SWING TRADING
Rsi oversold
Support zone
CPM 3052
stop loss 2800
1st target 3232
2nd target 3393


tcs stock only for education prepose down trend if support brea disclamer only for education prepose tcs if it is break out happen means u can buy put option


Tata Consultancy Trend Change Hi, I'm new to trading and started from chart reading and patterns. Your suggestion and Ideas are valuable to me, comment your thoughts and Let's learn together.

TCS is ready to shoot up !!The analysis is based on Smart Money Concept. Great opportunity to go long.
