#StockMarket #StockIdeas #StocktoWatch #StockToBuy #positionalTCS
Stock recently broke its resistance of 3715 levels
Buy at CMP for Short term target of 3765/3825
Its a portfolio stock, so can be kept for long term also.
----
Note:
Above levels are for education purposes only
Do your own analysis before taking any trade
Trade ideas

A very Big Opportunity In TCS.TCS stock price is ready for a very big target.
Buy Above- 3715
Stop Loss- 3685
Target is given in the pic.
Note:
-You can use a very flexible stoploss by your choice.
-Only buy when 15 minute candle is closing above 3710 with a heavy volume.

Given trendline breakoutTCS has given a trendline breakout and looks good positionally (on closing basis) as well as intraday above 3714 level
Positional target 3827
Learn & Earn,
Dr. Tanya Kumar

#TCS very short term headed 3805/3845 with SL - 3592#TCS #SWINGTRADING
cmp 3672
Tgt 3805 /3845 / 3886
stoploss - 3592 ( daily close)
risk : reward 1:2

#QML pattern #highprobabilityReversalSetup#QML - High probability Reversal Trade set up.
#this method gives you less #risk to high #reward.
It can be used in any stocks, index, currency and as well in cryptos.

TCS March month ExpTCS to be in range bound between 3400 - 3840.
We can look for shorting opportunity 3400PE and 3840CE with the assumption that it will range bound between the above said values.
This is only my research, please do research before investing.

TCS ELLIOTT WAVE ANALYSISTCS ELLIOTT wave analysis just for practice, now its undergoing irregular flat correction wave C final leg is on the way if the Leg e of Major leg C can go till 123.8-161.8% and then there might be the end of correction ongoing.

Long buildCheckout How many times TCS has touched the support Zone and bounce back after nearing to the support area.
Entry -3569
Stop loss- 3565( day closing)
Target - 1)3880 2)3922
The Idea is for Educational Purpose only

TCS_ Momentum with Cup & Handle and Options DataThe chart structure positive and entry will cup & handle neckline breakout at Rs 4000
Call writer are squaring their position at 4000, 4100 and 4200 and significant put writing as 3900.
Thanks

#Tcs cash : Looks good sell below 3595#TCS cash -Positional call
10.03.2022
Looks good sell only if breaks below 3595
Stoploss 3640
Target 3542/3502
Cmp 3620.95

TCS Took Support at 3400, ready for upmoveTCS has taken support at 3400 for the 2nd time which is forming W pattern. 3400 was previous resistance now acting as a support.

TCSCurrently the stock has discounted 11% from all time high levels.
TCS (Daily):
1. Stock has closed above 200 Days Exponential Moving Average
2. Increase in Buying Volumes since 3 days
3. Earlier resistance of 3400 levels is now acting as a very strong demand zone (as a support)
4. Formation of Double bottom pattern on a major demand zone (around 3400 levels)
5. Formed a Marubuzu candlestick pattern today
View Point:
1. Looks Bullish
Addl Points:
1. FII/FPI have decreased holdings from 15.37% to 14.98% in Dec 2021 qtr
2. Mutual Funds have increased holdings from 3.11% to 3.32% in Dec 2021 qtr.
Notes:
1. The above analysis is just for educational purpose.

TCS CONSOLIDATIONHere is a good opportunity to trade.
if this channel breaks above or below both can be traded with a 1:3 risk-reward it will be a quick move.
i prefer upperside because of previous trend.

TCSTCS Head and shoulder pattern conformed to sell-side targets given
Before Entering Trade do Your own Analysis it's Only for Educational Purpose
Thank you so much for Your Support

TCS shortTrade details:
Monthly tf: Market reach the all time fib extension levels (1.618). possible to came for correction.
Weekly tf: sideways going on
day tf: market reach the day support but, still it not change the trend to up trend, still we have a possibilities to sell
Hr tf : day tf correction completed (0.328) and hr tf trend was changed.

Expecting TCS to take a pullback and then to move upsideExpecting TCS to take a pullback and then to move upside. only for intraday and entry can be made based on intraday signals.
Joey! go long!

RANGE BO OF THE TECH GAINTAll details are provided in the chart.
Do follow for more simple price action analysis.
This is not a investment advise. Do your own analysis before investing.
TCS approaching towards a crucial supportAs the support and resistance are the fundamental blocks of the Technical analysis. The resistance earlier become support after breakout and vice versa. TCS is approaching to its crucial support keep an alert on this level.

#TCS ADD on retest of 3400/3300 #TCS amazing resilience on monthly charts potentially aided by buyback at 4500
Aug'21 breakout of 3312 has not been tested during Feb'22 carnage
Infact 3400 has not been broken once in last 5 mnths
opportunity to add at 3400/3300 retest if it happens

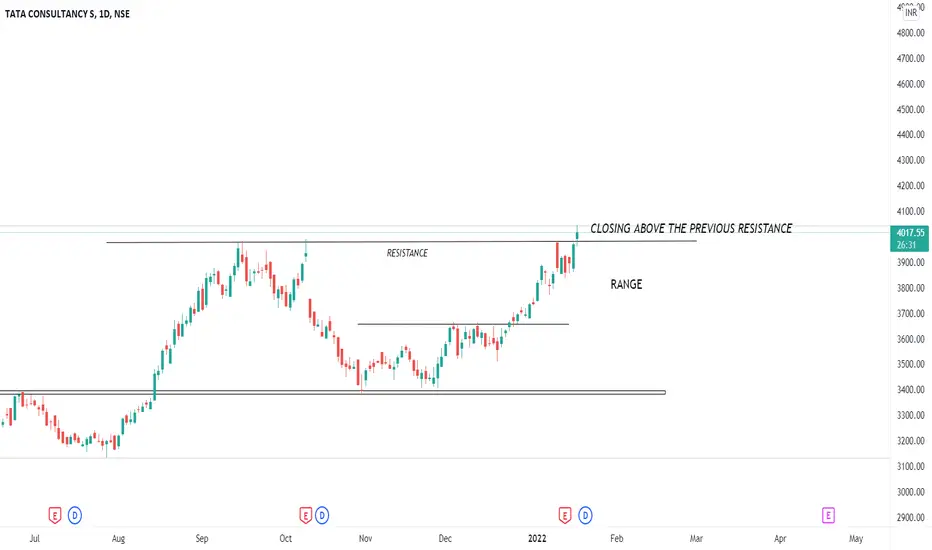
TCS what was resistance now acting as support Buy signalI will buy TCS because : HIGH PROBABILITY TRADE
It has been taking support
what was resistance now acting as support
So will be looking at buying opportunities.
Entry : 3520/3400
Target : 4018/4200
Stop loss : 3326

TCSTCS,thalaivan is back to form makkale.Let's make use of it.If u liked my ideas kindy follow and comment your thoughts in the comment section and as i always say, whatever we do must follow risk reward and money management.

TCS at a very important support point.All levels mentioned on the chart.
Nifty IT.
Possibility: Should see a rebound from here. If the global cues continue to be negative then can fall further to previous support.

TCS with a target of 3700 TCS is now near to support level and 1 hour trend line where it can jump up from support level 3550 to 3700 to fill the gap area of 21st feb's low and 22nd feb's high.
CMP : 3563
buy : 3550
target : 3700
SL: 3520
