TCS Long TradePositional trade of TCS Target- 3981 . Resistance Zone 3980-4000. If breakout of Rounding Bottom then Target : 4573 (15% from ATH)
Trade ideas

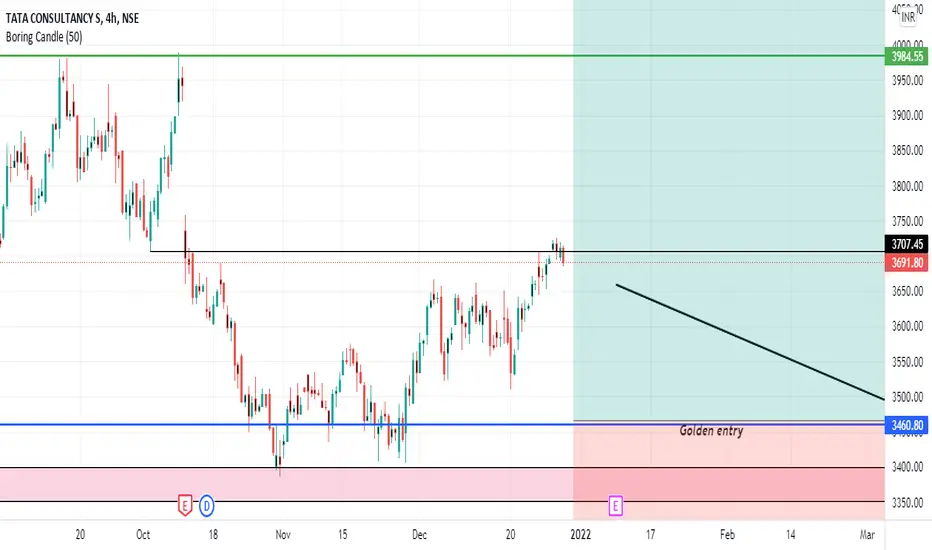
📊 TCS Swing Target Target 🎯NSE:TCS
As one can see, TCS heading towards Bearish Harmonic pattern's PRZ. If you find reversal, then only go for short. Actually we have given long view on TCS from current swing low now it's time to book that swing long trade. New short only initiate if you find reversal.
📌 To Trade on This Chart, You Should Have Reversal Trading Knowledge. As Harmonic is One Of The Best Reversal Trading Strategy, But Always Remember That Harmonic Patterns Also Can Fail (there is no holly grail In Stock Market). That's Why One Should Must Have Knowledge Of Reversal Trading To Trade On Harmonic Patterns.
📌 That Dash Line Is Called PRZ, From That Dash Line To that Horizontal Simple Line Area Is Whole PRZ(Price Reversal Zone).
******whatever charts or levels sharing here or on any other platforms are just for educational purpose only, Not A Recommendation To Buy Or Sell. Please do your own analysis before taking any trade on them. We are not SEBI registered.

TCS gap fillingTCS looks like it will cover the gap and fill it. 3862 could be seen soon. I am not a sebi registered trader/advisor this idea is for educational purposes only.

TCS - Breakout CompleteTCS completed its breakout today and is approaching all time high territory again. Might pull back to 3750 before resuming the rally.
Also, strong results expected might cause it to break ATH.
Rising delivery volumes gives me high conviction in this counter.
Entry near 3760 range
T1 = 3915 (it fell from here after Q2 results and created a huge gap till 3750)
T2 = 3970 (might show resistance at all time high zone)
Stop Loss = 3715 (below the VWAP of 3725 seen on 30 Dec as we saw above average delivery quantity that day)
For educational purposes only. Trade at your own risk.
Disclosure - I do not have any current positions in TCS.

TCS-BULLISHWhy this Trade..??
1.DOUBLE BOTTOM
Buy or Sell based on the Support Break with Volume
Disclaimer:This view is purely for educational purpose and it's my personal.Please consult your financial advisor before attempting any trade.We're not responsible for any loss or profits.

TCS Bullish Reversal and IT sector Bullish breakoutTCS showing bullish reversal from trendline support
IT Sector is Bullish
Reversal from RSI 50
Relative Strength need to cross above 0 line for more strength

SWING TRADE TARGET ACHIEVED - TATA CONSULTANCY SERVICESwing Trade Achieved - Tata Consultancy Services ( NSE:TCS )

TCS Expecting down sideTCS cmp 3740 around... can be short with sl 3800 for target 3240... it may take 20-30 sessions. Lets check it in lower time frame

TCS TARGET ACHIEVEDSuggested TCS @3489
3740 levels achieved
8% returns achieved!!!!
FOLLOW BELOW MENTIONED LINK FOR MORE DETAILS OF THE ANALYSIS.

TCS 1W TFTCS taking perfect support from the previous zone and is ready to touch new highs. Watch out for this stock for a long position.
CMP :- 3526
SL :- 3370
Target :- 4000+
R:R :- 1:3
Disclaimer :- This is just my view. Please analyse charts yourself and then decide to initiate trades.

SIP between CMP to 3665 SL 3550 TGT 3990 and 4100Suggestions are based on my analysis only. Please do your analysis before taking any trade.


TCS - Gap fill tradeThere is a gap in TCS which could soon start getting filled.
Long above 3760 with a SL below 3650.

Simple Trade Setup | TCS | 30-12-2021[INTRADAY] NSE:TCS
Trade Setup for Date: 30-12-2021
1) Don't Jump in to trade at the beginning of the market. Let it get settle for 15-20min first and judge the price action.
2) Everything is mentioned on the chart. I hope it is easy to understand.
3) All the levels will work as support, resistance, entry and exit w.r.t price action near that level.
4) Avoid gap up or gap down chase. Wait and trade between levels.
Please refer below chart for levels.
Hope I made it easy to understand it.
Do comment your doubt or suggestion.
Note: Trade with Strict SL. It may or may not hit all the levels. So one can book profit / loss at respective level considering how price action works near that level.

TCS BUYTCS buy for short term buy only for study purpose
TCS buy for short term buy only for study purpose
[ INTRADAY ] TCS LONG BET
risk: Reward ratio is 1: 2
Rest as per Charts
********
Note -
One of the best forms of Price Action is to not try to predict at all. Instead of that, ACT on the price. So, this chart tells “where” to act in “what direction. Unless it triggers, like, let’s say the candle doesn’t break the level which says “Buy/Sell if it breaks”, You should not buy/sell at all.
=======
I use shorthands for my trades.
“Positional” - means You can carry these positions and I do not see sharp volatility ahead.
“Intraday” -means You must close this position at any cost by the end of the day.
=======
Always follow a stop loss.
In the case of Intraday trades, it is mostly the “Low/High of the Candle”.
In the case of Positional trades, it is mostly the previous swings
********


Simple Trade Setup | TCS | 27-12-2021 [INTRADAY]NSE:TCS
All the levels and trade setup will be same as per previous.
Trade Setup for Date: 27-12-2021
1) Don't Jump in to trade at the beginning of the market. Let it get settle for 15-20min first and judge the price action.
2) Everything is mentioned on the chart. I hope it is easy to understand.
3) All the levels will work as support, resistance, entry and exit w.r.t price action near that level.
4) Avoid gap up or gap down chase. Wait and trade between levels.
Please refer below chart for levels.
Hope I made it easy to understand it.
Do comment your doubt or suggestion.
Note: Trade with Strict SL. It may or may not hit all the levels. So one can book profit / loss at respective level considering how price action works near that level.

SWING TRADE - R:R - 1:2 - TATA CONSULTANCY SERVICE - (NSE : TCS)Potential Opportunity as Swing Trade in NSE:TCS and also predicting positive for long term investment.
TOP TRENDING LINE IS BORKEN, WAIT FOR RE-TEST (RETRACE ACTION), IF ITS SUCCESSFUL THEN IT WILL REFLECT UPSIDE AS PREDICTION
IF RE-TEST DOESNT HAPPEN THEN IT IS A FAKE BREAK-OUT
RISK TO REWARD - 1:2
ENTRY - 3685
TARGET - 3805
STOP LOSS - 3625
This is for Educational Purpose only, please apply your prudence & consult your adviser before any investing.
#nse #swingtrade #nifty #tcs #tata #riskrewardratio


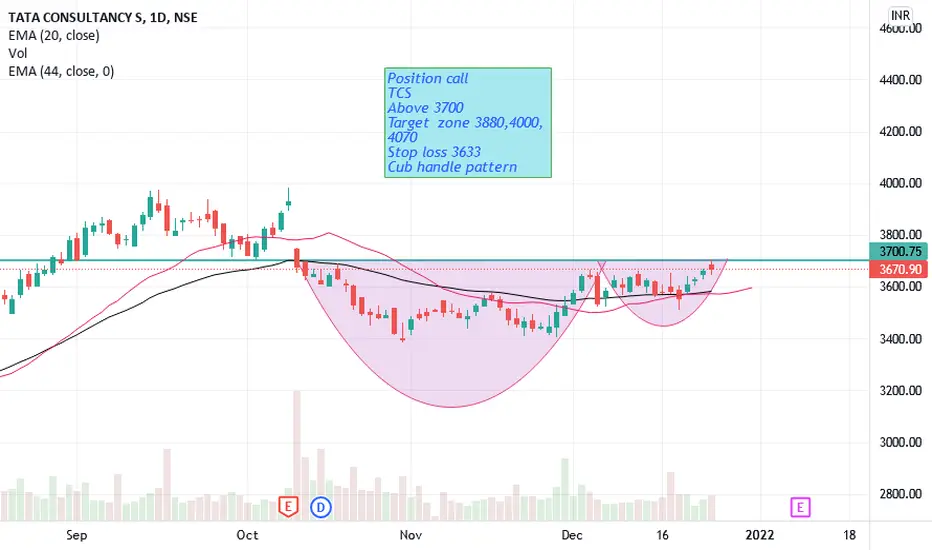
Breakout in TCSCup and handle breakout in TCS on daily chart.
RSI is bullish ( above 60).
Price is above 55 EMA.
Nifty IT is making all time highs when nifty is making lower lows , so there is strong support of sector.
In last two days , there is huge increase in open interest ( long bulid up).
If it sustains above the breakout level , it can give us a good swing upto 3900.

TCSIf we see in weekly timeframe TCS after coming out from trianglre pattern gave a rally and has again comeback to the that level and has taken a support .
in weekly and daiy timeframe both there is W pattern formation and price has taken support from neck line .
Long position can be made looking at such signal .
This is just my analysis do your own analysis before taking any trade .
