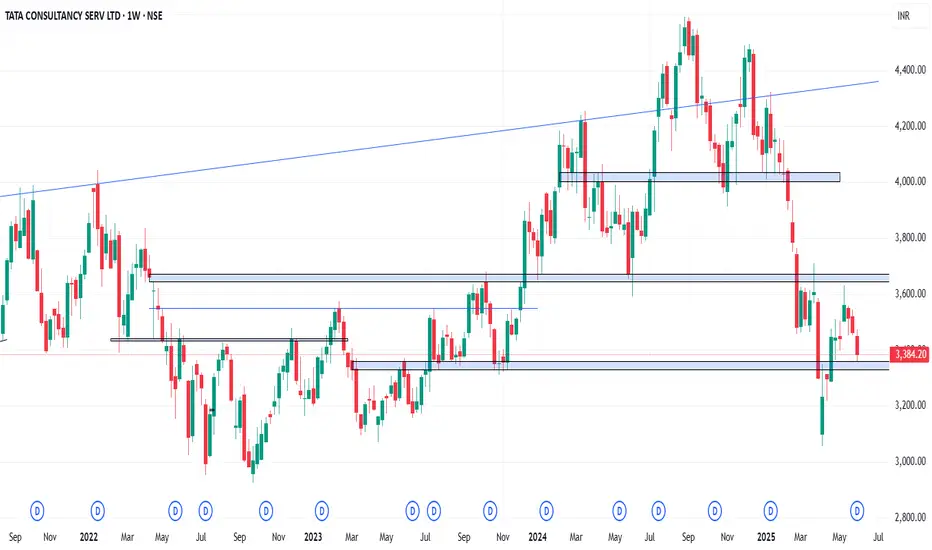
As long as TCS is below 3305, it is a value buying opportunity. As long as TCS is below 3305, it is a value buying opportunity. No need to panic. You are going to make money in India's number one IT company.
Trade ideas

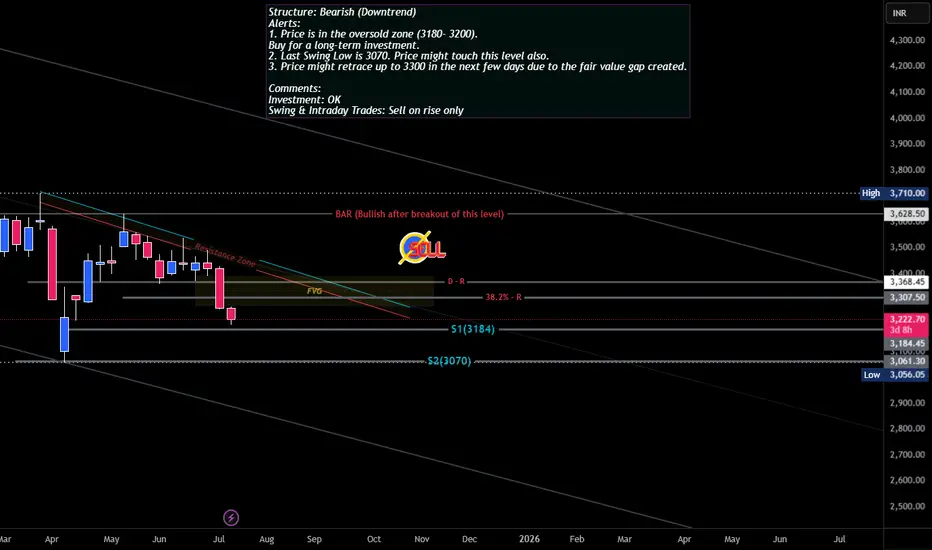
TCS Trade SetupStructure: Bearish (Downtrend)
Alerts:
1. Price is in the oversold zone (3180- 3200).
Buy for a long-term investment.
2. Last Swing Low is 3070. Price might touch this level also.
3. Price might retrace up to 3300 in the next few days due to the fair value gap created.
Comments:
Investment: OK
Swing & Intraday Trades: Sell on rise only
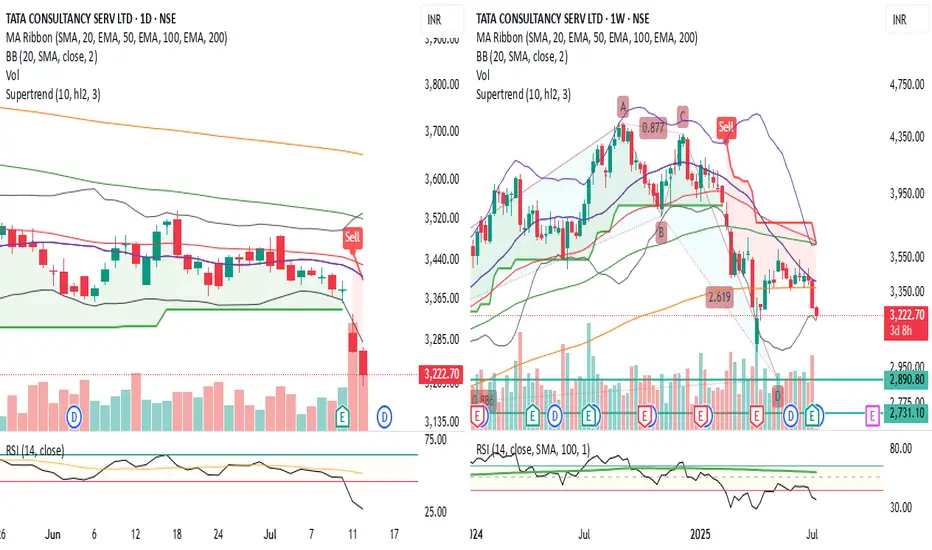
TCS BULLISH BAT formation or breakdown TCS seems to be forming bullish BAT pattern on weekly chart
RSI on daily and weekly below 40
Price below all major moving averages on daily and weekly
Price broke down 50 month EMA last week
Next Harmonic Support near 2890 - 2930 levels
Lets See How it Evolves.
Disclaimer: NOT A BUY / SELL RECOMMENDATION I am not an expert I just share interesting charts here for educational purpose and not to be taken as buy/sell recommendation. Please seek expert opinion before investing and trading as trading/ investing in market is subject to market risks. I do not hold any position in the stock as on date but I may look to take some position with my own Risk Reward matrix.
TCS breakdown ?TCS 2286 is showing signs of breakdown . Shorts could be considered below 3413.
Keep away from longs below 3413.
TCS No Need To Fear TCS No Need To Fear reason Behind
All Short position Are Reverse From VWAP
And Trend Change Here
This Gap Down Is Fixed
Vwap is 3299 which Indicating By Black Line On Charts

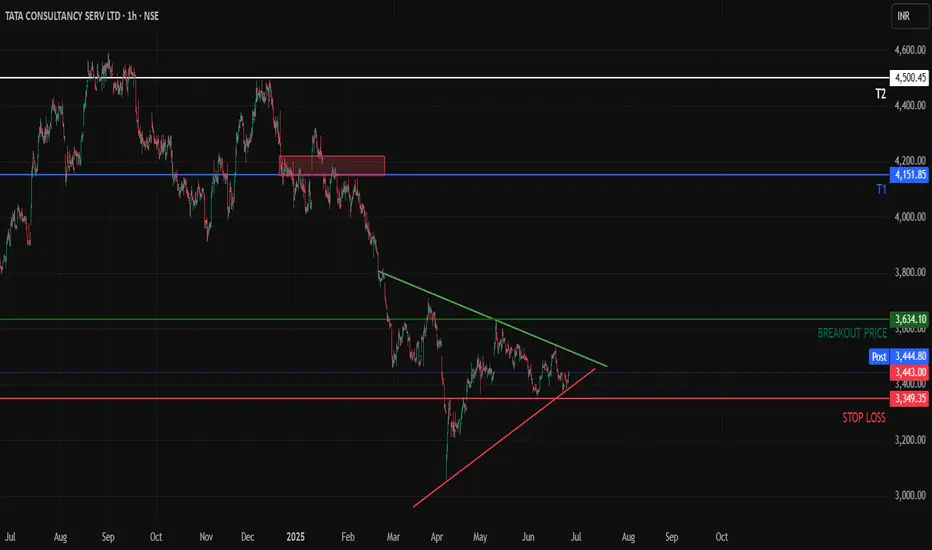
TCS - About to Break out of a consolidation Hello All,
Here is the 1H time frame of TCS which is making a triangle pattern with converging prices at the bottom its recent downtrend.
We can expect T1 once Breakout Price is reached and we get at least a 1H candle closing above the marked breakout price
Once the supply zone near T1 is cleared we can expect prices to hit T2 as well
Above T2, Sky is the Limit for TCS
TCS updated levels 3330-3320 support if comes then buy long termHow My Harmonic pattern projection Indicator work is explained below :
Recent High or Low :
D-0% is our recent low or high
Profit booking zone: D13% -D15% is
range if break them profit booking start on uptrend or downtrend but only profit booking, trend not changed
SL reversal zone : SL 23% and SL 25% is reversal zone if break then trend reverse and we can take reverse trade
Target : T1, T2, T3, T4 and .
Are our Target zone
TCS Eyes Rebound as Strong Support and Results AlignTopic Statement:
TCS is currently oversold, with upcoming quarterly results potentially driving a rebound from strong technical support levels.
Key Points:
* The stock retraced to the 50% Fibonacci level at 3060, aligning with the psychological barrier around 3000 that acted as strong support
* Price is now stuck at the 38.2% retracement level at 3421, indicating a key resistance zone to watch
* Trading below the 200-day EMA suggests the stock is oversold, offering a rare and attractive investment opportunity in TCS
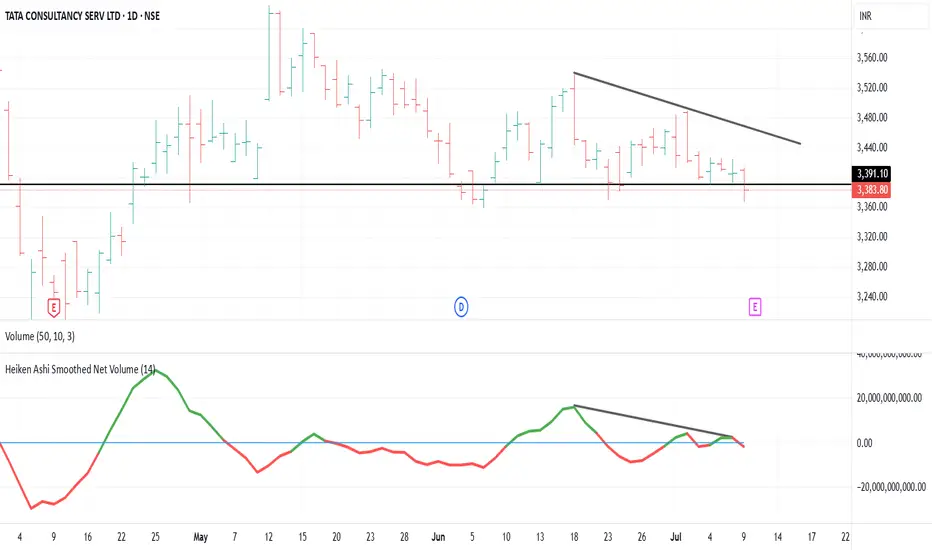
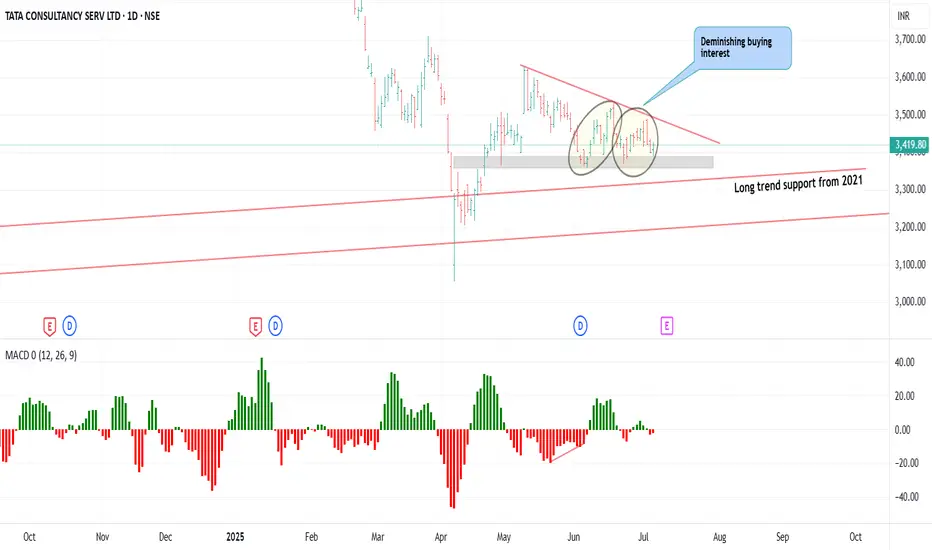
TCS descending triangle.. TCS 3419 is showing a descending triangle pattern.
Buying interest diminishing could be seen in the chart.
3480 is resistance and 3362 is support.
Signals suggest possible short weakness drop to support and then reverse to resistance
Day PCR is bearish at 0.74 while intraday at 2.34 suggests long buildup.
PUT premiums are higher than Call Premium suggests a shakeout is possible to trap the PUT writers.
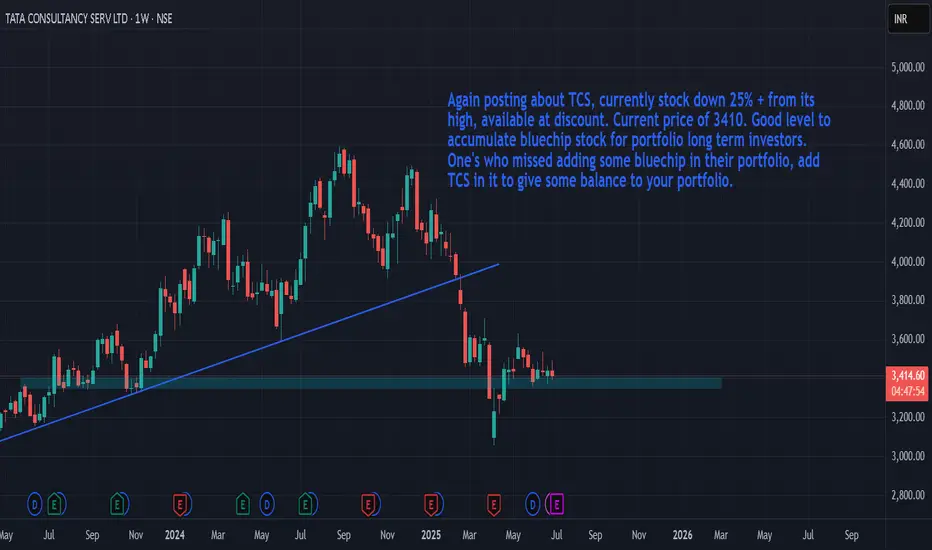
tcsAgain posting about TCS, currently stock down 25% + from its high, available at discount. Current price of 3410. Good level to accumulate bluechip stock for portfolio long term investors. One's who missed adding some bluechip in their portfolio, add TCS in it to give some balance to your portfolio.
(Not suggested/not recommended, just for educational purpose)
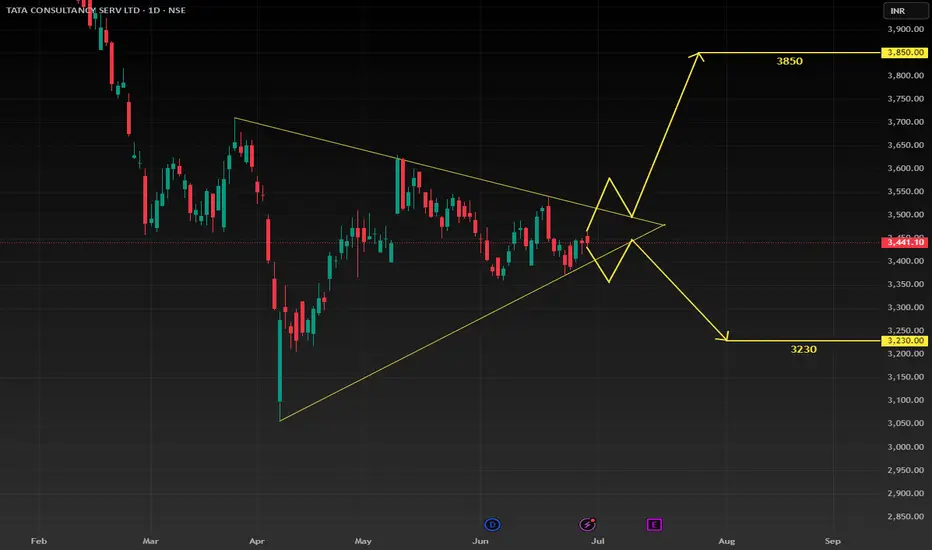
TCS nearing potential Breakout/Breakdown PointPrice of TCS is getting compressed into a triangle pattern and about to burst out on either side. So be watchful in the July 2025 month for the breakout/breakdown and plan your trade accordingly.
* Shared for the educational purpose only.
Will IT stocks survive? Infosys - TCSDo IT stocks like TCS, Infosys bounce back?
IT stocks are currently trading at about 30% less than their all time high. Showing signs of bounce but being sold out. To achieve the earlier high, IT stocks have to give 35%-40% profit.
Seems it may not move till financial results for current quarter proves good.
I was holding Infosys at Rs.1925. Since my last msg regarding Infosys, somehow I was not convinced on the price action and hence I posted that my call is invalid, as it fell down drastically and bounced to that level. So I sold at small profit and exited. Then it fell abt 30-40%.
Current situation - One side war, another side tariff, INR depreciation - all punching the stocks down.
To my opinion, its time for buying. I bought with confident that when I was ready to hold at Rs.1925, then why not at 1580 (30% down plus 3% money depreciation plus 4% inflation)? I missed to opportunity to buy at 1300 when it fell earlier.
For next two months, it will be on downside, and good to accumulate on every down of 5%.
As I earlier informed, Nifty range will be 23000-25000 for another 3-4 months. Breaking either side is a tough game, if do so may bounce back to this range soon.
Logic, all individuals and corporates have lot of government printed money (both US and India). To my opinion like gold, Nifty also may double in next 5 years. Same way, the stocks associated with Nifty (not all).
Above is for educational purpose only. Nothing is guaranteed. If announced bankrupt, you may loose all your money. Hence take call as per your study and analysis.
Happy Investing !!!

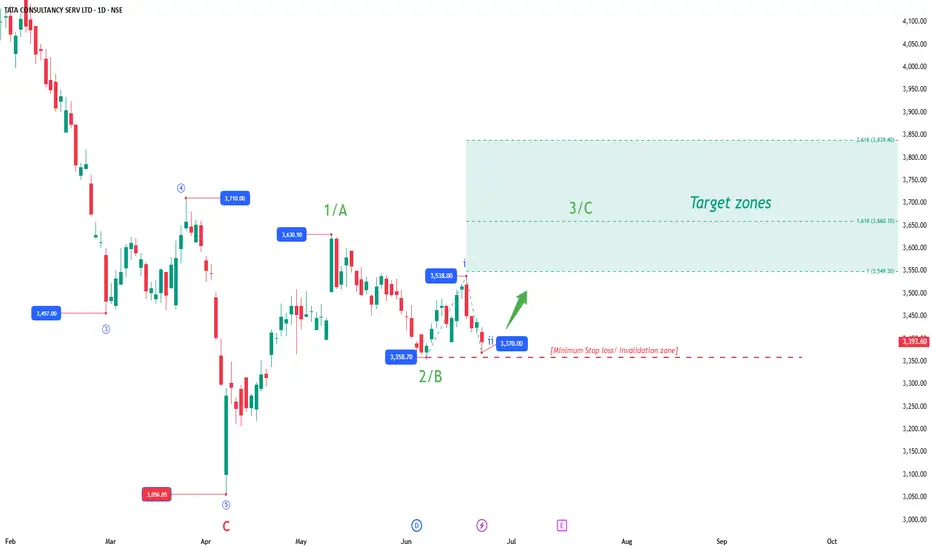
Low-Risk Entry Zones Emerging in TCS and CANARA BANKTCS - Potential Nested 1-2 / 1-2 Setup
After completing a higher-degree corrective phase, TCS has likely begun a new impulse sequence. The structure so far suggests a nested 1-2 / 1-2 setup:
Higher-degree Wave 1 peaked near 3630.50, followed by a corrective Wave 2 into 3358.70.
Inside the new sequence, minor wave i topped at 3538.00, with a minor wave ii correction down to 3370.00.
This leaves the door open for a sharp upside move if the structure unfolds as a Wave 3 acceleration phase. The invalidation for this scenario remains tight below 3358.70 . As long as price holds above this level, the nested setup remains intact with Fibonacci projection targets at:
3549 (1.0x)
3660 (1.618x)
3839 (2.618x)
Risk Management Note:
The tight invalidation allows for a favorable risk-reward profile. If price breaks below 3358.70, the nested count would be invalidated and a larger degree corrective structure may still be unfolding.
CANARA BANK - Impulse in Progress with Minor Wave 5 Pending
CANARA BANK presents a slightly different but equally interesting structure. Here, we observe a clean five-wave impulse unfolding from the March low of 78.60:
Major Wave 1: 95.19
Major Wave 2: 83.70 (deep but typical retracement)
Minor Wave 1: 102.63
Minor Wave 2: 90.95
Minor Wave 3: 119.30 (strong extension)
Minor Wave 4: 104.60 (respecting 50% retracement of Minor 3)
Price is now in the early stages of Minor Wave 5, which could complete the larger degree Wave 3. Fibonacci projections for the higher degree Wave 3 stand between 123.5 and 135.2.
Risk Management Note:
The invalidation for the immediate setup lies below 104.60. As long as this level holds, the path higher remains favored.
Summary:
Both TCS and CANARA BANK are showcasing clean Elliott Wave setups with well-defined invalidation zones. Traders following these patterns should monitor the invalidation levels closely, as failure to hold these zones will require a reassessment of the wave counts. However, while price respects these structures, the potential for sharp impulsive advances remains on the table.
Disclaimer: This analysis is for educational purposes only and does not constitute investment advice. Please do your own research (DYOR) before making any trading decisions.
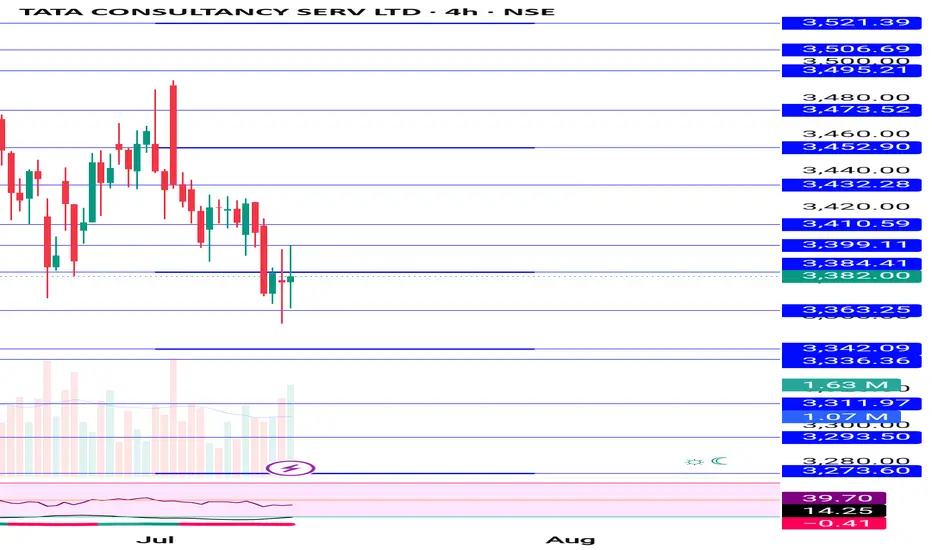
TCS LtdYou're watching TCS Ltd (60-min chart) for breakouts. Short below ₹3415. Consider confirmation signals (like volume), managing false breakouts, market context, and time of day for potentially stronger moves. Always prioritize risk management. Good luck!

TCS Strong Support at ₹3360 | Breakout Above ₹3700ata Consultancy Services (TCS) is showing strong support near ₹3360 levels. A potential breakout will be confirmed if the price sustains above ₹3700.
Currently, the stock is facing key resistance zones between ₹3512 and ₹3525. A successful close above these levels may lead to strong bullish momentum.
📌 Key Levels:
Support: ₹3360
Resistance Zones: ₹3512 – ₹3525
Breakout Confirmation: Above ₹3700
Traders should watch these levels closely for directional cues. Volume confirmation and price action around resistance will be crucial.
#TCS #TCSshare #NSEStocks #StockAnalysis #BreakoutStocks #TradingViewIndia #TCSBreakout #IndianStocks #TechnicalAnalysis #SwingTrade
🔔 Disclaimer:
This analysis is for educational and informational purposes only. It is not a buy or sell recommendation. Please do your own research or consult a financial advisor before making any trading decisions. Trading and investing involve risk.
Advanced Institutions Option Trading - Part 7Time Decay (Theta) Strategies
Options lose value over time due to Theta Decay.
Strategies to Take Advantage of Theta:
Selling options (Covered Calls, Naked Puts)
Calendar Spreads
Iron Butterflies
Caution:
Theta decay accelerates as expiry nears. Option sellers must hedge their deltas to stay safe.
Risk Management in Options
Institutions and pro traders always focus on capital protection.
🔐 Techniques:
Position sizing (no more than 2-3% risk per trade)
Hedging with opposite legs or underlying
Stop-loss on premium or delta exposure
Use of Greeks for real-time adjustment
Risk management > Strategy in the long run.

TCSTCS cmp - 3481.90
Buying & accumulating TCS at current levels will be considered as a good level. Nifty consolidating around the 25,000, a potential breakout above this level could be led by strength in the IT sector — with TCS likely to be a key contributor to that momentum.
{Not a recommendation, just for an educational purpose}

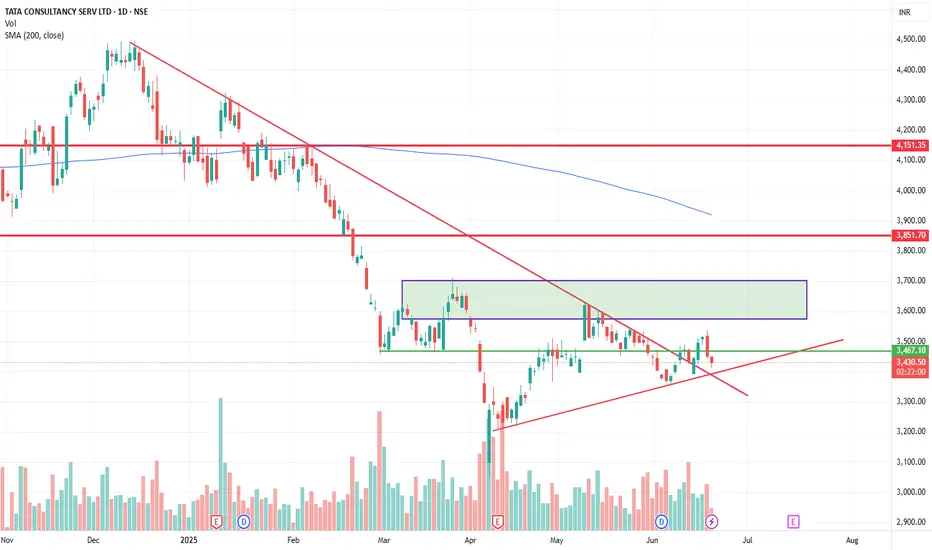
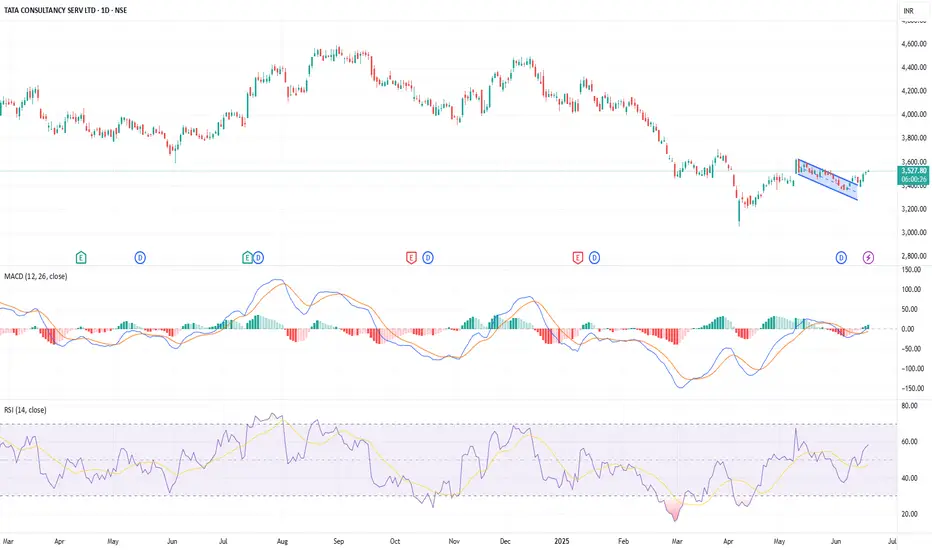
TCS – Technical Highlights (Daily Chart)Breakout from a bullish falling wedge pattern and retesting the same breakout zone gives confidence of positive reversal probably. MACD crossover with rising histogram indicates strong momentum. RSI at 58.58, rising with room for further upside. Price sustaining above the wedge confirms breakout strength. Overall setup suggests a positive short-term trend continuation.
This is just for educational purpose and I am not giving any recommendation or target for TCS.
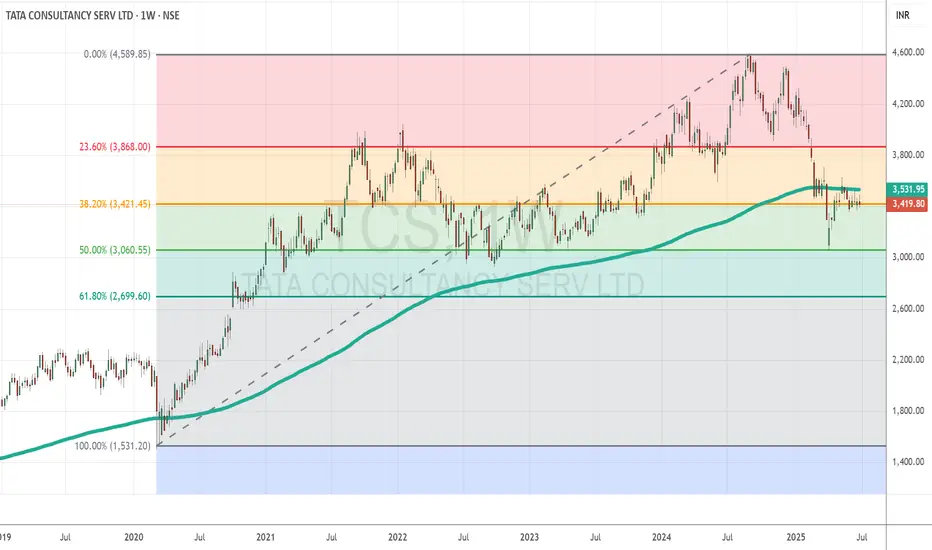
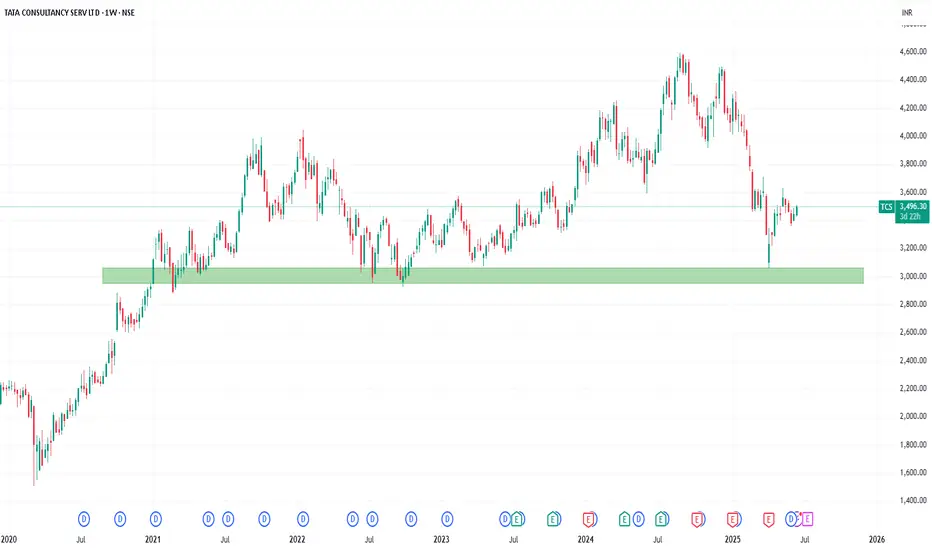
TCS Ltd. – Riding the Wave from a Strong Support Base📊Technical Overview
TCS has consistently traded above ₹3,000 since 2021, with this level serving repeatedly as a robust support zone.
The stock reached an all-time high of ₹4,592 in August 2024.
Given strong year-on-year financial performance and support at ₹3,000, TCS currently trades at ₹3,500.
As long as the ₹2,900–₹3,050 support zone holds, the stock has potential to rise to:
🎯Target 1: ₹3,800
🎯Target 2: ₹4,200
🎯Target 3: ₹4,600(All-time high)
A breakdown below the zone would negate the bullish thesis.
💰FY24 Key Financial Highlights (vs FY23 & FY22)
Total Income: ₹255,324 Cr (vs ₹240,893 Cr; ₹225,458 Cr)
Total Expenses: ₹187,917 Cr (vs ₹176,597 Cr; ₹166,199 Cr)
Financing Profit: ₹67,407 Cr (vs ₹64,296 Cr; ₹59,259 Cr)
Profit Before Tax: ₹65,331 Cr (vs ₹61,997 Cr; ₹56,907 Cr)
Profit After Tax: ₹48,797 Cr (vs ₹46,099 Cr; ₹42,303 Cr)
Diluted Normalized EPS: ₹134.20 (vs ₹126.88; ₹115.19)
All parameters show strong YoY growth, emphasizing TCS’s consistent scale-up and profitability.
🧠Fundamental Insights
TCS crossed $30 bn in annual revenue, with a strong order book of $42.7 bn, including a record Q4 TCV of $13.2 bn
FY24 revenue rose 4.1% YoY (CC +3.4%), with net income up 7.8% YoY. Q4 margins were strong with operating at 24.6% and net at 19.3%
TCS declared a ₹30 final dividend and a combined FY25 dividend of ₹96/share (₹66 special + ₹30 final), rewarding shareholders with ~4.5% yield
Quarterly profit slipped 1.7% YoY to ₹12,224 Cr due to global headwinds, but revenue still rose 5.3%, backed by strong deal wins worth $12.2 bn (Q4) and $39.4 bn (full year) .
Continued investment in AI, digital innovation, and a strong cash flow (over $5.3 bn free cash flow in FY24) support long-term growth outlook .
🧭Conclusion
TCS remains fundamentally strong with robust growth in revenues, profits, and cash generation. Technically, it is maintaining a firm base above ₹3,000, setting the stage for a potential upside toward ₹3,800 → ₹4,200 → ₹4,600. The key is to watch for sustained support at ₹3,000–₹3,050.
Disclaimer: lnkd.in
TCS Ltd. – Riding the Wave from a Strong Support Base📊 Technical Overview
TCS has consistently traded above ₹3,000 since 2021, with this level serving repeatedly as a robust support zone.
The stock reached an all-time high of ₹4,592 in August 2024.
Given strong year-on-year financial performance and support at ₹3,000, TCS currently trades at ₹3,500.
As long as the ₹2,900–₹3,050 support zone holds, the stock has potential to rise to:
🎯 Target 1: ₹3,800
🎯 Target 2: ₹4,200
🎯 Target 3: ₹4,600(All-time high)
A breakdown below the zone would negate the bullish thesis.
💰 FY24 Key Financial Highlights (vs FY23 & FY22)
Total Income: ₹255,324 Cr (vs ₹240,893 Cr; ₹225,458 Cr)
Total Expenses: ₹187,917 Cr (vs ₹176,597 Cr; ₹166,199 Cr)
Financing Profit: ₹67,407 Cr (vs ₹64,296 Cr; ₹59,259 Cr)
Profit Before Tax: ₹65,331 Cr (vs ₹61,997 Cr; ₹56,907 Cr)
Profit After Tax: ₹48,797 Cr (vs ₹46,099 Cr; ₹42,303 Cr)
Diluted Normalized EPS: ₹134.20 (vs ₹126.88; ₹115.19)
All parameters show strong YoY growth, emphasizing TCS’s consistent scale-up and profitability.
🧠 Fundamental Insights
TCS crossed $30 bn in annual revenue, with a strong order book of $42.7 bn, including a record Q4 TCV of $13.2 bn
FY24 revenue rose 4.1% YoY (CC +3.4%), with net income up 7.8% YoY. Q4 margins were strong with operating at 24.6% and net at 19.3%
TCS declared a ₹30 final dividend and a combined FY25 dividend of ₹96/share (₹66 special + ₹30 final), rewarding shareholders with ~4.5% yield
Quarterly profit slipped 1.7% YoY to ₹12,224 Cr due to global headwinds, but revenue still rose 5.3%, backed by strong deal wins worth $12.2 bn (Q4) and $39.4 bn (full year) .
Continued investment in AI, digital innovation, and a strong cash flow (over $5.3 bn free cash flow in FY24) support long-term growth outlook .
🧭 Conclusion
TCS remains fundamentally strong with robust growth in revenues, profits, and cash generation. Technically, it is maintaining a firm base above ₹3,000, setting the stage for a potential upside toward ₹3,800 → ₹4,200 → ₹4,600. The key is to watch for sustained support at ₹3,000–₹3,050.
⚠️ Disclaimer
This report is for educational purposes only and does not constitute investment advice. Please consult a financial advisor before making any investment decisions.
Institution Option Trading Part-3How Option Database Trading Works (Step-by-Step)
Step 1: Data Collection
Real-time data from NSE, BSE, CBOE, or broker APIs (Zerodha, Interactive Brokers, etc.).
Store tick-level or EOD snapshots into SQL/NoSQL databases.
Step 2: Data Cleaning & Normalization
Remove missing values, align timestamps, convert formats.
Normalize values like IV to make models consistent.
Step 3: Exploratory Data Analysis (EDA)
Use Python (Pandas, Matplotlib) or R to analyze:
Option volume spikes
Volatility contraction/expansion
Unusual OI build-ups
Step 4: Backtesting Trading Strategies
Strategies like Straddle, Strangle, Iron Condor, or IV Crush are tested.
Entry/exit logic coded, and trades simulated on historical data.
Step 5: Deploying Models
Successful strategies get automated using APIs or Trading Bots.
Regular performance metrics tracked and refined.

Learn Institutional options trading Part-1Tools & Data for Option Traders
Tools to Use:
Option Chain Analysis (NSE Website)
Open Interest Charts (OI Analysis)
IV vs HV Charts (Volatility Tools)
PCR (Put Call Ratio) Indicators
FII/DII Activity Monitoring
TradingView, Sensibull, Opstra, StockMock

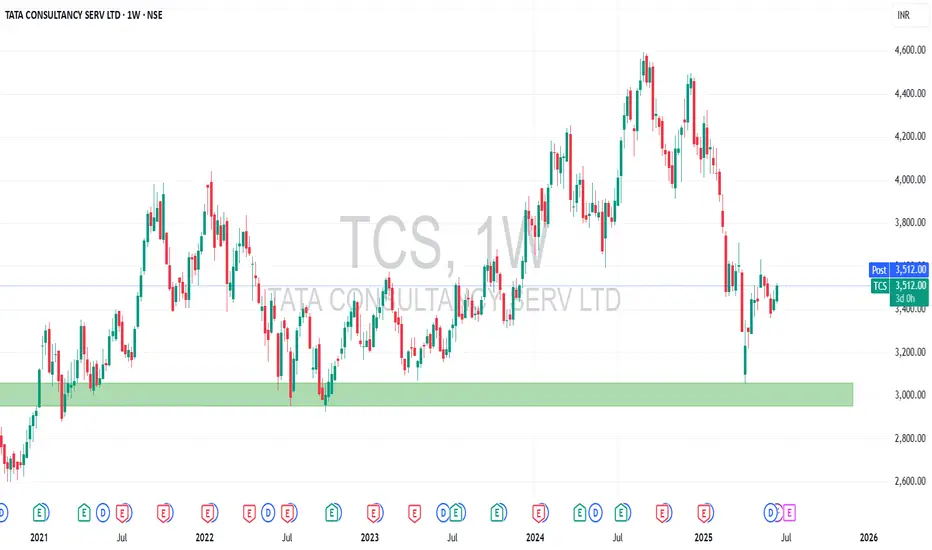
TCS - Weekly AnalysisIn the Weekly Chart of TCS ,
we can see that, it has come to test support.
Let it test properly and then we can make a trade plan.