What does the chart of TCS say and how will it move after June 4Here is a **detailed business model script** for **Tata Consultancy Services (TCS)**, one of the world’s largest IT services companies. It follows a structured format ideal for reports, presentations, or strategic overviews.
---
### 📘 **TCS – Detailed Business Model Script**
---
#### 🎯 **1. Introduction**
Tata Consultancy Services (TCS), a part of the Tata Group, is a global leader in IT services, consulting, and business solutions. Headquartered in Mumbai, India, and operating in over 50 countries, TCS delivers IT-enabled services to clients across multiple industries, helping them digitally transform their operations.
---
#### 🧩 **2. Value Proposition**
* **Digital Transformation:** Enabling enterprises to adopt AI, cloud, analytics, IoT, and blockchain.
* **Operational Efficiency:** Outsourcing IT operations to reduce cost and improve agility.
* **Innovation at Scale:** Offering domain-specific platforms and IP-driven solutions.
* **Global Delivery Excellence:** Leveraging the Global Network Delivery Model (GNDM™) for consistent, high-quality services.
---
#### 🏗️ **3. Key Business Segments**
**A. IT Services & Consulting**
* Application Development & Maintenance (ADM)
* Infrastructure Services
* Enterprise Solutions (ERP, CRM, etc.)
* Cybersecurity
* Quality Engineering
**B. Digital & Cloud Services**
* Cloud migration, cloud-native development
* Data analytics and AI/ML services
* Intelligent automation and RPA
* Internet of Things (IoT)
* Blockchain applications
**C. Platforms & Products**
* **Ignio (AI/ML Ops)**
* **TCS BaNCS** (for financial institutions)
* **TCS MasterCraft** (for DevOps and delivery automation)
* **TCS ADD** (for life sciences R\&D)
**D. Industry-Specific Services**
* Banking & Financial Services
* Retail & Consumer Goods
* Manufacturing
* Communications & Media
* Healthcare & Life Sciences
* Energy, Utilities & Resources
---
#### 🔗 **4. Key Partnerships**
* **Technology Partners:** Microsoft, AWS, Google Cloud, SAP, Oracle, IBM
* **Academic Institutions:** For research and talent development
* **Startups & Innovators:** Through TCS Co-Innovation Network (COIN™)
---
#### 🛠️ **5. Revenue Model**
TCS earns revenue through:
1. **Time & Material (T\&M):** Billing based on effort hours
2. **Fixed-Price Projects:** Deliverables and budgets are pre-agreed
3. **Managed Services:** Long-term outsourcing contracts
4. **Subscription-Based Models:** For platforms like BaNCS
5. **Consulting Fees:** Strategy and transformation advisory services
---
#### 🌐 **6. Geographic Footprint**
* **North America (50%+ of revenue)**
* **Europe & UK**
* **India**
* **Asia Pacific, Middle East & Africa (MEA)**
* Delivery centers in India, LATAM, Europe, and Asia
---
#### 🧱 **7. Key Resources**
* Global workforce (over 600,000 employees)
* Intellectual Property and proprietary platforms
* Global Network Delivery Model (GNDM™)
* R\&D labs and innovation centers
* Brand equity of Tata Group
---
#### 🔄 **8. Key Activities**
* Application development and support
* System integration and implementation
* Cloud and digital transformation
* Business process outsourcing
* Co-innovation with customers
---
#### 👥 **9. Customer Segments**
* Large enterprises (Fortune 500)
* Government and public sector
* Financial institutions
* Retailers and manufacturers
* Healthcare providers
---
#### 📞 **10. Channels**
* Direct enterprise sales
* Consulting engagements
* Online marketing and digital channels
* Strategic alliances and partnerships
* TCS COIN™ and Innovation Hubs
---
#### 🤝 **11. Customer Relationships**
* Long-term IT outsourcing contracts
* Dedicated account managers
* Co-innovation partnerships
* Custom-built delivery teams
* 24/7 global support
---
#### 💰 **12. Cost Structure**
* Employee compensation and training
* Infrastructure and delivery centers
* R\&D and IP development
* Sales and marketing expenses
* Regulatory and compliance costs
---
#### 📈 **13. Competitive Advantages**
* **Global Delivery Excellence:** Seamless execution across geographies
* **Scale & Talent:** Largest IT workforce globally
* **Strong Financials:** High profit margins, low debt
* **IP & Platforms:** Differentiated service offerings
* **Trusted Brand:** Part of the Tata conglomerate
---
#### 🧭 **14. Future Strategy**
* Strengthen presence in AI and GenAI solutions
* Expand platform-based services
* Grow in high-margin digital services
* Invest in sustainable and green IT practices
* Build deeper client partnerships in non-traditional markets
---
### 📊 Summary (Business Model Canvas Snapshot)
| Key Partners | Key Activities | Value Propositions | Customer Relationships | Customer Segments |
| --------------------------------- | -------------------------------------------------- | ------------------------------------------------ | ----------------------------------------- | ----------------------------------------------------------------- |
| Tech Partners, Academia, Startups | IT Services, Digital Innovation, Cloud, Consulting | Cost Savings, Innovation, Digital Transformation | Long-Term Managed Services, Co-Innovation | Enterprises across BFSI, Retail, Manufacturing, Healthcare, Govt. |
| Key Resources | Channels | Cost Structure | Revenue Streams |
| ---------------------------------------------- | ------------------------------- | ------------------------------- | ---------------------------------------- |
| Talent, IP, Platforms, Delivery Infrastructure | Direct Sales, Alliances, Online | Workforce, Infrastructure, R\&D | T\&M, Fixed Price, Platforms, Consulting |
---
Thanks & Regards
Mohinder Singh
The Golden Farms of Equity
Trade ideas

Database Trading **Database trading**, often referred to as **algorithmic trading** or **quantitative trading**, involves using large sets of structured data to make trading decisions and execute trades automatically. It relies heavily on databases to store, process, and analyze market data (historical prices, volumes, order books, etc.) and other relevant information (like economic indicators, news, etc.). The goal is to identify patterns, trends, or anomalies that can be leveraged for profitable trading strategies.

PCR Trading part 2In the context of trading, PCR stands for Put-Call Ratio. It's a technical indicator used to assess market sentiment, specifically in the options market. The PCR is calculated by dividing the volume (or open interest) of put options by the volume (or open interest) of call options over a specific period.

PCR Trading part 1PCR trading refers to using the Put-Call Ratio (PCR) indicator to assess market sentiment and potentially predict future price movements. It's a contrarian indicator, meaning it suggests trading against the prevailing market sentiment. For example, a high PCR (suggesting a bearish market) might signal an opportunity to buy, as the market might be over-sold.

What is Divergence?In technical trading, divergence refers to when an asset's price and a technical indicator move in opposite directions. This discrepancy can signal a potential trend reversal or a weakening trend, prompting traders to consider a change in the direction of their trades.

Expecting a Breakout in TCS Hold maximum you can expect minimum 100-150 points in a weeks time ....Fundamentally a good stock to buy
TCS Share Projection As of May 2025, Tata Consultancy Services (TCS) is led by a seasoned management team with extensive experience in the IT services and consulting industry. Here's an overview of the key executives:
🏢 TCS Executive Leadership
K. Krithivasan – Chief Executive Officer & Managing Director
Appointed CEO & MD on June 1, 2023, K. Krithivasan has been with TCS since 1989. He previously led the Banking, Financial Services, and Insurance (BFSI) vertical, steering TCS's expansion into high-growth markets such as Latin America, Australia, and New Zealand. Under his leadership, TCS has focused on customer centricity and employee empathy, contributing to a $2 billion rise in brand value and recognition as a Global Top Employer.
Goodreturns
+9
Tata Consultancy Services
+9
Tata Consultancy Services
+9
Aarthi Subramanian – Executive Director, President & Chief Operating Officer
Aarthi Subramanian serves as the Executive Director – President and Chief Operating Officer of TCS. With over three decades at TCS, she has held various leadership roles, including Group Chief Digital Officer at Tata Sons. She has been instrumental in driving digital transformation across the Tata Group and has been recognized for her contributions to technology and innovation.
Goodreturns
+2
Tata Consultancy Services
+2
Tata Consultancy Services
+2
Natarajan Chandrasekaran – Chairman
Natarajan Chandrasekaran, also known as Chandra, is the Chairman of Tata Sons, the holding company of the Tata Group, including TCS. He joined the Board of Tata Sons in October 2016 and was appointed Chairman in January 2017. Chandra also chairs the Boards of several Tata Group operating companies.
Wikipedia
+3
Tata Consultancy Services
+3
Financial Times
+3
📊 Board of Directors (Selected Members)
Dr. Pradeep Kumar Khosla – Independent Non-Executive Director
Hanne Birgitte Breinbjerg Sorensen – Independent Non-Executive Director
Sanjay V. Bhandarkar – Independent Non-Executive Director
Keki M. Mistry – Independent Non-Executive Director
O. P. Bhatt – Independent Non-Executive Director
Tata Consultancy Services
+1
Goodreturns
+1
These board members bring diverse expertise from various industries, contributing to TCS's strategic direction.
Tata Consultancy Services
🌐 Senior Leadership Team (Selected Executives)
Krishnan Ramanujam – President, Consumer Business Group
Amit Bajaj – President, TCS North America
Debashis Ghosh – Business Head
Narasimhan Srinivasan – Vice President
Sudhakar Gudala – VP - Global Head, CPG & Distribution Business Unit
Craft.co
Tata Consultancy Services
Comparably
+1
Tata Consultancy Services
+1
These executives oversee various business units and regions, driving TCS's growth and innovation across global markets.
For more detailed information about TCS's leadership and organizational structure, you can visit their official leadership page on TCS Website
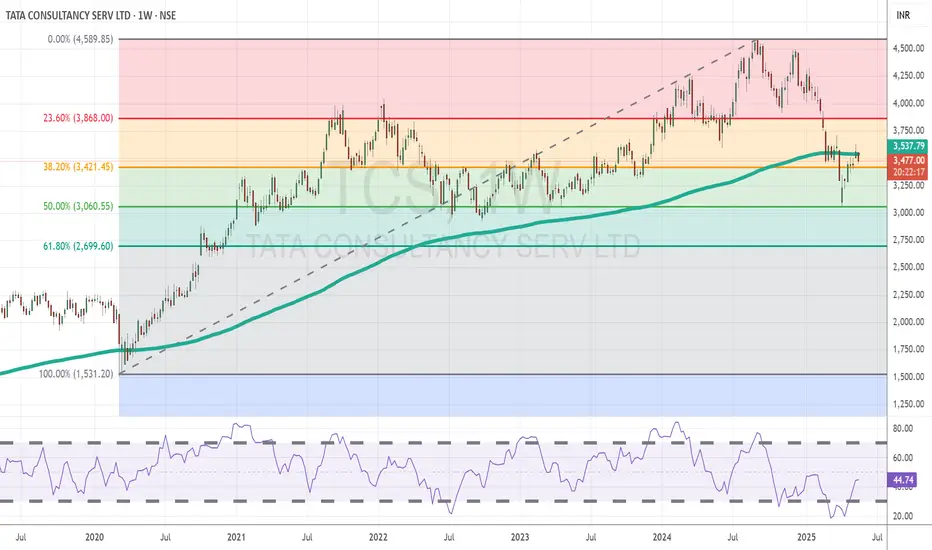
TCS Eyes Recovery After Holding Strong at Key Support LevelsTopic Statement:
TCS has shown signs of recovery after a recent correction, with strong technical support levels reinforcing bullish potential.
Key Points:
The price previously found strong and consistent support near the ₹3000 mark, reaffirmed during the recent market correction.
A full retracement to the 50% Fibonacci level** at ₹3060 attracted significant buying interest, highlighting renewed strength.
Currently, the stock trades just below the 200-day EMA, indicating it remains in oversold territory, but with potential for reversal if momentum continues.
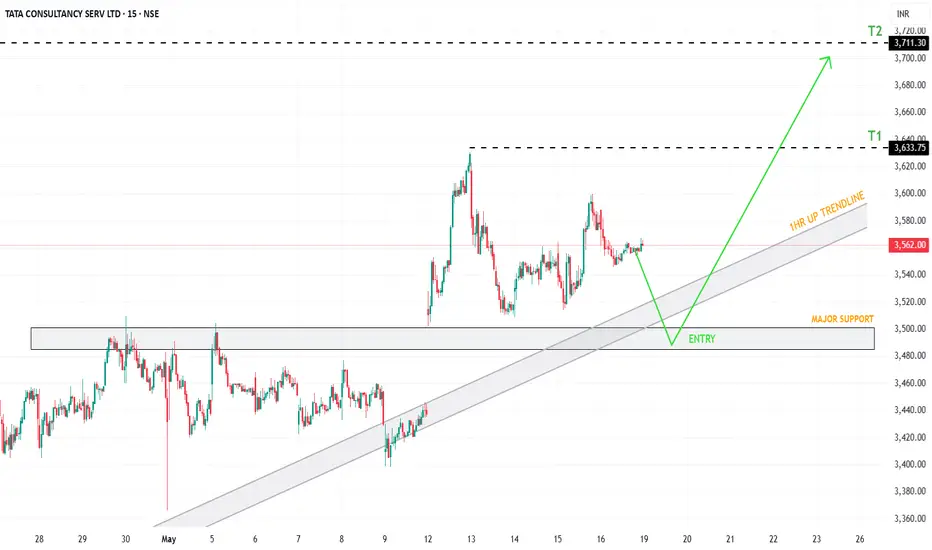
TCS | 15 min Idea – 18 May 2025 | BTST / SWING 📌 TCS | 15 min Idea – 18 May 2025
Bias: Bullish above trend-line
CMP: ₹3,562
Market Structure
• Higher-lows forming along 1HR trendline; price holding above 200 EMA cluster
• Sideways consolidation above ₹3,520 – potential breakout setup forming
Levels
│ R1 ₹3,633 │ R2 ₹3,711
│ S1 ₹3,520 │ S2 ₹3,490
Trade Plan
🟢 Breakout Long → Entry on 15‑min close > ₹3,633
Targets ₹3,685 / ₹3,711 | SL ₹3,600
🟢 Pullback Long → Buy ₹3,500–₹3,520 zone on bullish 15‑min candle
Targets ₹3,600 / ₹3,633 | SL ₹3,485
🔴 Breakdown Short → Entry on 15‑min close < ₹3,490
Targets ₹3,460 / ₹3,430 | SL ₹3,510
Notes
• ₹3,520–500 zone = strong support with trendline + EMA confluence
• Break above ₹3,633 can unleash momentum toward ₹3,700+ swing level
Set TradingView alerts at ₹3,633 & ₹3,490; manage risk ≤ 1% per trade.
#PriceAction #TCS #15min #GLOBALTRADESECURITIES
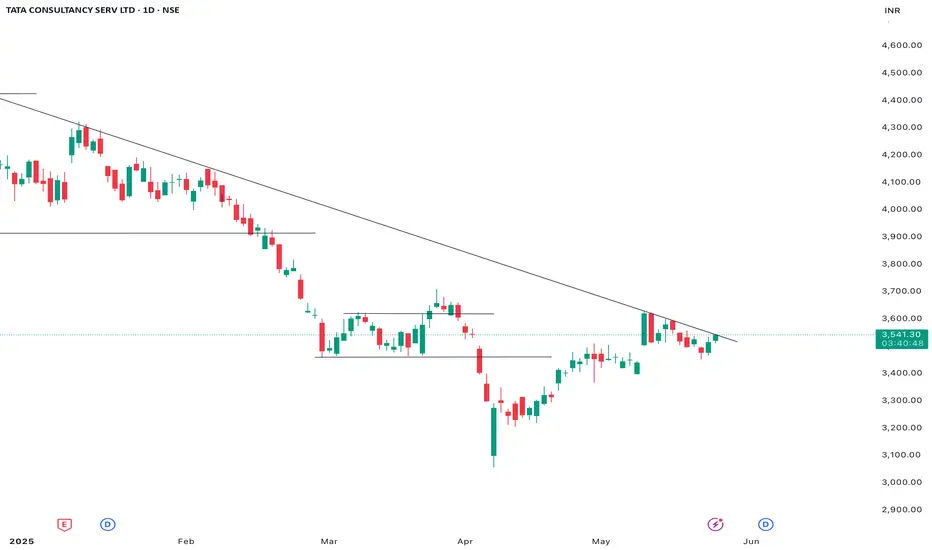
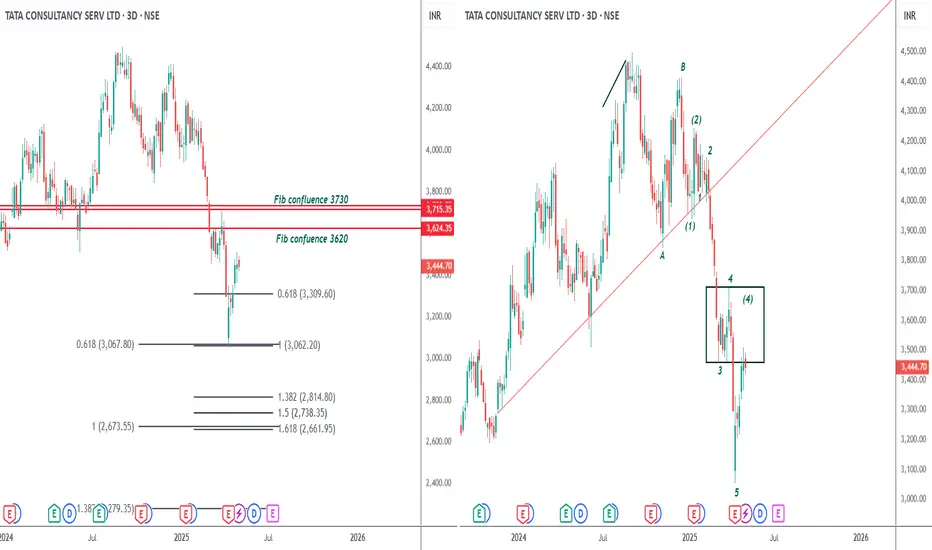
Fall still not overTCS CMP 3444
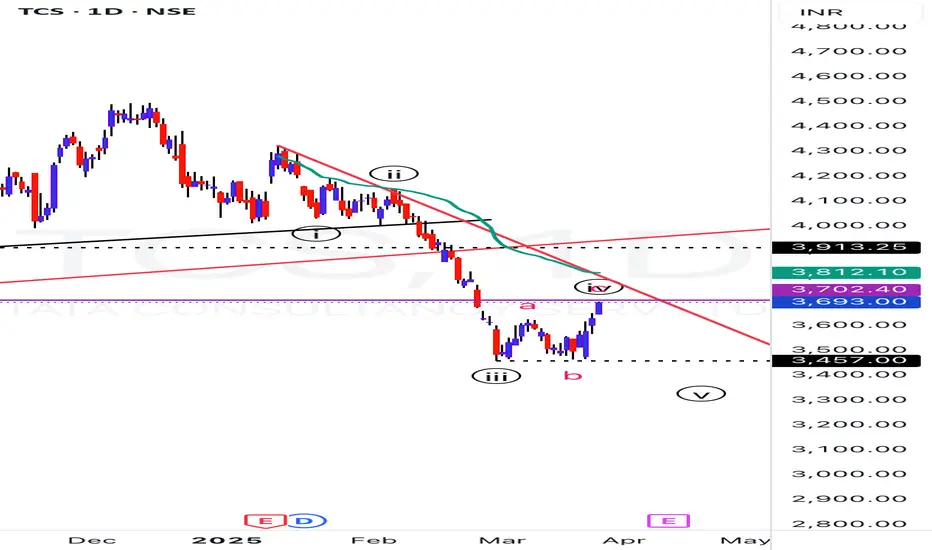
Elliott - The 4th waves tend to cluster together. I have put a box around the 4th wave. Hence the current zone to 3730 is where this rally should fizzle. The 5th wave should start post that.
Fibs Even the Fib confluence is confirming a max rally to 3730. The first tgt is back to the lows at 3060. the second tgt is at 2670. Both these zones are fib confluence zones and are a high prob tgts.
Conclusion - The fall is still not over. So will suggest to be on the sidelines. The stock can turn from anywhere from the current zone to max of 3730.
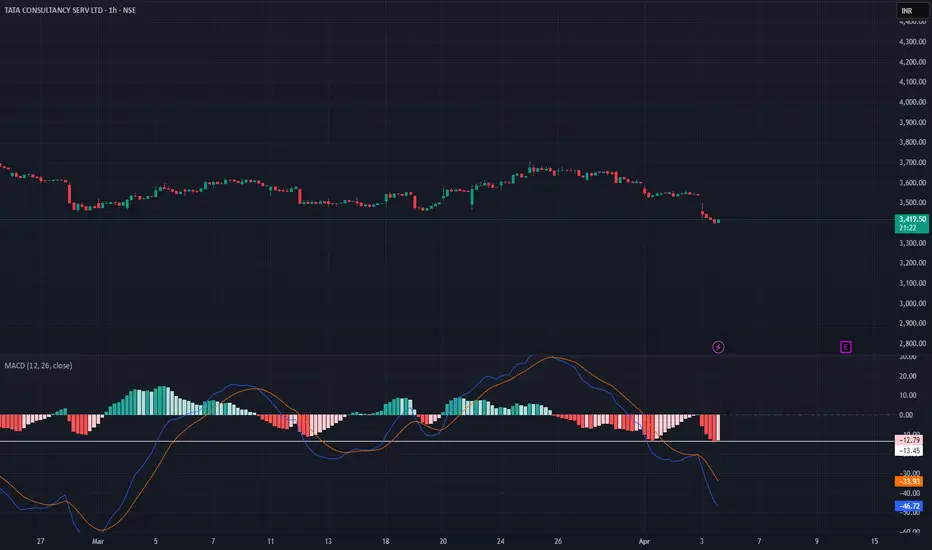
TIME TO BUY OR WAITMACD line: -47.04, Signal line: -34.00 — massive divergence = strong downward momentum
Histogram still expanding — no sign of slowing bearish pressure yet
Price is not diverging from MACD yet = no reversal setup
This is not a buy-the-dip yet
This zone (₹3,380–3,400) is previous support from Dec/Jan, so we’re testing an old demand zone
wait and watch
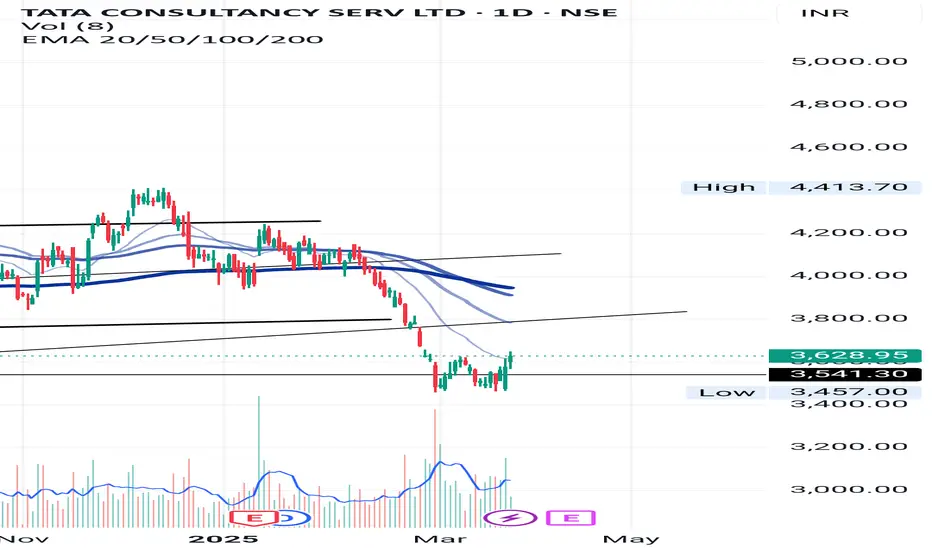
TCS No any Resistance up to 15% . 28/02/2025NSE INDIA, Symbol : TCS Timeframe : Daily. TCS 28/02/2025 I was predicted TCS Break down good support line then next support 3600 .TCS down fouls her marked target 3600 below. Today TCS is above 3600 , taking the lower support of the marked is a good support level and the resistance on the upside is above 20%. Therefore, a strong UP bounce back move in TCS will be recommended.

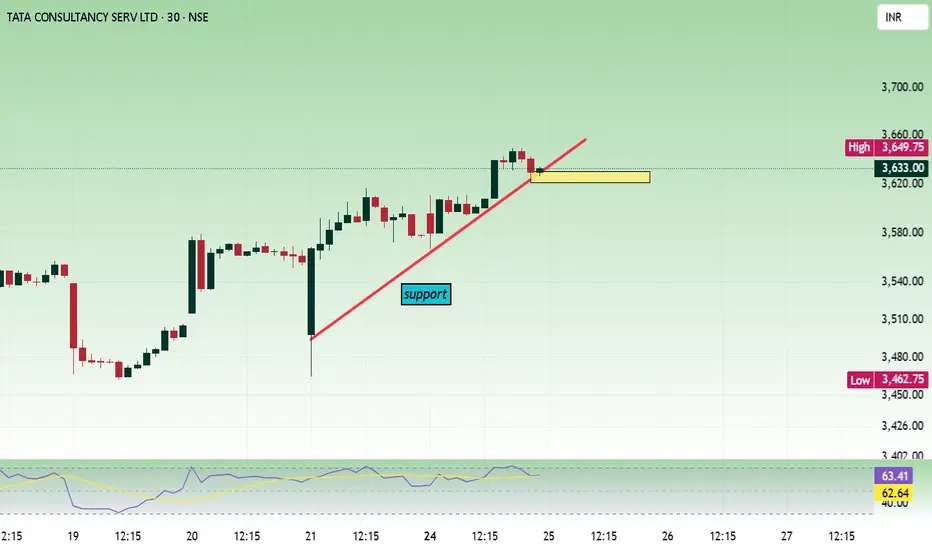
TCSPrice is at trend line support. Sustaining above 3600 is important to be bullish.
Buy above 3625 with the stop loss of 3602 for the targets 3646, 3668, 3690, 3704 and 3730.
Sell below 3580 with the stop loss of 3600 for the targets 3560, 3530, 3504, 3488 and 3472.
Always do your own analysis before taking any trade.
TCS - One more Low is due?The wave counts suggests that one more low is due on TCS.. but price actions suggests that double bottom breakout and W pattern formation in play.. let’s see what’s in store
TCS with W pattern Seems like, IT stocks creating W pattern. More focus on TCS as it gives very good divident too. It is creating W pattern with very good old support. One can buy for long term considering its divident.
Database Trading# **Database Trading**
Database trading leverages **historical market data, AI, and quantitative analysis** to identify high-probability trade setups.
✅ **Data-Driven Approach:** Uses past price action, volume, and indicators.
✅ **Backtesting & Optimization:** Tests strategies on historical data for accuracy.
✅ **Automated Execution:** Uses algorithms for fast, precise trading decisions.
### **Conclusion**
This method enhances **consistency, precision, and risk management**, making trading more systematic and efficient. 🚀

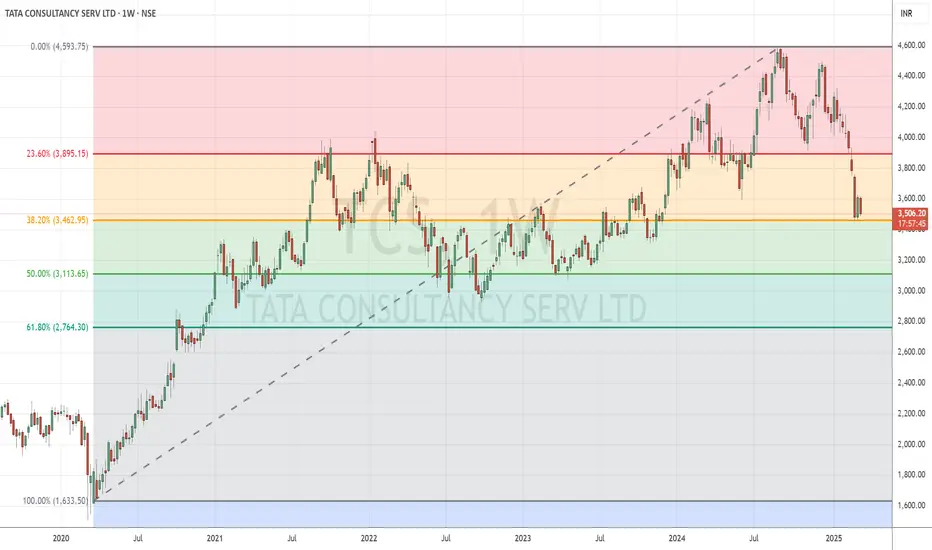
TCS Approaches Strong Support Amid Severe CorrectionTopic Statement:
TCS has seen a sharp correction in recent months, with the stock finding support at the 3500 level while trading below the 180-day EMA, indicating oversold conditions, further confirmed by a highly oversold weekly MFI.
Key points:
- Stock takes support at the 38.2% retracement level
- Price is below the 180-day EMA, marking it as oversold
- Weekly MFI is at 18, indicating the stock is highly oversold
what is MACD trading ?# **What is MACD Trading?**
MACD (**Moving Average Convergence Divergence**) is a trend-following momentum indicator used to identify **trend direction, strength, and potential reversals**.
## **1️⃣ Key MACD Components**
✅ **MACD Line:** Difference between the **12-day & 26-day EMA**.
✅ **Signal Line:** **9-day EMA** of the MACD line (triggers buy/sell signals).
✅ **Histogram:** Measures distance between MACD & Signal Line (momentum strength).
## **2️⃣ How to Trade with MACD**
✅ **MACD Crossover:**
🔹 **Bullish:** MACD crosses above Signal Line → **Buy signal**.
🔹 **Bearish:** MACD crosses below Signal Line → **Sell signal**.
✅ **MACD Divergence:**
🔹 **Bullish:** Price makes **lower lows**, MACD makes **higher lows** → **Uptrend reversal**.
🔹 **Bearish:** Price makes **higher highs**, MACD makes **lower highs** → **Downtrend reversal**.
### **Conclusion**
MACD is a **powerful tool for trend confirmation and momentum analysis**. Using it with **support-resistance and volume** increases trade accuracy. 🚀

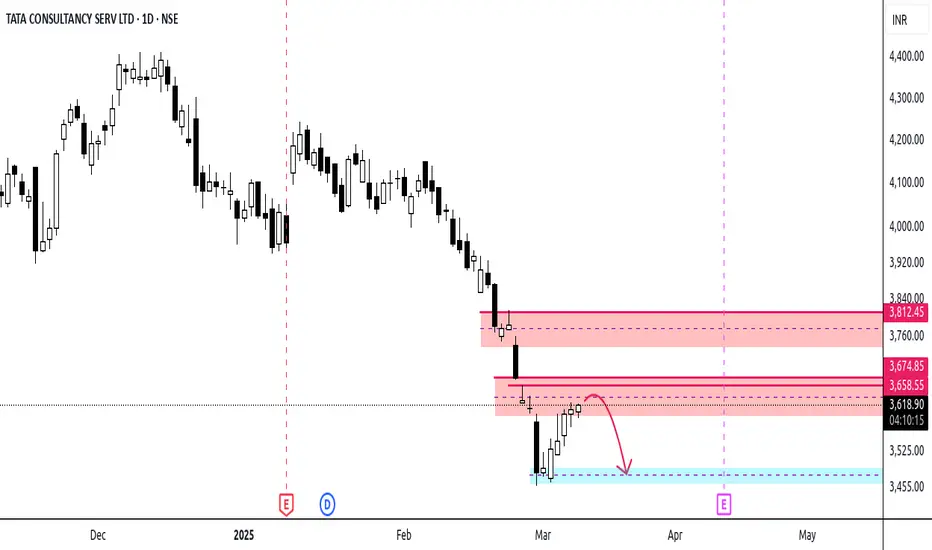
TCS | To Bleed MoreFrom the Highs of 4400s to the recent lows of 3500s stock has almost corrected near 20% n finally started to rose from a good weekly demand zone
But it seems the trouble is not over yet
As we can see a strong supply zone with gaps is present in the daily time frame, with a supply range between 3600 - 3670
Any signs of bearishness in lower time frame will be a good time to sell CE or buy PE with a strict Sl above 3680 for a downside target of 3450
Stock also has one more selling opportunity area in daily time frame with supply range between 3750 - 3775
If monitored properly can benefit from both the opportunities
TCS trading at nearby support regionThe price is falling like a crash and there is support at 1.272 level as per harmonic patterns. After confirmation,lets take long position. This is for educational purposes only.

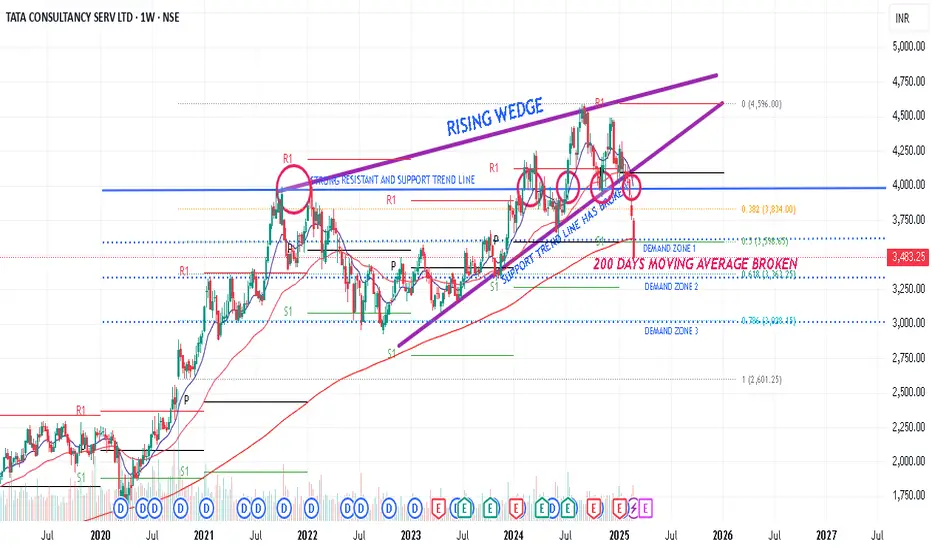
TCS Rising wedgeRising wedge support line has broken and retesting thar line
and the following demand zones are very important for consideration and accumulation.
demand zone 1 - 3600
demand zone 2 - 3330
demand zone 3 - 3000
This analysis is my own idea.
I don't recommend taking trade based on this idea.
consult your SEBI registered adviser to Know the market risk before.
in.tradingview.com
TCS Breakdown Support 3600 28/02/2025NSE INDIA , SYMBOL : TCS TIMEFRAME : DAILY , I was predicted 21/01/2025 TCS on big support line 12/02/2025 TCS Breakdown the line & Next TCS support 3600 Today Breakdown this support line

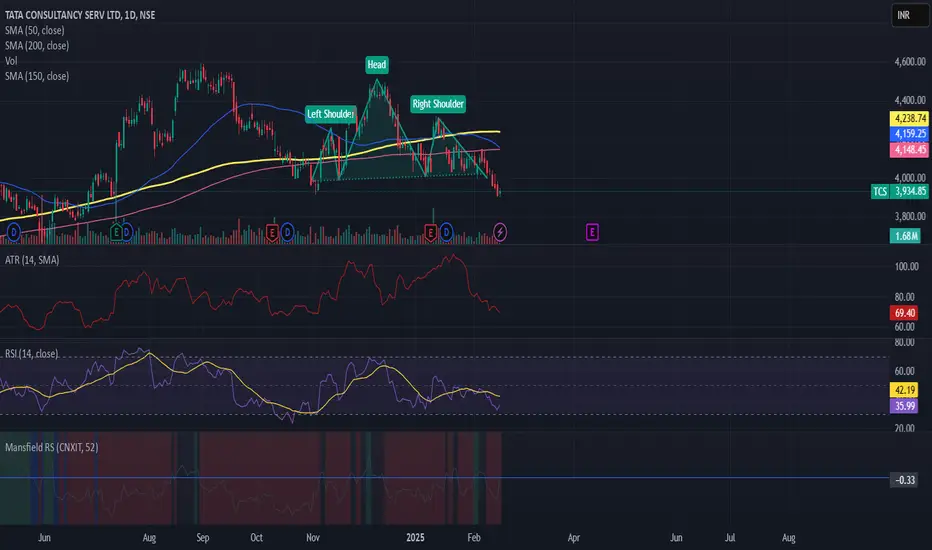
Clear weakness in the Indian markets now extending to IT sectorContinued selling pressure dragging the markets with a spillover effect on one of the most resilient sectors. NSE:TCS has caught my attention forming H&S pattern over 4 months. This signifies weakness with a stop above 4310 with targets 3780,3660,3455. Lacklustre volumes couples with poor outlook and MAGA 2.0 adds more conviction. Chose the pullback near 4000 and CAPITALISE