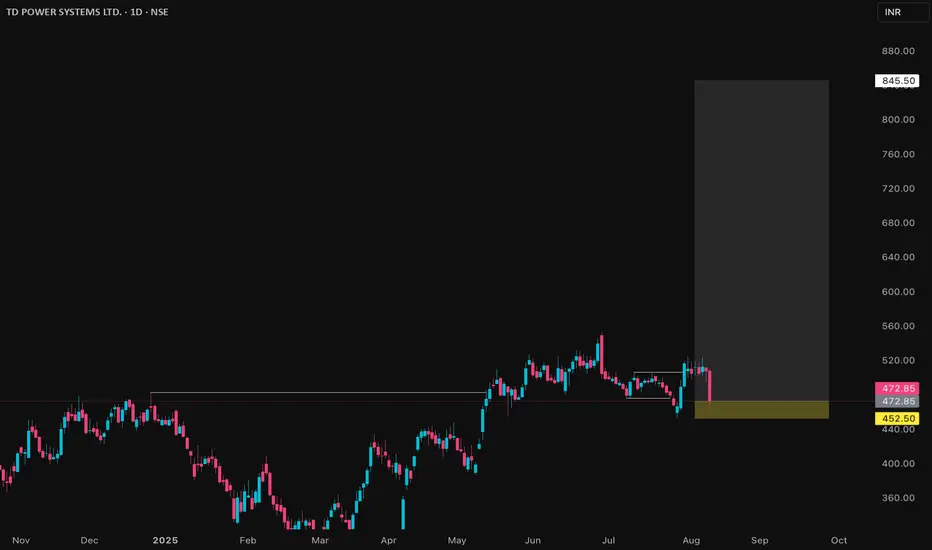
TDPOWERSYS (TD Power System)The stock is trading above all key EMAs, showing strong momentum.
After facing resistance near ₹475, it broke out in May, then briefly retested the ₹475–₹460 zone, which has now turned into solid support.
Now there is probability of another upside move.
✅ If you like my analysis, please follow me
Next report date
—
Report period
—
EPS estimate
—
Revenue estimate
—
12.10 INR
1.75 B INR
12.79 B INR
112.18 M
About TD Power Systems Limited
Sector
Industry
CEO
Nikhil Kumar
Website
Headquarters
Bangalore
Founded
1999
ISIN
INE419M01027
FIGI
BBG001K4NL59
TD Power Systems Ltd. is a holding company, which engages in the design and manufacture of alternating current generators. The firm operates through the following segments: Manufacturing Business, Project Business, and Common. It also offers generators for prime movers such as steam turbines, gas turbines, hydro turbines, diesel engines, gas and wind turbines, and generators for geo thermal and solar thermal applications. The company was founded on April 16, 1999 and is headquartered in Bangalore, India.
Related stocks
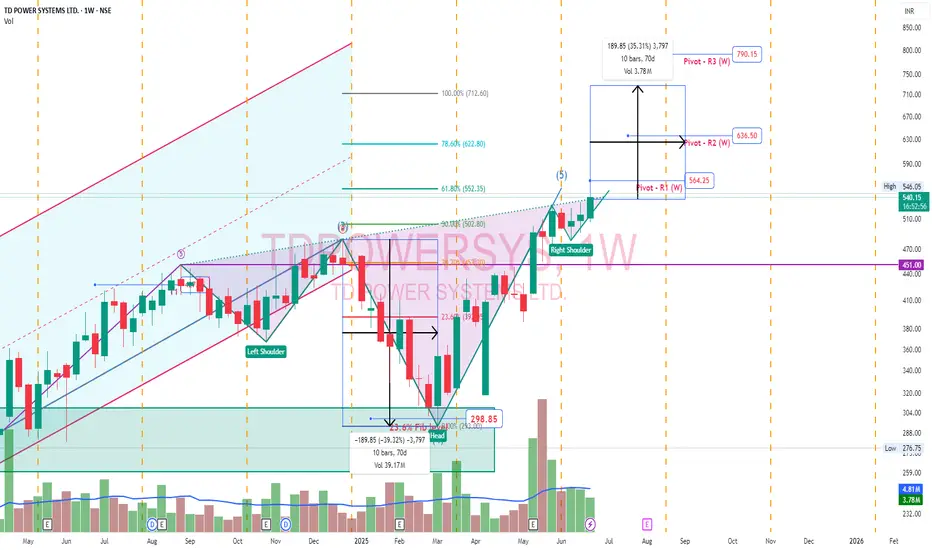
TdPowerSystem - Inverted Head & ShoulderTD Power Systems secured a ₹67 crore export order for traction motor components. This order is for delivery between 2026 and 2027
Inverted Head and Shoulder pattern. Pivot points plotted. Head would be ideal target. Right shoulder low would be long term stoploss.
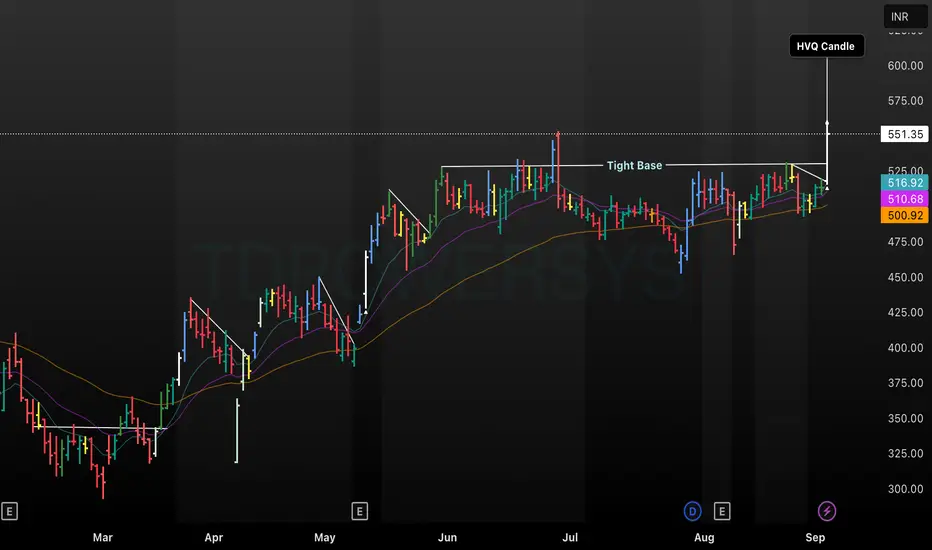
TD Power Systems Breakout: Tight Base & High-Volume SurgeThe chart for TD Power Systems (TDPOW) demonstrates a classic technical setup with a tight consolidation base through July and August, followed by a decisive breakout marked by a high-volume candle surpassing previous resistance near ₹525. Multiple moving averages support the bullish breakout, sugge
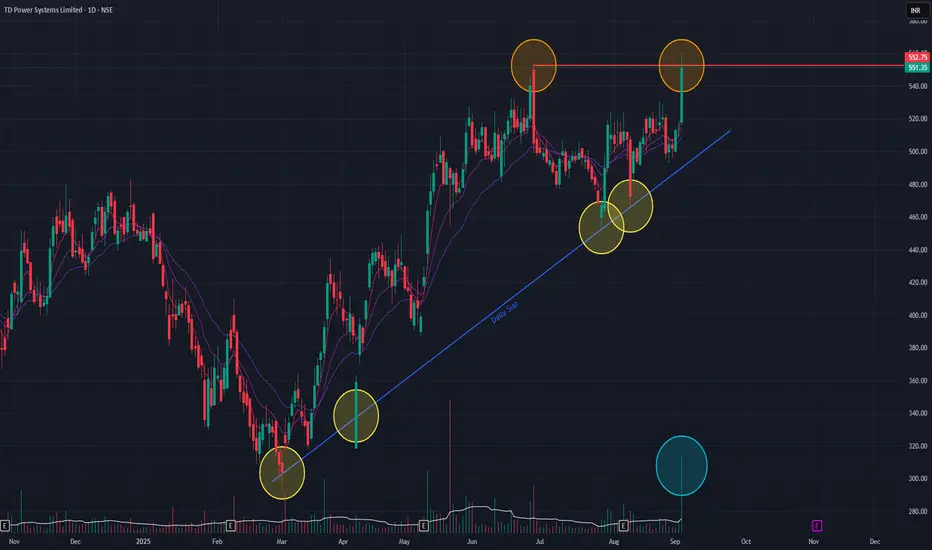
TD Power Systems (Daily Timeframe) - Can it make new ATH ??TD Power made a new All Time High today with huge volume. With that last bullish candle, on daily timeframe, we observe a Double-Top which is a bearish chart pattern. The angular support trendline has been respected as indicated. Short-term EMAs are in positive cross-over state, which is an obvious
TDPOWERSYS Price Action## TDPOWERSYS Price Details (as of August 8, 2025)
### Market Metrics
- Current share price is ₹472.85.
- Market capitalization is ₹7,385crore.
- The 52-week price range is ₹293 to ₹552.75.
- Its all-time low was ₹14 in March 2020; all-time high is ₹552.75 in June 2025.
### Returns & Volatility
-
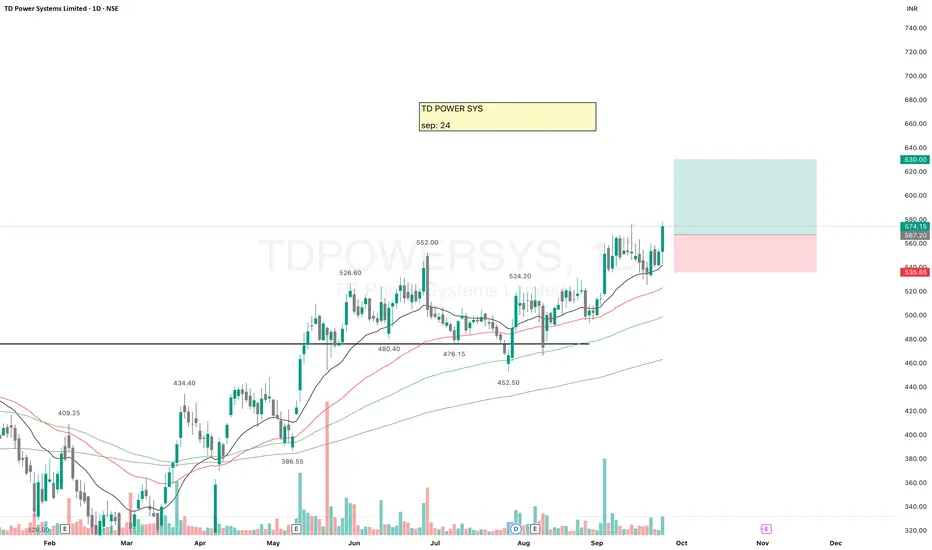
TDPOWERSYS: Anticipated 20% upsideThe chart of TDPOWERSYS provides delineates critical price thresholds that signify breakout points, along with specific support levels that serve as indicators of where buying interest may manifest.
Additionally, the chart highlights regions likely to act as ceiling points for future price ascens

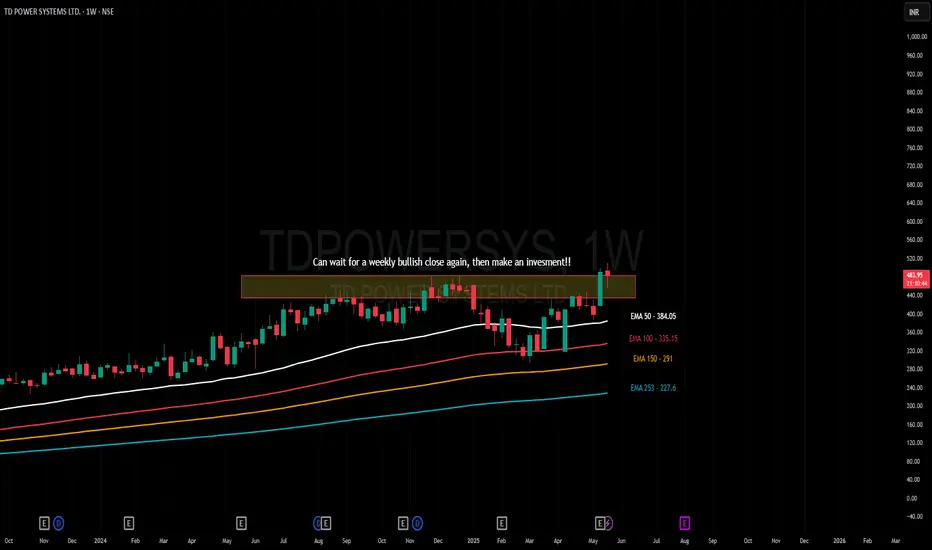
Amazing breakout on WEEKLY Timeframe - TDPOWERSYSCheckout an amazing breakout happened in the stock in Weekly timeframe, macroscopically seen in Daily timeframe. Having a great favor that the stock might be bullish expecting a staggering returns of minimum 25% TGT. IMPORTANT BREAKOUT LEVELS ARE ALWAYS RESPECTED!
NOTE for learners: Place the break
TD Power cup and handleChart -> TD Power Daily
Cup and Handle breakout with volume spurts.
CMP: 455
Targets: 486, 504
SL: 435 Daily Close
Disclaimer: This is for educational purposes only, not any recommendations to buy or sell. As I am not SEBI registered, please consult your financial advisor before taking any action

TD Power Stock financial looks good, fii dii increase holding heavily,
Technically stock create good base create good volume foundation.
Delivery volume increasing.
From here maybe 20/30% easily achievablem
volume and price and fundamental analysis done for this stock.

TD Power systems
SL 1Hr candle close only, Target Trigger Price
All detail for chat. good entry at mark price only. and must stoploss minimum risk and good profit. risk ratio 1:1 to manage modified SL. This is not call, Just my idea. Please understand your risk and take full responsibility of your actions

See all ideas
Summarizing what the indicators are suggesting.
Oscillators
Neutral
SellBuy
Strong sellStrong buy
Strong sellSellNeutralBuyStrong buy
Oscillators
Neutral
SellBuy
Strong sellStrong buy
Strong sellSellNeutralBuyStrong buy
Summary
Neutral
SellBuy
Strong sellStrong buy
Strong sellSellNeutralBuyStrong buy
Summary
Neutral
SellBuy
Strong sellStrong buy
Strong sellSellNeutralBuyStrong buy
Summary
Neutral
SellBuy
Strong sellStrong buy
Strong sellSellNeutralBuyStrong buy
Moving Averages
Neutral
SellBuy
Strong sellStrong buy
Strong sellSellNeutralBuyStrong buy
Moving Averages
Neutral
SellBuy
Strong sellStrong buy
Strong sellSellNeutralBuyStrong buy
Displays a symbol's price movements over previous years to identify recurring trends.
Frequently Asked Questions
The current price of TDPOWERSYS is 577.50 INR — it has decreased by −0.57% in the past 24 hours. Watch TD Power Systems Limited stock price performance more closely on the chart.
Depending on the exchange, the stock ticker may vary. For instance, on BSE exchange TD Power Systems Limited stocks are traded under the ticker TDPOWERSYS.
TDPOWERSYS stock has risen by 7.14% compared to the previous week, the month change is a 9.84% rise, over the last year TD Power Systems Limited has showed a 40.22% increase.
TDPOWERSYS reached its all-time high on Sep 26, 2025 with the price of 586.00 INR, and its all-time low was 14.40 INR and was reached on Mar 25, 2020. View more price dynamics on TDPOWERSYS chart.
See other stocks reaching their highest and lowest prices.
See other stocks reaching their highest and lowest prices.
TDPOWERSYS stock is 2.39% volatile and has beta coefficient of 2.23. Track TD Power Systems Limited stock price on the chart and check out the list of the most volatile stocks — is TD Power Systems Limited there?
Today TD Power Systems Limited has the market capitalization of 89.34 B, it has decreased by −2.74% over the last week.
Yes, you can track TD Power Systems Limited financials in yearly and quarterly reports right on TradingView.
TD Power Systems Limited is going to release the next earnings report on Nov 5, 2025. Keep track of upcoming events with our Earnings Calendar.
TDPOWERSYS net income for the last quarter is 500.74 M INR, while the quarter before that showed 530.21 M INR of net income which accounts for −5.56% change. Track more TD Power Systems Limited financial stats to get the full picture.
TD Power Systems Limited dividend yield was 0.30% in 2024, and payout ratio reached 11.18%. The year before the numbers were 0.37% and 14.51% correspondingly. See high-dividend stocks and find more opportunities for your portfolio.
As of Sep 29, 2025, the company has 814 employees. See our rating of the largest employees — is TD Power Systems Limited on this list?
EBITDA measures a company's operating performance, its growth signifies an improvement in the efficiency of a company. TD Power Systems Limited EBITDA is 2.51 B INR, and current EBITDA margin is 18.61%. See more stats in TD Power Systems Limited financial statements.
Like other stocks, TDPOWERSYS shares are traded on stock exchanges, e.g. Nasdaq, Nyse, Euronext, and the easiest way to buy them is through an online stock broker. To do this, you need to open an account and follow a broker's procedures, then start trading. You can trade TD Power Systems Limited stock right from TradingView charts — choose your broker and connect to your account.
Investing in stocks requires a comprehensive research: you should carefully study all the available data, e.g. company's financials, related news, and its technical analysis. So TD Power Systems Limited technincal analysis shows the strong buy rating today, and its 1 week rating is buy. Since market conditions are prone to changes, it's worth looking a bit further into the future — according to the 1 month rating TD Power Systems Limited stock shows the strong buy signal. See more of TD Power Systems Limited technicals for a more comprehensive analysis.
If you're still not sure, try looking for inspiration in our curated watchlists.
If you're still not sure, try looking for inspiration in our curated watchlists.