[POITIONAL] TECHM : SnR BetAs per Charts. Short if short line breaks before SL. DD advised.Shortby AkshantUpdated 1
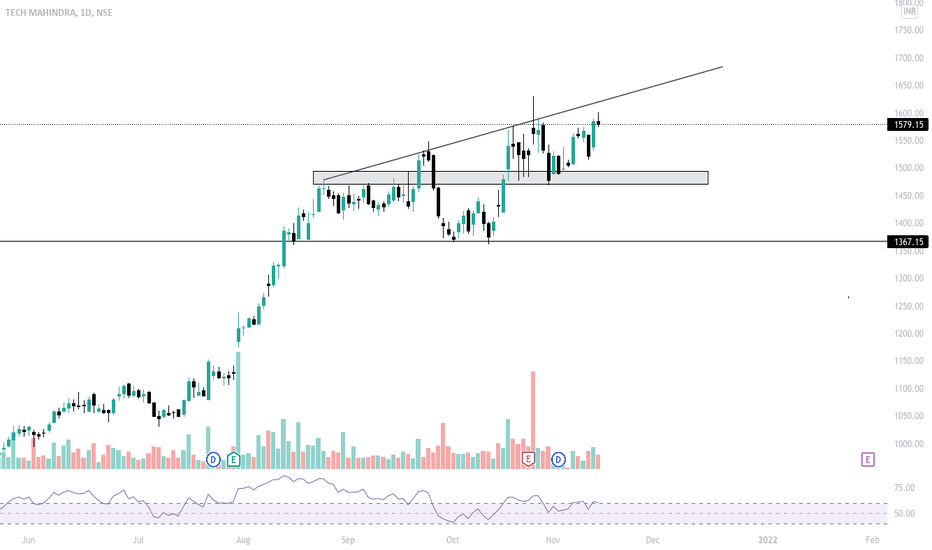
NSE:TECHM LongNSE:TECHM #TECHM formed Rounding bottom and broken the resistance with good volume and sustained above 1530 level Above 1550 sustainability will give good momentum one can try the same level CE post confirmation. Have a Happy trading !!Longby Market_Order90
Trading setup for beginnersOne thing that is a problem for novice traders is the lack of repeatable trading setups. Manually scanning through charts every day is counterproductive. One might take a trade just for the sake of it if they do not find anything worth trading. This pattern can be scanned very easily on charting platforms. Lack of patience is very real during early days as a trader. Having a fixed systematic pattern like this is an antidote to lack of patience and bad trades. Whenever the market penetrates the mentioned low and doesn't follow through, one can expect a short time spike in prices that can be capitalized. These patterns tend to resolve themselves within 3-5 days and occasionally make take some time. This pattern is called Turtle Soup/Turtle Soup Plus One. If the market closes above the mentioned low on the same day, it is called turtle soup and if it closes higher the next day, it is called turtle soup plus one. I learned this strategy from a legendary veteran trader, Linda Bradford Raschke, in her book Street Smarts. The trading pattern is explained thoroughly on the chart but if you have any questions, you can drop them in the comment section. P.S. I highlighted the most recent trade because that was the one that I took and the previous examples on the chart may look like a benefit of hindsight, but that is simply to see how the markets reacted and whether this trade would have worked out or not. Past market behavior is very important. *Welcome corrections on the chart if any*Educationby vorayash05Updated 3310
Simple Trade Setup | TECH MAHINDRA | 19-10-2021 [ INTRADAY]NSE:TECHM Observations: 1) On 1 day time frame, it took good support from 50DMA and also broke 21DMA and closed above resistance range 1465-1475. Now this range should work as support to maintain its bullish momentum. Please refer below chart : 1day Time Frame. 2) On 1hr time frame, we can see double bottom pattern. Please refer below chart : 1hr Time Frame. ------------------------------------- Trade Setup for Date 18-10-2021: Most of the levels will remains the same as per previous setup. 1) Don't Jump in to trade at the beginning of the market. Let it get settle for 15-20min first and judge the price action. 2) Everything is mentioned on the chart. I hope it is easy to understand. 3) All the levels will work as support, resistance, entry and exit w.r.t price action near that level. 4) Avoid gap up or gap down chase. Wait and trade between levels. Please refer below chart for levels. Hope I made it easy to understand it. Do comment your doubt or suggestion. Note: Trade with Strict SL. It may or may not hit all the levels. So one can book profit / loss at respective level considering how price action works near that level.by Trading_hawk4
Flag breaoutBeautiful Set up. Flag breakout. Beauty of technical analysisLongby vishnu_visakh2005Updated 0
[POSITIONAL] TECHM LONG BET risk: Reward ratio is 1: 2 Rest as per Charts ******** Note - One of the best forms of Price Action is to not try to predict at all. Instead of that, ACT on the price. So, this chart tells “where” to act in “what direction. Unless it triggers, like, let’s say the candle doesn’t break the level which says “Buy/Sell if it breaks”, You should not buy/sell at all. ======= I use shorthands for my trades. “Positional” - means You can carry these positions and I do not see sharp volatility ahead. “Intraday” -means You must close this position at any cost by the end of the day. ======= Always follow a stop loss. In the case of Intraday trades, it is mostly the “Low/High of the Candle”. In the case of Positional trades, it is mostly the previous swings ********Longby Palkesh_AgrawalUpdated 1
TECHM : ZIGZAG CORRECTIONExpecting prices to face a resistance newar 1460-1480 zone . One should short the stock keeping SL of 1550 & look for the tgt zone of 1350-1320 area. Shortby TradingSutraUpdated 8
Broken major resistanceIt has broken major resistance and consolidated little. expect minor correction as it is on overbought zone but it will bounce from its support which was its last resistance.Longby WasimHaider88Updated 1
check this out guys its making a cup and handle pattern and volume is supporting it may strike up good , reconfirm and enterLongby reachvinuths1
TECHM Long......Up trending stock Currently under consolidation with drying volume Above 1480 SL below 1398 Target -- 1545-1640 Fundamental Market Cap-- ₹ 140,708 Cr ROCE-- 23.0 % ROE-- 19.0 % Stock P/E-- 29.3 Public holding only 11.44% Please maintain SL stickily Risk 1-3% of your capital(so plan position sizing base on this) My trading view ideas past accuracy (for traget-1 ) around 71%(Please maintain your SL) Longby nikhilgodhaniUpdated 1
TECHM side ways to uptrend Target 2-3 % profit entry around 1368 This a BTST and Swing trade Max period of 2 trading days dont hold for long when you get profit exit this make like Higher lower position when after some days it will break the higher lower then time to entry for 5-10 % return but for now 2-3 % will be idle Dont keep taget more than 1395-97 as 1400 will act as round level and also resistence forming higher low postion from 1400 so be carefull IF you got capital then short 1360 PE for Very Good profit Longby arunprashanth8881
TECHM : TRADE FOR A PULLBACKAfter forming a temporary top near 1548 zone , the stock has given an impulsive fall. This suggests there should be a zig-zag correction. One should buy the stock on current levels with SL of 1370 & look for a target of 1455-80 zone.Longby TradingSutraUpdated 119
TechMBuy above 1412 with the stop loss of 1398. Targets are 1428, 1446 and 1460. Sell below 1388 with the stop loss of 1402. Targets are 1374, 1360 and 1348.by vanathiUpdated 4429
DARVAS BOX BREAKOUT IN TECH MAHINDRATECH MAHINDRA "Darvas box" breakout on charts, closing outside the box will be positive for the stock. buy after that. targets and stoploss are on the chart refer the same.Longby Aditya_MundadaUpdated 9
TechM Intrady 29/09/2021Made a simple analysis of Tech Mahindra. I am going for short as it crosses the level. Hope it helps! Shortby UnknownUnicorn196799403
Tech Mahindra Buy 1461 SL 1450 T1 1470 T2 1484Please use trendlines for resistance and support. Do your analysis before taking any trade.by ashishlele290
TECHM LONGconsolidated for a long time and gave a good breakout wait for a retracement or we can enter half quantity . only for educational purpose .Longby shantanulavu02Updated 1