NSE:TECHM Successfully Closed Above Consolidation Area Go Long NSE:TECHM Successfully Closed Above Consolidation Area Go Long for Target of 1078 Maintain SL below 897
Trade with Strictly SL NSE:TECHM
TECHM trade ideas


TECHM: BUY/SELL Algo signal demonstrationHOW TO FOLLOW ALGO SIGNAL:
Deciding buy/sell
1.Strictly use only on 1 hour time frame.
2.Wait for a ‘X’ sign before mind make up. A red ‘X’ means look for selling opportunity , a green ‘X’ means look for buying opportunity.
Taking a position:
3.Wait for an arrow before entering into any position. A red arrow on upside of a bar pointing downward means open short position. A green arrow below the bar pointing upward means open buy position.
4.NOTE: Only after the the signalling of X , look for arrow. Do not buy/sell if you see any arrow before the signal of X.
5.STOP LOSS should be the most recent swing high/low or most recent STRONG CANDLE’S high/low.
While maintaining the position :
6.The small triangles after the each bar completion tells you to hold the position. The red triangles appearing upside on the bar tells you to hold the short position, whereas the green triangles appearing below the bars tells you to hold the long position.
Exiting the position:
7.After you create a buy position , if you see a green arrow above any bar pointing downward, then you should either book partially/leave the position for sometime. You will get another signal to re-enter.
8.Similarly, after you create a sell position , if you see a red arrow below any bar pointing upward, then you should either book partially/leave the position for sometime. You will get another signal to re-enter.
9.While being in position if you see any X signal which is opposite of your trade , then leave your position immediately.
10.When you see a big red circle dot then you must exit all your short positions. Contrary , when you see a big green circle dot , you must exit all your long positions. And then wait for a X-signal.
No Trading Zone:
11.When you get frequent X-signals in green-red-green-red & that too very close, then its means that stock is going to form a range. One should wait for the range break & move away to another stock. (THIS IS WHERE YOU WILL REQUIRE A PRACTICE TO IDENTIFY THE RANGE)

TechM Intraday ViewTechM : Intraday View
Descending Triangle Breakdown possibility, Looks weak
Short below 1035 with a SL 1045


Tech mahindra buy tech mahindra it will go up and hold the position for one week because market is continuously going up and very bullish so hold this stock for one week and it will give you return of 5 to 10%

TechM Bullish - possible target of 993-996Tech Mahindra bullish in daily tf and may reach 993-996 or upto 1000.

Tech mahindra technical analysis 1hr,45 min, 15 mintechmahindra technical analysis usimg fibonacci retracement and levels


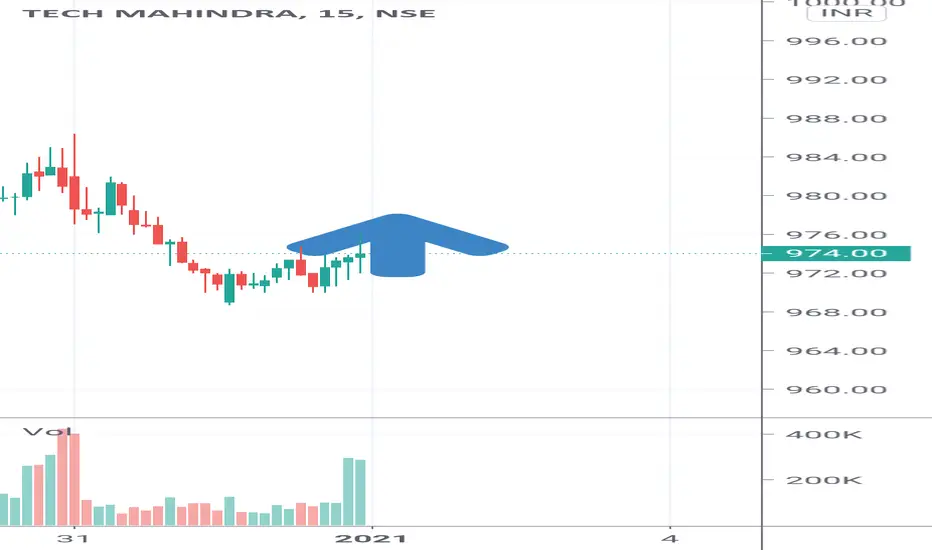
Tech-M - Inside Range Past 3 DaysTech Mahindra - High volume breakout with 3 days consolidation
Looks good to buy near support area or after break of range


TechM - Setup for 30 DEC 2020Beautiful breakout in TechM today, can hope for a profit booking tomorrow morning before heading to higher targets.
If rejection from 968 on opening, short to take quick profits till 956.
If 956 sustains, we can go long at these levels for upper targets
You can go long if gaps up & sustains 968.

Tech Mahindra in a new high zoneTech Mahindra is a new high zone and is trading with good indications.
Also, move observation towards the RSI. Interestingly, the stock has not really moved below the 50 line in the RSI decisively. That indicates good strength in the stock.
Go long in this stock. IT is the flavour of the market.
If not trading, certainly keep this on radar to buy at dips.
Please like and follow.
NSE:TECHM


Tech Mahindra breaks multi year resistanceTCHM breaks important resistance on monthly timeframe.. it wil be interesting to see if this sustainable or not.

TECHM (Tech Mahindra) 1000+ targetTECHM is at breakout level and if breakout then the target will be 1000 with a stoploss of 945 per share. Get the trade accordingly ...

TECHMWe have seen channel breakout and we can seen price is near to 1st target. waiting for to reach remaining targets.

Sell TechMahindra below 940Sell if it sustains below 940 on 15 mins timeframe for the targets of 905 and 880.
Happy Trading!
InvestPro India Team
