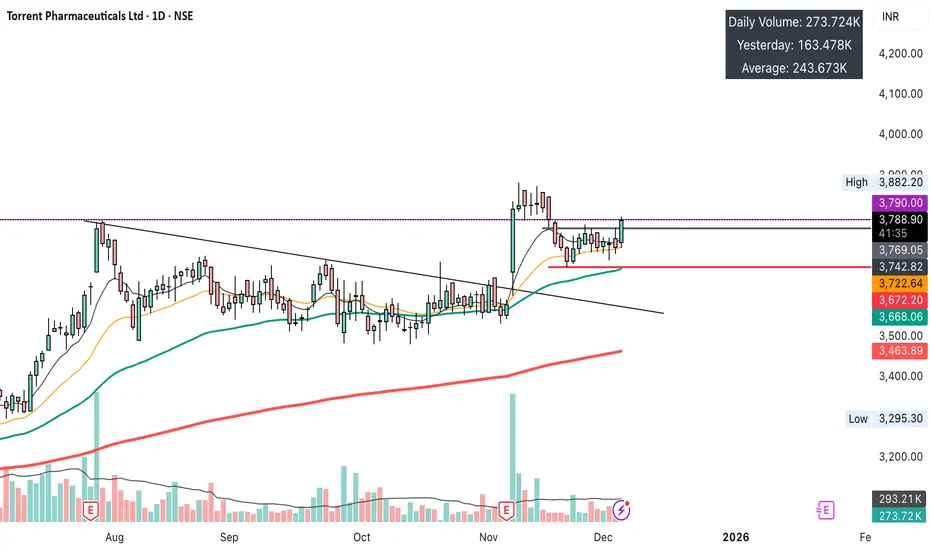
$TORNTPHARM: Long on Relative Strength & Flag BreakoutThis is a live swing trade I am taking in $TORNTPHARM. The stock is trading near All-Time Highs and showing exceptional relative strength by pushing higher irrespective of broader market conditions.
This post details the *full* mechanical framework I am using to manage this trade.
### 1. Indicators Used on This Chart
* **9 EMA (thin black line):** Short-term momentum guide.
* **21 EMA (thin orange line):** Acts as dynamic support for the recent pullback.
* **50 EMA (green line):** Medium-term trend.
* **Volume:** Validating the buyer interest on up-days.
### 2. Decoding the "High Tight Flag" Setup
This setup screams strength for three reasons:
1. **The Pole (Nov 10 Breakout):** The stock saw a massive, high-volume surge in mid-November, breaking out of a long-term base.
2. **The Flag (Consolidation):** Instead of giving back gains, the stock entered a tight, healthy consolidation phase. It pulled back gently, finding support near the **21 EMA**, which shows buyers are eager to defend the trend.
3. **Relative Strength (The "Alpha"):** Today, the stock is moving up strongly despite lackluster market conditions. When a stock ignores market weakness, it often leads the next leg of the rally.
### 3. The Mechanical Trade Plan (The "Swing" Playbook)
This is a cash "Swing" trade with defined rules.
* **Bias:** Long
* **Entry (Purple Line):** `₹3,790.00` (Buying the breakout from the consolidation flag)
* **Stop-Loss (Red Line):** `₹3,670.00` (Placed structurally below the recent consolidation lows and the 21 EMA support)
* **Risk (1R):** My risk is fixed at **`₹120.00`** per share. This is a tight **3.16%** risk, offering exceptional Risk/Reward potential.
### 4. Our Exit Strategy (The "2R / 21EMA Hybrid")
1. **Target 1 (Base Hit):** Sell **50% of the position at +2R.**
* **2R Target = ~₹4,030.00**
* This targets the psychological ₹4000+ level.
2. **The "Free Trade" Maneuver:** As soon as Target 1 is hit, the stop-loss on the remaining 50% is moved to **Breakeven (`₹3,790.00`).**
3. **Target 2 (The Runner):** I will trail the remaining "free" position using the **21 EMA (orange line)** to capture the trend continuation.
*Disclaimer: This is not financial advice. This is my personal trade journal and framework, shared for educational and analytical purposes only. Always do your own research.*
Trade ideas
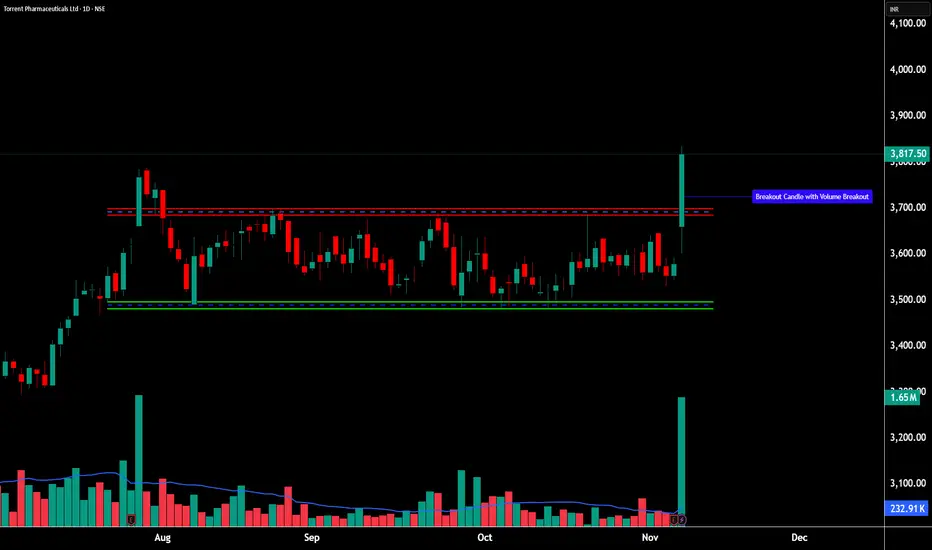
Torrent Pharma (D): Strongly Bullish, Blue-Sky BreakoutThis is a high-conviction breakout. The stock has broken out of a 4-month consolidation, setting a new all-time high on high volume. The move is strongly supported by all indicators and a powerful fundamental catalyst.
📈 1. The Dominant Pattern: ATH Breakout
- The Consolidation: After making its previous ATH in July 2025, the stock entered a 4-month sideways trend.
- The "Lid": A horizontal resistance line formed at this ATH (approx. ₹3,787 ) restricted all forward movement.
- Volume Contraction: Volume was "drying up" during this consolidation phase. This is a classic bullish sign of seller exhaustion and accumulation.
🚀 2. The Decisive Breakout (Today's Action)
- The Surge: Today, the stock shattered this resistance with a 6.63% surge , backed by a high-conviction volume of 1.65 Million shares.
- The New ATH: This move resulted in a new all-time high, pushing the stock into a "blue-sky" price discovery phase.
- The Catalyst: This technical move is not speculative. It is driven by strong Q2 2026 earnings (30% profit growth), confirming that institutions are buying on good news.
📊 3. Key Technical Indicators
Indicator analysis confirms the bullish momentum across all timeframes:
- RSI: The Relative Strength Index is rising on the Daily, Weekly, and Monthly charts .
- EMAs: The short-term Exponential Moving Averages are in a "PCO" (Price Crossover) state on all three timeframes.
🎯 4. Future Scenarios & Key Levels to Watch
⚠️ A Note of Caution (The "Fakeout" Risk)
The risk is a "bull trap" or "fakeout." The correct thing to watch for, is bearish divergence (i.e., if the stock makes another new high, but the RSI makes a lower high).
🐂 The Bullish Case (Confirmation)
- Confirmation: The ideal "textbook" move would be a re-test . We want to see the stock pull back to the ₹3,787 level and "bounce," confirming the old resistance has become new support.
- Target: If the bullish momentum continues, the next logical target is ₹4,100 .
🐻 The Bearish Case (Breakout Failure)
- Trigger: The breakout fails, and the stock loses momentum (a "bull trap").
- Confirmation: The price falls and closes back below the ₹3,787 support level, invalidating the breakout.

TORNTPHARM - 52-Week Breakout With Institutional Conviction________________________________________
💹 Torrent Pharmaceuticals Ltd (NSE: TORNTPHARM)
Sector: Pharmaceuticals | CMP: ₹3,817.50 | View: 52-Week Breakout With Institutional Conviction
________________________________________
📊 Price Action:
Torrent Pharma delivered a powerful 52-week breakout candle backed by exceptionally high volume, confirming strong institutional participation and renewed leadership momentum within the pharma space.
After consolidating for several weeks between ₹3,400–₹3,650, the stock broke through resistance with a wide-range bullish candle, signaling a structural shift from accumulation to expansion.
The follow-through strength and delivery volume highlight conviction buying, positioning Torrent Pharma for potential short- to medium-term trend continuation.
________________________________________
💼 HNI Trade Levels (STWP Setup):
Aggressive Entry: ₹3,817–₹3,835 | Stop Loss: ₹3,660
Low-Risk Entry: ₹3,770 | Stop Loss: ₹3,594.09
The breakout session recorded 1.65M shares vs 0.23M average, confirming institutional footprints.
Price structure has cleanly shifted into higher territory, with ₹3,665–₹3,700 now acting as the new demand base.
Sustaining above this zone keeps the bias firmly bullish with room for further upside extension.
________________________________________
📉 Chart Pattern Analysis – 52-Week Breakout (Institutional Structure):
Torrent Pharma has been in a multi-week compression phase, forming a tight base under the ₹3,700 resistance zone.
Such base formations often precede high-conviction institutional breakouts, and the explosive candle with volume confirmation validates that the breakout is not speculative but driven by genuine accumulation.
The move aligns with sectoral strength seen across quality pharma counters, where price action is transitioning from range-bound to trending behavior.
This breakout now places Torrent Pharma in the leadership bracket within the pharma index structure, supported by momentum and delivery expansion.
________________________________________
📈 STWP Trading Analysis:
Bullish Breakout: ₹3,817–₹3,835 | Stop Loss: ₹3,660.06
The breakout candle exhibited strong momentum with a 7x volume surge, indicating clear participation from institutions and long-only funds.
Price has decisively closed above short- and medium-term EMAs, confirming trend alignment across daily and weekly timeframes.
Holding above ₹3,665–₹3,700 will maintain the bullish bias, keeping the setup active toward ₹3,935–₹4,015 in the short term.
A sustained close above ₹3,935 can potentially open the next expansion leg toward ₹4,145 levels.
________________________________________
📈 Candlestick Structure – Bullish Strength Confirmation:
The breakout candle represents a strong bullish engulfing formation, signaling complete control by buyers.
The large body-to-wick ratio and volume expansion confirm institutional momentum entry rather than retail-driven strength.
Such candles following a multi-week base often mark early-stage uptrend resumption phases, where risk-to-reward remains highly favorable if trend levels hold.
________________________________________
📏 Fibonacci Analysis:
From swing low ₹3,079 to swing high ₹3,835:
61.8% retracement @ ₹3,436 → Major base support
50% retracement @ ₹3,457 → Structural accumulation zone
23.6% retracement @ ₹3,666 → Confirmed demand zone
Sustaining above the 23.6% level keeps the momentum firmly intact, while a clean close above ₹3,935 validates continuation toward ₹4,145–₹4,185 Fibonacci extension levels.
________________________________________
🧭 STWP Support & Resistance:
Resistances: ₹3,901 | ₹3,984 | ₹4,134
Supports: ₹3,667 | ₹3,518 | ₹3,344
The ₹3,665–₹3,700 area remains the immediate accumulation pocket, aligning with EMA support and Fibonacci confluence.
The breakout above ₹3,835 confirms strength, while supports around ₹3,500 represent deeper institutional demand zones.
________________________________________
📊 STWP Volume & Technical Setup:
Today’s session saw 1.65M shares traded vs 0.23M average, validating strong institutional accumulation and conviction buying.
Indicators confirm trend strength:
RSI (70+) – sustaining above bullish zone.
MACD – positive crossover maintained.
CCI & Stochastic – both elevated, reflecting momentum expansion.
Overall alignment across daily and weekly charts confirms trend continuation potential.
Trend Direction: UPTREND | Volume Confirmation: Strong Institutional Activity
________________________________________
🧩 STWP Summary View:
Final Outlook:
Momentum: Strong | Trend: Bullish | Risk: Moderate | Volume: High
Torrent Pharma’s breakout signifies a transition from accumulation to expansion, supported by clear institutional conviction and strong technical structure.
As long as the price sustains above ₹3,665–₹3,700, the bias remains bullish with targets toward ₹3,935–₹4,145 in the near term.
The setup continues to display a clean risk–reward framework within an evolving leadership trend in the pharma sector.
________________________________________
⚠️ Disclosure & Disclaimer – Please Read Carefully
This post is created purely for educational and informational purposes and does not constitute investment advice or a buy/sell recommendation.
I am not a SEBI-registered investment adviser. All observations are based on technical studies and publicly available information.
Trading and investing involve risk; please manage position size and stop-loss discipline as per your risk profile.
Always consult a SEBI-registered financial advisor before making trading decisions.
________________________________________
Position Status: No active position in (TORNTPHARM) at the time of analysis.
Data Source: TradingView & NSE India
💬 Found this useful?
🔼 Boost this post if you value clean, structured analysis.
💭 Drop your views — can Torrent Pharma sustain this breakout above ₹3,835?
🔁 Share this with traders who track institutional breakouts.
👉 Follow for more price-action based institutional setups.
🚀 Stay Calm. Stay Clean. Trade With Patience.
Trade Smart | Learn Zones | Be Self-Reliant 📊
________________________________________
Torrent Pharma Long Swing CandidateChart Analysis :
Price making a flat decending triangle pattern while holding a major weekly support of 3500 levels and looking to breakout above the trendline resistance zone and can be considered for long. One can enter here or wait for 3600 above daily close or one hour sustain above 3600.
Key Levels :
Targets (Resistance) - 3650/3685/3700/3750
StopLoss (Major Support) - 3500 below daily close
Disclaimer:
I am not SEBI registered. This analysis is for educational purposes only and not investment advice. Please do your own research before trading or investing.
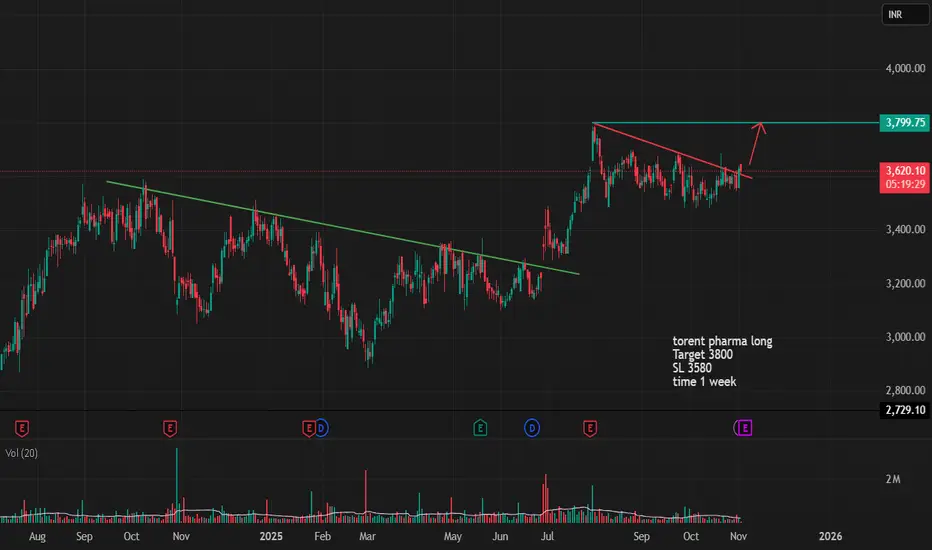
Long Torent PharmTorent pharma long
Target 3800
SL 3580
time 1 week
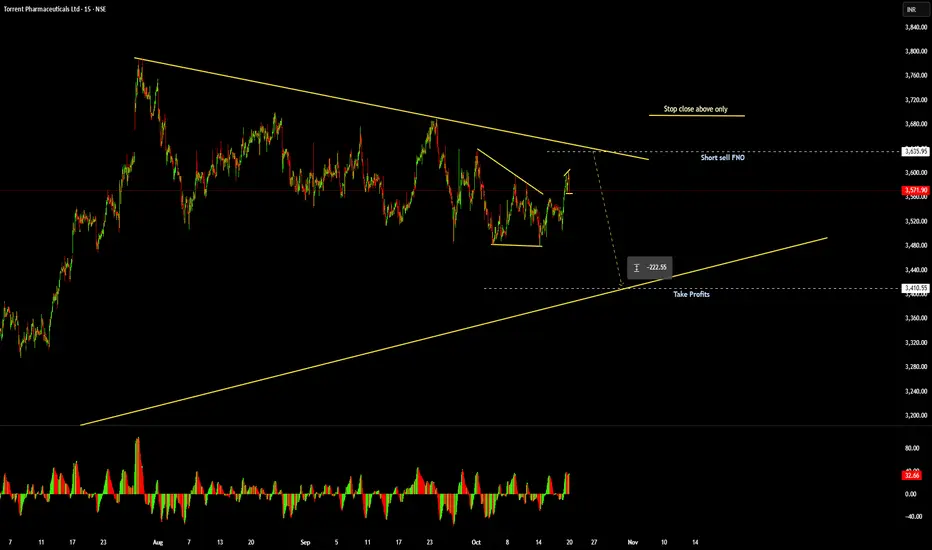
after a small consolidation torent again is making a buy call.
its making a higher high higher low and in a long term bull run.
Can this work , Just saying I am just saying the Methods once ware used in US markets
where the stop was close only by EOD ,
Sell was at supply Line
Take Profits after the demand Line
This is Experiment Post
Kindly take note as Education content
Good luck
Flag & Pole pattern at torrent pharmaFlag & pole pattern in torrent pharma stock in daily & weekly timeline.

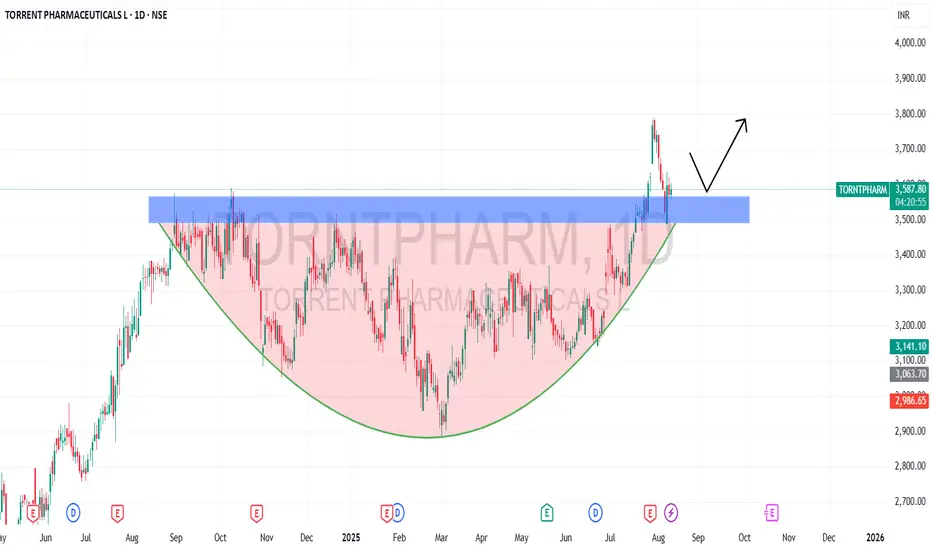
Torrent Pharma – Steady Growth with Strong Margins📈Technical Analysis
The stock has shown a powerful uptrend over the past 5–6 years, with a sharp rally from ₹1,000 to ₹3,500. For the past year, the ₹3,500–₹3,600 zone stood strong as resistance. With the release of the positive Q1 FY26 results, Torrent has decisively broken above this supply zone accompanied by higher volumes—something not seen earlier this year.
After the breakout, prices rose to ₹3,800 and then retested the broken zone, which now appears to be offering support. Provided this zone continues to hold and is followed by bullish candlestick confirmation, the stock looks set for further upside.
Targets:
🎯 ₹3,800 (Target 1)
🎯 ₹3,900 (Target 2)
🎯 ₹4,000 (Target 3)
Stop Loss: Below the support zone at ₹3,400. If prices fall below this, bullish outlook is invalidated.
💰Q1 FY26 Financial Highlights (vs Q4 FY25 & Q1 FY25)
Total Income: ₹3,178 Cr (↑ +7.4% QoQ vs ₹2,959 Cr; ↑ +11.2% YoY vs ₹2,859 Cr)
Total Expenses: ₹2,146 Cr (↑ +7.6% QoQ vs ₹1,995 Cr; ↑ +9.8% YoY vs ₹1,955 Cr)
Operating Profit: ₹1,032 Cr (↑ +7.0% QoQ vs ₹964 Cr; ↑ +14.2% YoY vs ₹904 Cr)
Profit Before Tax: ₹738 Cr (↑ +11.0% QoQ vs ₹665 Cr; ↑ +12.5% YoY vs ₹656 Cr)
Profit After Tax: ₹548 Cr (↑ +10.0% QoQ vs ₹498 Cr; ↑ +19.9% YoY vs ₹457 Cr)
Diluted EPS: ₹16.19 (↑ +10.1% QoQ vs ₹14.71; ↑ +19.9% YoY vs ₹13.50)
This performance reflects robust execution across both domestic and international markets.
🧠Fundamentals & Strategic Highlights
Domestic Market Strength: India revenues grew ~11%, driven by outperforming chronic therapies (13% growth vs 9% IPM growth)
Global Growth:
US business expanded by ~19%
Brazil saw 11% growth
Analyst Sentiment: Citi raised its target price to ₹4,380, citing sustained margin expansion and branded portfolio gains
M&A Plans: Torrent is acquiring a majority stake in JB Chemicals for ₹18,000–₹19,500 Cr, positioning the company among India’s top five pharma giants
✅Conclusion
Torrent Pharma’s technical breakout, backed by a wholesome Q1 performance and strategic M&A moves, positions it favorably for renewed upside. A failure to hold above ₹3,500 would challenge this view.
Disclaimer: lnkd.in
Torrent Pharma – Steady Growth with Strong Margins📈 Technical Analysis
The stock has shown a powerful uptrend over the past 5–6 years, with a sharp rally from ₹1,000 to ₹3,500. For the past year, the ₹3,500–₹3,600 zone stood strong as resistance. With the release of the positive Q1 FY26 results, Torrent has decisively broken above this supply zone accompanied by higher volumes—something not seen earlier this year.
After the breakout, prices rose to ₹3,800 and then retested the broken zone, which now appears to be offering support. Provided this zone continues to hold and is followed by bullish candlestick confirmation, the stock looks set for further upside.
Targets:
🎯 ₹3,800 (Target 1)
🎯 ₹3,900 (Target 2)
🎯 ₹4,000 (Target 3)
Stop Loss: Below the support zone at ₹3,400. If prices fall below this, bullish outlook is invalidated.
💰 Q1 FY26 Financial Highlights (vs Q4 FY25 & Q1 FY25)
Total Income: ₹3,178 Cr (↑ +7.4% QoQ vs ₹2,959 Cr; ↑ +11.2% YoY vs ₹2,859 Cr)
Total Expenses: ₹2,146 Cr (↑ +7.6% QoQ vs ₹1,995 Cr; ↑ +9.8% YoY vs ₹1,955 Cr)
Operating Profit: ₹1,032 Cr (↑ +7.0% QoQ vs ₹964 Cr; ↑ +14.2% YoY vs ₹904 Cr)
Profit Before Tax: ₹738 Cr (↑ +11.0% QoQ vs ₹665 Cr; ↑ +12.5% YoY vs ₹656 Cr)
Profit After Tax: ₹548 Cr (↑ +10.0% QoQ vs ₹498 Cr; ↑ +19.9% YoY vs ₹457 Cr)
Diluted EPS: ₹16.19 (↑ +10.1% QoQ vs ₹14.71; ↑ +19.9% YoY vs ₹13.50)
This performance reflects robust execution across both domestic and international markets.
🧠 Fundamentals & Strategic Highlights
Domestic Market Strength: India revenues grew ~11%, driven by outperforming chronic therapies (13% growth vs 9% IPM growth)
Global Growth:
US business expanded by ~19%
Brazil saw 11% growth
Analyst Sentiment: Citi raised its target price to ₹4,380, citing sustained margin expansion and branded portfolio gains
M&A Plans: Torrent is acquiring a majority stake in JB Chemicals for ₹18,000–₹19,500 Cr, positioning the company among India’s top five pharma giants
✅ Conclusion
Torrent Pharma’s technical breakout, backed by a wholesome Q1 performance and strategic M&A moves, positions it favorably for renewed upside. A failure to hold above ₹3,500 would challenge this view.
⚠️ Disclaimer: This report is for informational purposes only and does not constitute investment advice. Please consult a financial advisor before making any investment decisions.

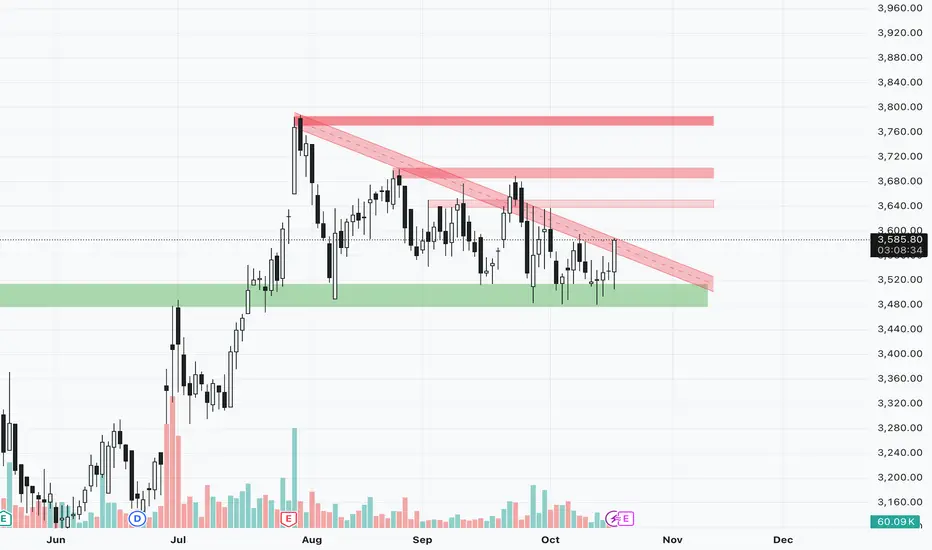
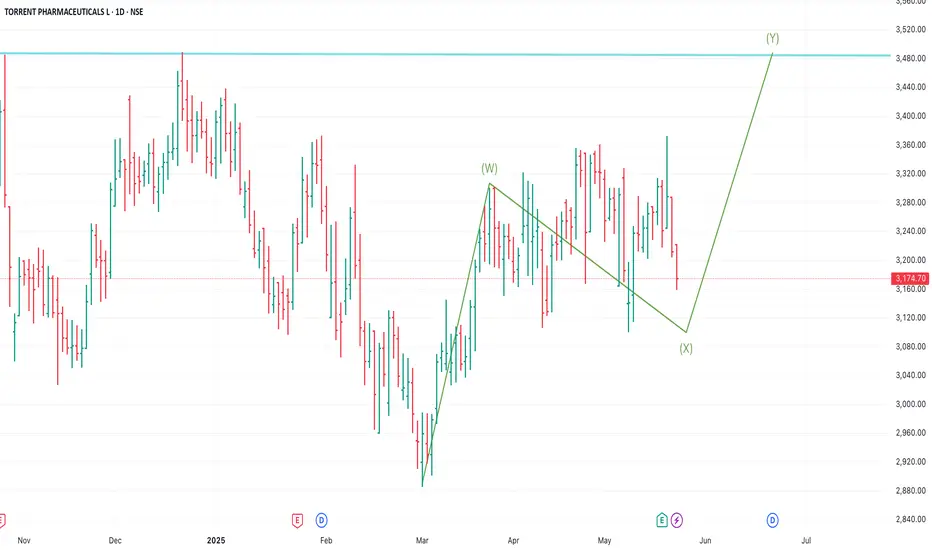
Torrent Pharma to touch 3100 again ?Torrent Pharma is in corrective phase for a while. This correction is not going to end anytime soon, however we still have opportunity to make some money here.
Currently on the Daily chart its in complex correction in which we have already completed Wave W, what's left is Wave X and Wave Y. Once we are good with the completion of wave X then expect it to unfold in a-b-c which will be part of wave Y.
Disclaimer: I am not SEBI registered member, this is only for educational purpose only.
TORNTPHARM : Bullish SetupBullish breakout from Bigger Channel pattern as well as a smaller channel pattern. Expecting 10% from the breakout level.
Reason For Bullish Setup
1) Breakout from large channel pattern
2) Breakout from smaller channel pattern
3) Breakout from inverted head and shoulder inside smaller channel pattern
This analysis is for educational purposes only. I’m not a SEBI-registered advisor and this is not a trading or investment recommendation.
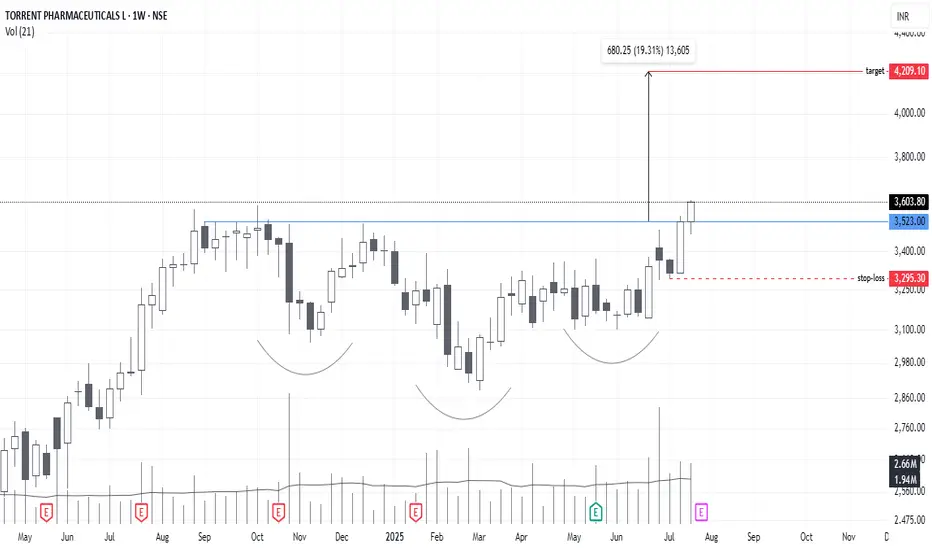
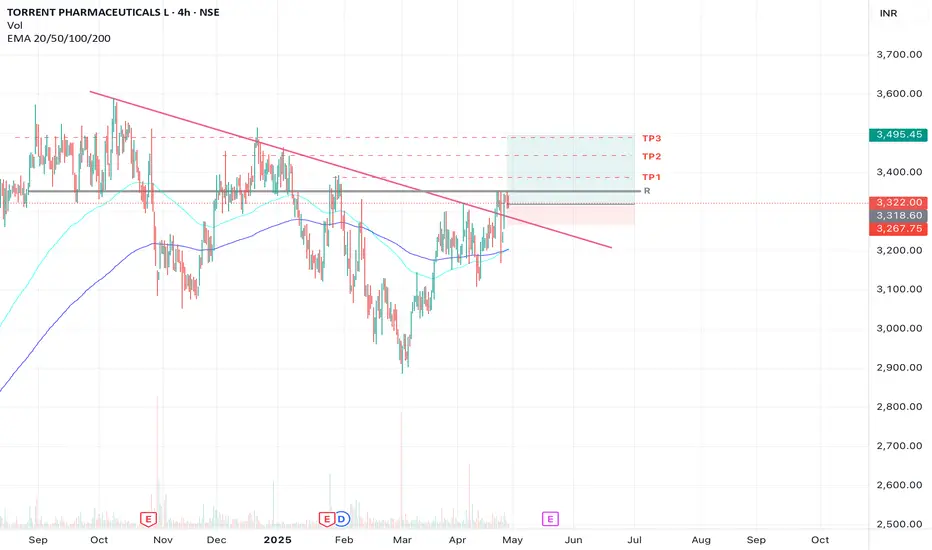
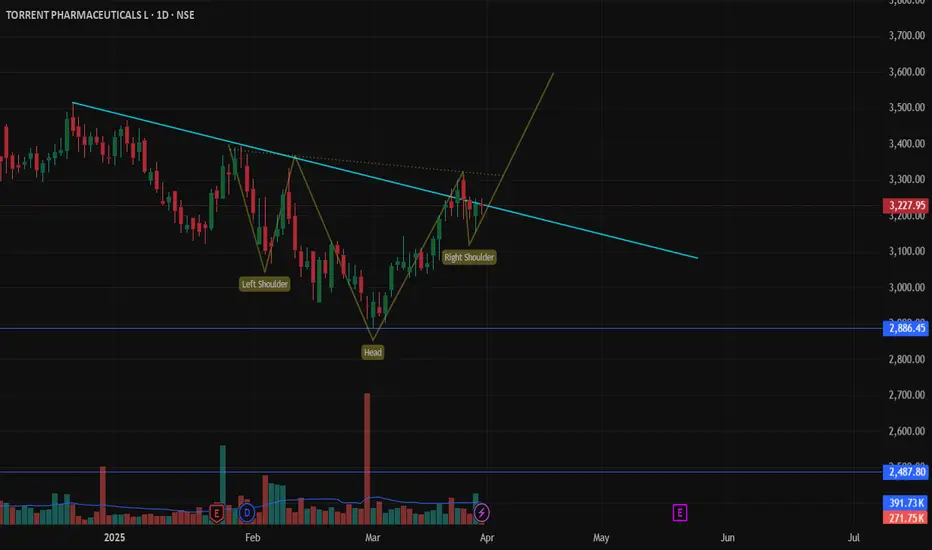
TORNTPHARM : Consolidation BreakoutStock is showing consolidation Breakout on ATH level, which is good for stock. Depends on its upcoming results the rally will be continue. Showing Head and Shoulder Breakout
All data is available in public domain..
CMP : 3600
TG : 4200
SL : 3290
Stock's selection based on 5 Point Analysis:
1: Idea : Breakout.
2: Support : Volume, Delivery .
3: Technical : 21/55/200-EMA, Super trend up, RS>0 RSI.
4: Fundamental : PE, PAT, Industry & peer PE and sector performance.
5: Timing : Entry Timing on Daily chart.
Disclaimer : It is my personal view as a trader and for educational purpose only. Equity market involves risk .
Please consult your financial adviser before taking any decision.
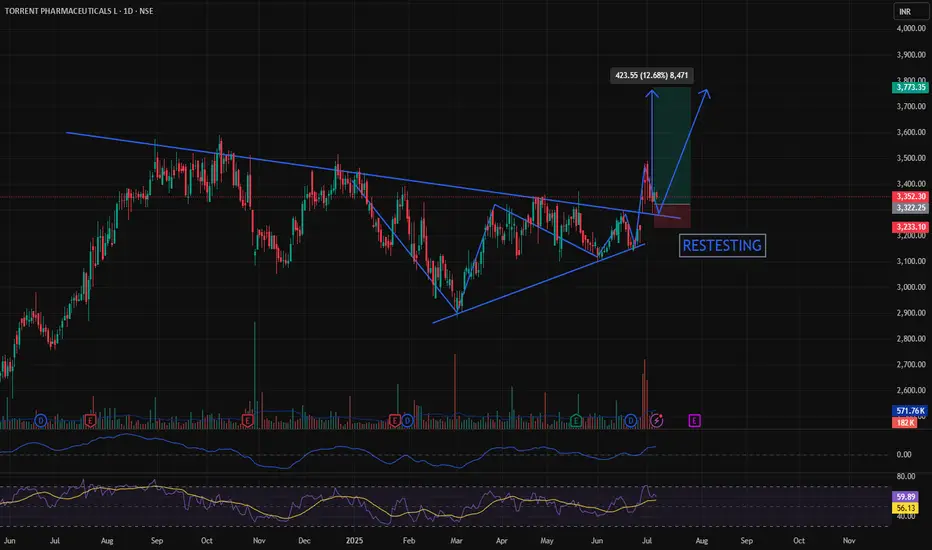
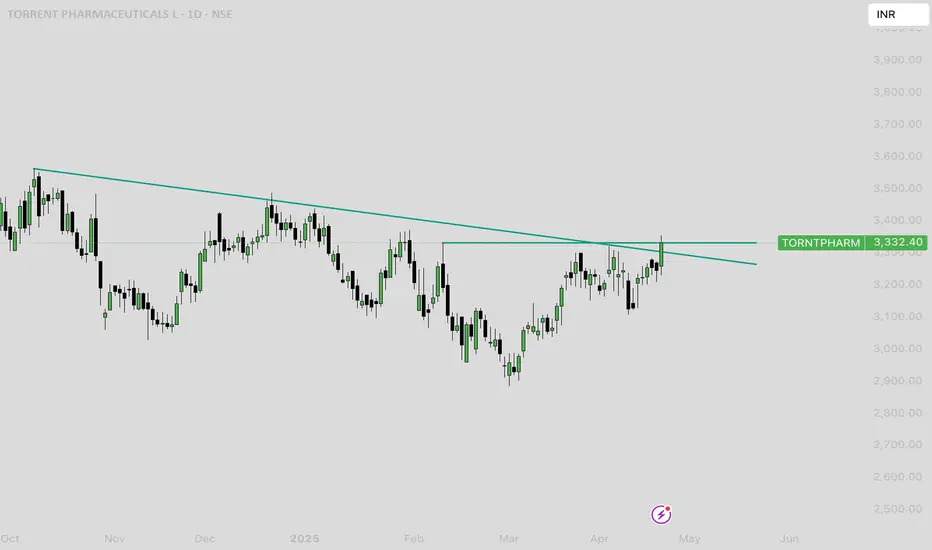
TORRENT PHARMA LTD, RETESTING AFTER BREAKOUTTORRENT PHARMA LTD, Retesting after trendline breakout. keep eyes on it. looking good for long.
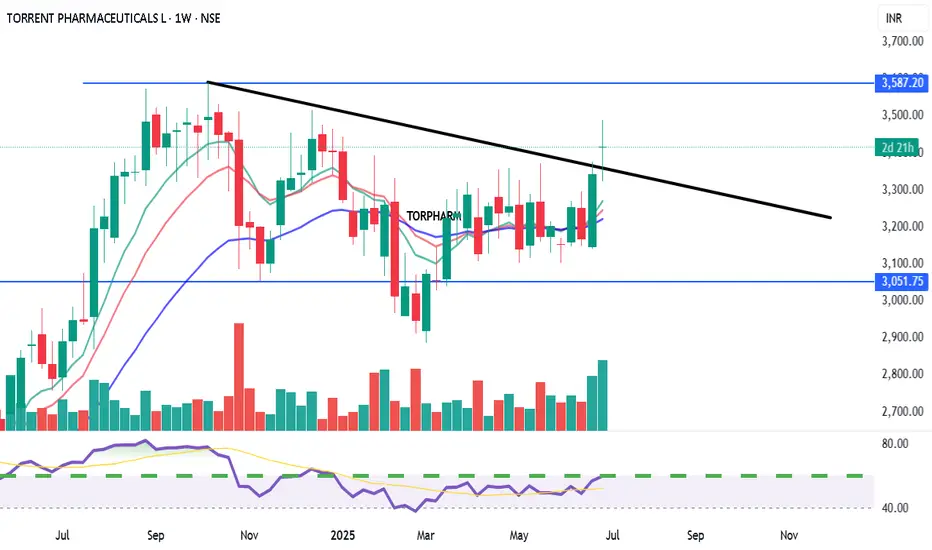
TORRENT PHARMACEUTICALS LTD. (TORPHARM) View: Bullish on confirmed breakout.
Bias: Positive momentum building.
Strategy:
BUY: Above ₹3600 (on weekly closing basis with strong volume confirmation).
Targets (T):
T1: ₹3750
T2: ₹3950+
Stop-Loss (SL): ₹3400 (on weekly closing basis).
Reasoning:
Strong support at ₹3000-₹3050.
Challenging multi-month descending trendline resistance.
Positive RSI divergence and increasing volume.
Potential for a significant trend reversal if breakout is confirmed.
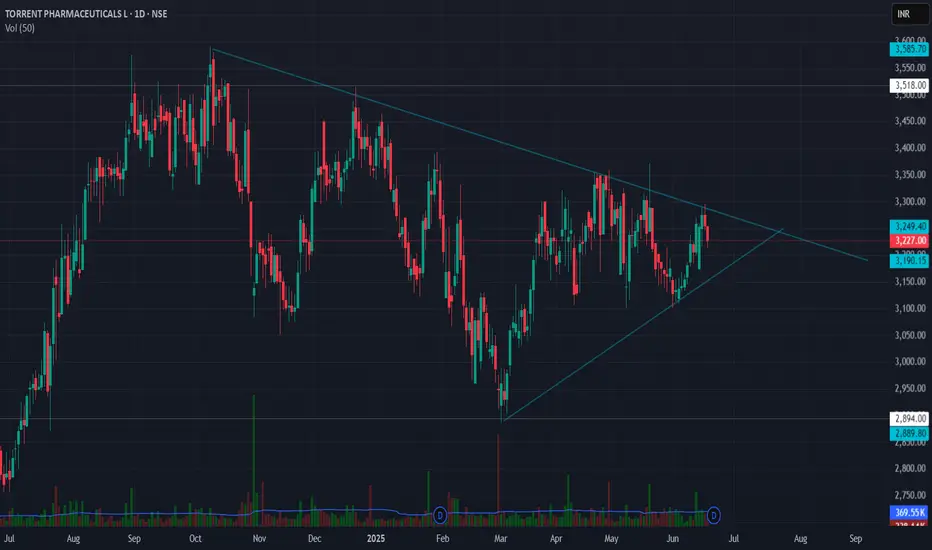
Symmetrical Triangle pattern in Torrent Pharma Symmetrical Triangle Breakout Setup
Torrent Pharmaceuticals Ltd (TORNTPHARM)
Breakout Level: ₹3,300
Stop Loss: ₹3,150 (below triangle support)
Target: ₹4,000 (based on height of triangle)
Risk:Reward: ~2.8:1
✅ Technical Confirmation:
RSI near 52 — momentum shifting bullish above 55.
MACD positive crossover, rising histogram — trend strength improving.
Volume: Awaiting breakout candle with above-average volume for confirmation.
EFI (Elder Force Index) turning positive — signals potential surge in buying force.
📌 Strategy Insight:
A breakout above ₹3,300, backed by volume and momentum, could lead to a sharp trend continuation toward ₹4,000. The symmetrical triangle represents consolidation after trend — a potential bullish continuation pattern.
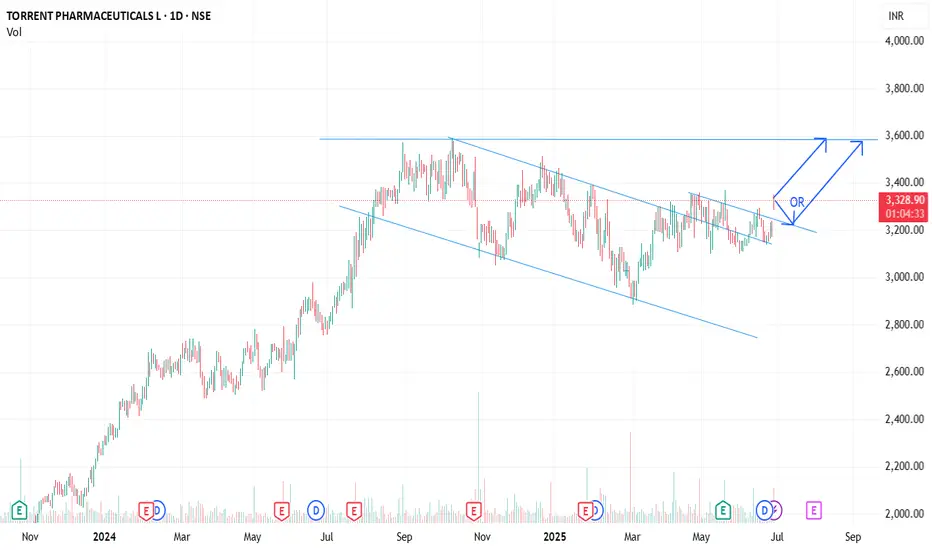
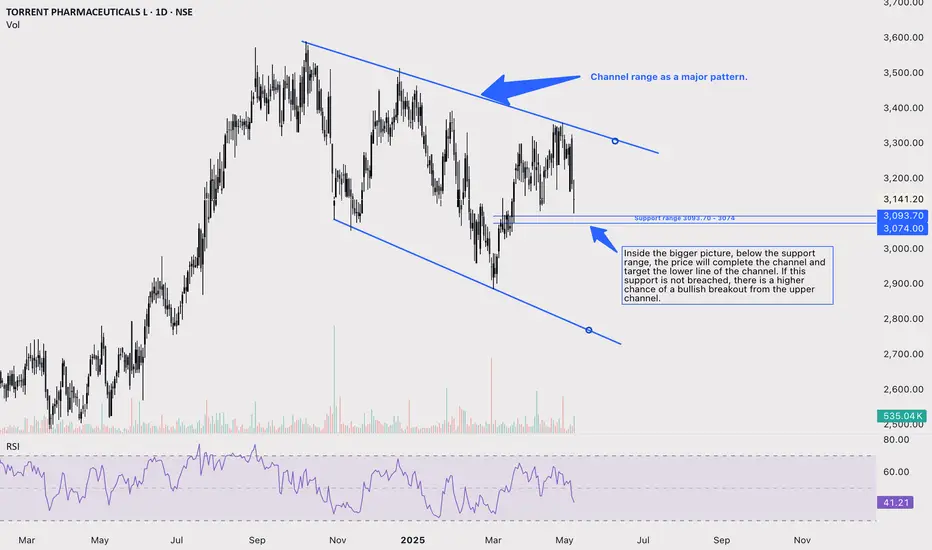
Torrent Pharma: Channel range targets.On the daily chart, Torrent Pharma is forming a channel, which has given a rejection on the upper channel line. Now the immediate support range is between 3093.70 and 3074, where a short side entry is possible on breakdown for the target of the lower channel line.
Inside the bigger picture, below the support range, the price will complete the channel and target the lower line of the channel. If this support is not breached, there is a higher chance of a bullish breakout from the upper channel.
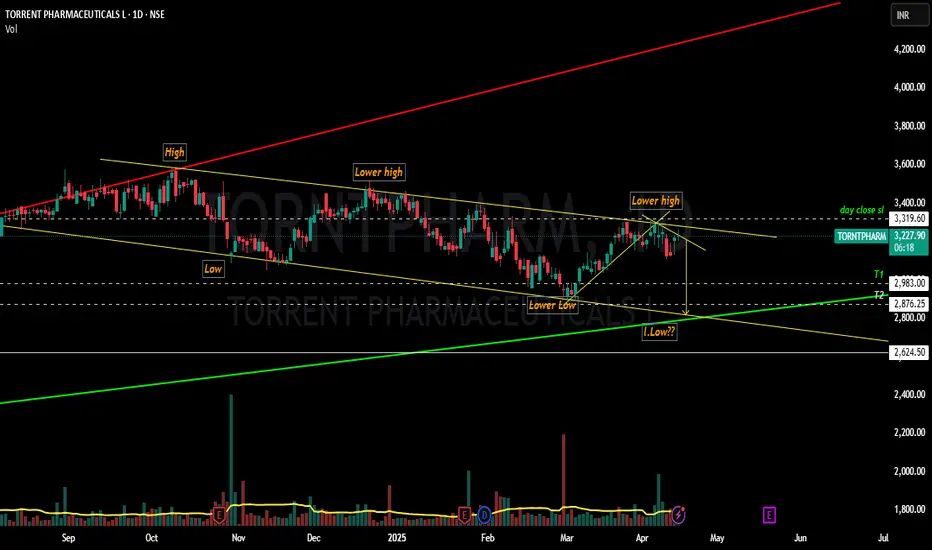
TORNTPHARM Final Bearish move before bulls entry????Yesssss!!!! Chart patterns suggest me the above titled opinion...
TORNTPHARM has been travelling in a Ascending Expanding channel pattern IN A BULLISH MODE MAKING SERIES OF HIGHER HIGHS AND HIGHER LOWS... (shown below)
Inside the bullish pattern , it is now currently in the downward phase that too inside rectangular descending channel pattern making a SERIES OF LOWER HIGHS AND LOWER LOWS....
It's moving like a written script till now....let's wait and watch whether the director(market) has any twist in the script or not!!!
This is just my opinion....not a tip nor advice!!!!
Thank you!!!!!!!
TORNTPHARM 1. HH formation
2. Weak buyers were removed at every up move
3. After R, SL can be reduced
4. Strict SL
## TORNTPHARM Price AnalysisTorrent Pharmaceuticals (TORNTPHARM) is currently trading near ₹3,254, maintaining a strong uptrend over the past several years. The stock has delivered a return of approximately 165% from July 2020 to November 2024, including a stock split, highlighting its consistent long-term growth.
**Valuation and Fair Value**
TORNTPHARM is trading well above its estimated intrinsic value. Independent valuations suggest a fair value in the range of ₹1,560 to ₹1,940 per share, meaning the current market price is overvalued by about 40%. The price-to-earnings (PE) ratio stands at approximately 59–66, which is significantly higher than the sector average of around 49, indicating a premium valuation. The price-to-book (PB) ratio is also elevated at 16, compared to the sector average of 6.29.
**Recent Performance**
The stock has shown positive momentum in the short term, with returns of 3.5% over the past week and 5.7% over the past month. Over the last year, TORNTPHARM has gained nearly 28%, and over three years, the return is more than 128%. Despite some volatility, the stock has outperformed many of its peers and the broader market.
**Fundamental Trends**
Torrent Pharma’s India business, which constitutes the bulk of its revenue, grew by 12% in Q3 FY25, driven by strong performance in branded generics. However, the company faces challenges in international markets, particularly the US, due to regulatory headwinds and pricing pressures. Revenue growth over the past five years has averaged 7% annually, slightly below the industry average, but net income growth has been robust at over 30% per year, outpacing peers.
**Analyst Outlook**
Analysts have a moderately positive outlook, with a one-year price target averaging around ₹3,600, and a range between ₹2,959 and ₹4,200 . About 68% of analysts currently rate the stock as a buy.
**Dividend and Market Cap**
The dividend yield is 0.86%, which is above the sector average, and the company’s market capitalization is approximately ₹1.1 lakh crore, placing it among the larger players in the Indian pharmaceutical sector.
**Summary**
TORNTPHARM has demonstrated strong long-term price appreciation and profitability, but it is currently trading at a significant premium to its estimated intrinsic value. Short-term technicals are mixed, with some bullish undertones, but caution is warranted due to high valuation multiples. The company’s growth is primarily driven by its domestic business, while international operations face ongoing challenges. Analyst sentiment remains positive, but the upside may be limited unless earnings growth accelerates or valuation multiples contract.
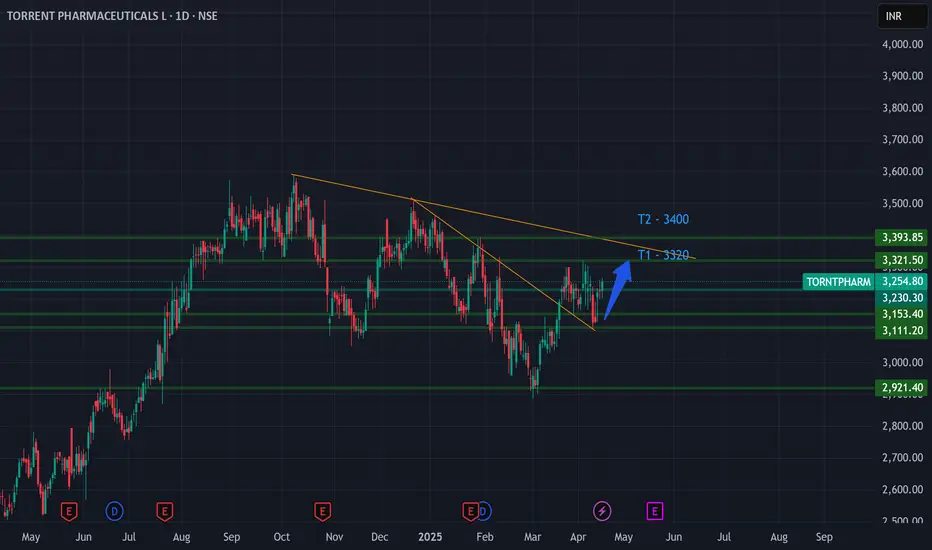
Looks like a good long opportunityThe stock has potentially broken above the short-term descending trendline, signaling a bullish reversal. Current support is near ₹3,180, with resistance at ₹3,320 (recent high). A sustained move above ₹3,320 could target ₹3,450 or higher if momentum continues.
Entry: Enter a long position if the price holds above ₹3,200
Stop Loss: Place a stop loss below ₹3,170 to protect against a false breakout.
Target: Initial target at ₹3,320, with a secondary target around ₹3,400, based on recent highs and price forecasts.
Risk Management: Watch for broader market trends and pharma sector performance, as tariffs could impact sentiment.
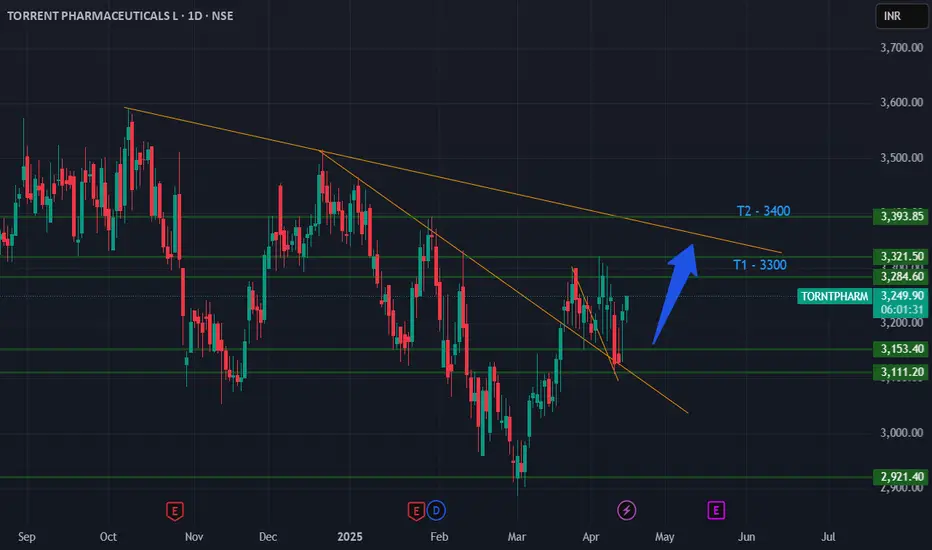
TORNTPHARM Bullish Breakout: Targeting ₹3300 & ₹3400 from CMP ₹Current Market Price (CMP): ₹3245
Target 1 (T1): ₹3300
Target 2 (T2): ₹3400
Stop Loss (SL): ₹3180 (below recent swing low for risk management)
Timeframe: Daily/Weekly
Trade Type: Long (Buy)
Technical Analysis
Trend Analysis:
- TORNTPHARM is in a steady uptrend, supported by higher highs and higher lows on the daily chart.
- The stock is trading above its 50-day and 200-day EMAs, indicating bullish momentum.
Key Levels:
- Support: ₹3200–₹3180 (recent swing low and near 50-day EMA).
- Resistance: ₹3300 (psychological level and minor resistance), ₹3400 (previous high and key resistance zone).
- A breakout above ₹3300 could accelerate momentum toward ₹3400.
Indicators:
Chart Patterns:
- The stock is forming a bullish continuation pattern (consolidation near highs), with a potential breakout above ₹3250–₹3270.
- A strong close above ₹3250 could confirm the move toward T1 and T2.
Trade Setup
Entry: Buy at CMP ₹3245 or on a breakout above ₹3250 with strong volume.
- Target 1: ₹3300 (1.7% upside, short-term target).
- Target 2: ₹3400 (4.8% upside, medium-term target).
- Stop Loss: ₹3180 (1.9% downside risk, below support zone).
- Risk-Reward Ratio: ~1:2.5 (favorable for swing trading).
Rationale
- TORNTPHARM is benefiting from strong fundamentals in the pharmaceutical sector, with consistent revenue growth and positive market sentiment.
- Technicals indicate a continuation of the bullish trend, with ₹3300 and ₹3400 as achievable targets based on prior resistance levels.
- The stop loss at ₹3180 protects against a potential trend reversal or pullback to stronger support.
Risk Management
- Position size: Limit risk to 1–2% of capital based on the ₹65 stop loss (₹3245 - ₹3180).
- Monitor for high volatility around key resistance levels (₹3300 and ₹3400).
- Exit if the stock breaks below ₹3180 on a daily close or shows signs of bearish divergence on RSI/MACD.
Additional Notes
- Sector Context: The Indian pharma sector is showing resilience due to export growth and domestic demand. TORNTPHARM’s strong product portfolio supports the bullish outlook.
- News Catalyst: Keep an eye on quarterly earnings or regulatory updates that could impact price movement.
- Time Horizon: 2–4 weeks for T1, 4–8 weeks for T2, depending on market conditions.
Disclaimer: This is not financial advice. Conduct your own research and consult a financial advisor before trading. Past performance does not guarantee future results.
Inverse H&S Forming on Daily TF – on #TorrentPharmaInverse H&S Forming on Daily TF – Price Testing Resistance Trendline. What’s Next?
An Inverse Head & Shoulders (H&S) pattern is taking shape on the daily chart, suggesting a potential bullish reversal. Price is now testing a key resistance trendline—will it break through?
🔹 Bullish Confirmation: A breakout above resistance could confirm the pattern, targeting higher levels.
🔹 Bearish Rejection: If price gets rejected, the setup may fail, leading to a retest of nearest support.
Key Levels: Neckline (resistance) & trendline breakout zone. Thoughts? #PriceAction #TradingSetup
range break out in torrent pharmaas pharma index trying to break range so stock will also follow to break their range hence torrent pharma will also follow.
