Trade ideas


TORNTPHARM, BEAUTIFUL CHART FOR LEARNING & EARNING (CHART# 358)TORNTPHARM, has beautiful text book chart where resistance zone turned into support and then again acted as resistance.
Also this chart shows DARVAS box breakout and then stock reaching target.
For tomorrow, if this manages to breakout at 2642, then can move up nicely to pink line. MUST HAVE ON WATCHLIST.
Watch my other charts to understand simple price action used for all of the analysis. Keep your charts simple and free from lagging indicators. Reach out if you wish to learn powerful technical analysis based on simple price action.
Thanks
Piyush Gupta

TORNT PHARM ANALYSISIT MAY CAN BECOME AN HIGH CONVENTIONAL TRADE. RIGHT NOW IT IS MAKING A TRIANGLE PATTERN. BUT IF WE SEE THERE IS AN BEARLISH CANDLE WHICH LEADS TO AN BEARISH ENGULFING BUT THE SIZE OF CANDLE IS TOO BIG WHICH KILLS ALL THE ENTRY & CORRECTION TOO. WE CAN SEE A PULL BACK IN THIS SETUP IF TRIANGLE BREAKS UPWARDS.
ANY PROBLEMS YOU ARE FACING RELATED TOO BROKER FOR FIND ANY HIGH CONVENTIONAL TRADE MY DM IS ALWAYS OPEN AND ITS FOR FREE FOR EVERYONE.

NSE:TORNTPHARM
DISCLAIMER : . I am not a SEBI Registered analyst.
All chart analysis I publish are educational and information purposes only

NSE:TORNTPHARM
DISCLAIMER : . I am not a SEBI Registered analyst.
All chart analysis I publish are educational and information purposes only

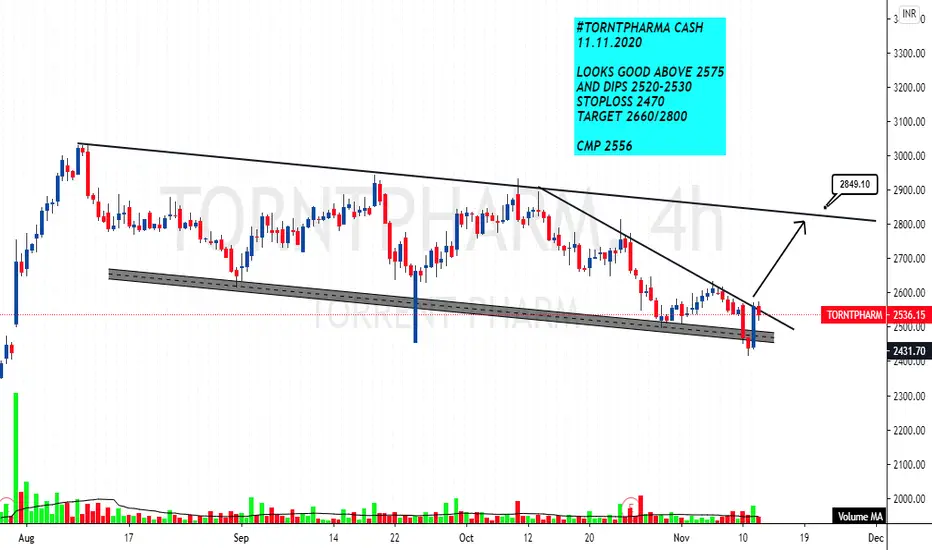
#TORNTPHARMA CASH : LOOKS GOOD ABOVE 2575#TORNTPHARMA CASH
11.11.2020
LOOKS GOOD ABOVE 2575
AND DIPS 2520-2530
STOPLOSS 2470
TARGET 2660/2800
CMP 2556

pullback may workStocks trade near pullback of last time trading breakout , its high probability it may go up


Tornt Pharma#Torntpharma followup... finally the move came in as expected few days back, see linked chart...

TORNTPHARM Descending triangle type patterngood upmove may seen above this tradeline BO with volume
here resistance become support
up trending stock and price above all important moving average


TORNTPHARM LOOK OUT FOR THESE LEVELS!!! ALL THE LEVELS ARE MARKED ON CHART, RED ZONES DENOTES SUPPLY ZONES AND GREEN IS FOR DEMAND ZONE .
PRICE HAS BEEN MAKING LOWER LOWERS; HIGHER TIME-FRAME FORMED A PARALLEL CHANNEL,
The indicator used:
1) Daily Lines plots Daily 20 (BLACK) & 50 EMA (GREY) on lower time frame charts
2) TE-REKAB
- PB : PULLBACK
If you like the analysis, do leave a like and follow for more such content coming up.
The analysis is my POV, hope you got bucks in your pocket to consult a financial advisor before investing :P :)
HAPPY TRADING!


Tornt Pharma#torntpharma... Keep an eye near trendline... expecting an up move but needs that sign in initial candles.

TORNTPHARMA EARNINGS PLAY OPTION STRATEGY: 26 OCT 20Earnings play: Max 3 day trade
Buy-
+1-2500 PE- 8
+1-22650 PE- 20.5
+1-2850 CE- 25
+1-3000 CE- 8.94
Sell-
-2-2600 PE - 20.5
-2-2900 CE - 18.95
Net Credit - +10305
Cap Req - 2.9L approx
BE - 2529-2971
Max Profit - 35305
Max Loss - 14695
POP - 88%

Torrent PharmaThe pattern suggests not to SHORT, as per my observation. Levels are mentioned in the chart.

