TorrentPharma - Predicting Breakout Torrent Pharma is creating ascending triangle on Weekly chart. Predicting before breakout. #Pharma #BankNifty #NiftyPharma
Trade ideas

Torrent PharmaAnalysis on Daily Basis
1. BOS
2. CHoCH
3. Sideway Channel
Potential Downside after sideways channel breakout downside.

TORNTPHARM BULLISH HEAD AND SHOULDERS PATTERNBuy Above : 3250
Tg : 3730
CBSL : 3000
R:R – 1:2
This is not an investment advice and also please note this is only for education purpose.
So before investing any single rupee, please do your own research according to your risk taking capacity and after that do invest and book profits on right time.

Short Term Trade Torrent PharmaOn 4 hrly chart, the level of 1909 had been a support zone in the last two months,
There is a breakdown with good volume and a strong breakdown candle .
Tgt and sl are marked on chart

torrentpharma - sell on risesell around 1967 upto 1980
sl close above 1983.1
easy tg 1920
tg2 - 1896
Disclaimer : This is my personal analysis for study purpose not intended for trading.

torrent pharma - buy Buy near 1933
sl close below 1916
easy tg 1960
tg2 - 1990
Disclaimer : This is my personal analysis for study purpose not intended for trading.


Trendline BreakoutPlease look into the chart for a detailed understanding.
Consider these for short-term & swing trades with 2% profit.
For BTST trades consider booking
target for 1% - 2%
Please consider these ideas for educational purpose
Comment below if you are looking for any answers.

Torrent Pharma Short term trade Breakout (Long)Breakout on Torrent Pharma
On daily chart most of the candle body is above the resistance line (yellow line)
Stochastic crossing into OB zone indicating good momentum
Volume on the bullish leg is higher than that during consolidation
tgt and sl are marked on the chart

Torrent Pharma Cmp 1651 Bearish Engulfing Candle & RSI BDTorrent Pharma Cmp 1651 dated 9-5-2023
1. Bearish Engulfing Candle @ Resistance
2. RSI breakdown
Sell below 1645 for target 1630-1615-1600-1580
1560 SL 1680

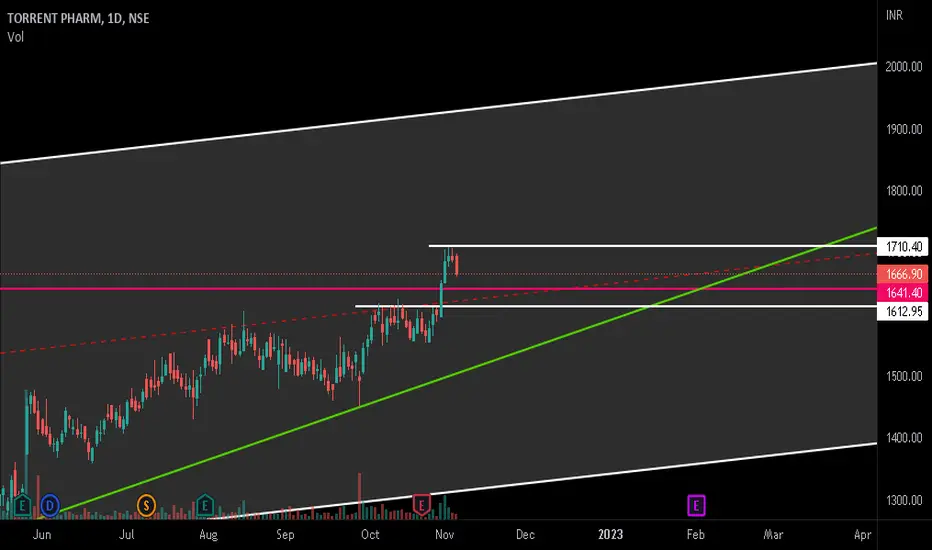
TORRENT PHARMA POSSIBLE BREAKOUT Torrent pharma currently trading near it's strong horizontal resistance if break and close above on daily candle so after we can go long in it for the target of 1664 and 1694 with a stop loss of 1604 below close on daily candle basis.

Torrent Pharma - Looking Weak - CandleStick AnalysisNSE:TORNTPHARM has made a bearish harami on weekly candle. If 1507 is taken out on downside and a close comes below that, I would be looking for 1481, 1461 and 1452 levels on the downside.
Depending upon your risk appetite, enter the trade either in cash or in options. Let's see how the story develops. Best wishes!
Disclaimer -
- The opinions expressed here are my own. This is for my own records as well as what I see on charts.
- If you are referring to this, please keep in mind that it is only for educational and research purposes.
- Past performance is no guarantee of future results.
- You must accept responsibility for any decision you make. DO NOT TAKE THIS AS AN INVESTMENT RECOMMENDATION.
- It's your hard-earned cash. Trade / Invest wisely, keeping in mind your trading style, goals and objectives, time horizon, and risk tolerance.
- Before investing, conduct your own research and consult with a financial advisor.
TIA!

Torrent Pharm SwingWeekly and Daily TF looks bullish and structure has shifted and it is ready for impulsive move

Positional Short on Torrent Pharma-Timeframe March 2023NSE:TORNTPHARM CMP 1489, Target 1350, Time frame march 2023. Expecting the Torrent pharma to trade at the levels of 500 by march 2023. Based on the continuous downtrend for the last 3 consecutive months , and expecting to touch the lower end of the Bollinger band . Expecting the target to hit within next 1month . One can trade sell futures at CMP or buy put options in Torrentpharma with the target given . The view is mine . It’s not a buy : sell recommendation.

Falling wedge pattern breakout in TORNTPHARMTORNTPHARM
Key highlights: 💡⚡
✅On 1D Time Frame Stock Showing Breakout of Falling wedge Pattern.
✅ Strong Bullish Candlestick Form on this timeframe.
✅It can give movement up to the Breakout target of 1630+.
✅Can Go Long in this stock by placing a stop loss below 1475-.
✅breakout this can give risk:reward upto 1:4+.

Falling wedge pattern reversal in TORNTPHARMTORNTPHARM
Key highlights: 💡
✅On 1D Time Frame Stock Showing Reversal of Falling wedge Pattern .
✅ It can give movement upto the Reversal target of above 1505+.
✅There have chances of Breakout of resistance level too.
✅ After Breakout of resistance level this stock can gives strong upside rally upto above 1630+ .

TorntPharm#Torntpharm create a #range and now wait for the #breakout any side and we got best #move we have seen.

Double Bottom pattern Breakout in TORNTPHARMTORNTPHARM
Key highlights: 💡⚡
📊On 15 Time Frame Stock Showing Breakout of double bottom Pattern .
📊It can give movement up to the Breakout target of above 1645+.
📊Can Go Long in this stock by placing a stop loss below 1623-.
📊 breakout this can give risk:reward upto 1:7+

TORRENT PHARMA | W Pattern & ATH BO | Minm 35%NSE:TORNTPHARM
All Time High Breakout
W Pattern Breakout
Price moving up in Rising Channel
Targets : 1890 - 2030 - 2250
Upside : 35%
SL : 1550
Time Frame : 3-6 Months
RSI in Bullish Zone & Weekly EMAs acting as Support

Torrent Pharma Big Breakout torrent pharma crossed big resistance
52 week high today
keep on radar for entry with risk reward in favor
Weekly Positive RSI 70+
last two days Spurt in volume too
Expecting big move onwards

Torrent Pharma breakout.A cup and handle pattern is forming on torrent pharma charts, suggestive of a breakout to new highs from this levels.

TORNTPHARM - Cup n Handle breakout - 7% upside potentialTORNTPHARM has given Cup n Handle breakout at 1620 levels with good volumes.
Target 1:1675+
Target 2: 1765+
SL: Hrly candle close below 1610
Time frame: 1 wk to 2 wks
