Swing Opportunity in Torrent PharmaGo Long above 2899.1 for Targets of 3013.5, and 3127.9 with SL 2784.7
Reasons to go Long :
1. On a daily timeframe if we draw the Fibonacci retracement tool from recent swing low (point A) to recent swing high (point B) then we see stock took support from 0.5 Fibonacci level.
2. A bullish chart pattern, Double Bottom (W pattern) is formed around 0.5 Fibonacci level.
3. Also there is a strong demand zone (marked with purple color), from which the stock initially faced resistance but now is taking support and moving up.
Trade ideas

W pattern reversalit takes good support at trendline
And it makes w pattern witch is confirmation for buying


Torrent pharma: Rectangle pattern (Time frame-1Week)Torrent pharma: Rectangle pattern (Time frame-1Week)
.
Chart time frame -1 Week
Trade type -Short term
Duration - 2 months
Entry - 3250
Target 1 - 3800
Stoploss - 3000
Risk : Reward - 1:2.2
Leave us a comment or like to keep our content for free and alive.
Have a great day everyone!
Disclaimer: All charts are purely for educational and information purpose only. I am not a SEBI registered Investement advisor. Please Trade and invest based on your knowledge and risk profile.

Go long on Torrent PharmaIt’s in a consolidation phase and volumes have dried up, could give a breakout soon. My target would be around ₹3250.
I am not a sebi registered analyst.
Charts are only for educational purpose.

Torent pharma 3183 SL 3163 TGT 3215 Suggestions are based on my analysis only. Please do your analysis before taking any trade.


TORRENT PHARMAMarket Cap
₹ 52,460 Cr.
Current Price
₹ 3,100
High / Low
₹ 3,227 / 2,311
Stock P/E
41.6
Book Value
₹ 345
Dividend Yield
1.13 %
ROCE
17.6 %
ROE
23.3 %
Face Value
₹ 5.00

Torrent Pharma Reverse Head and ShoulderKindly consult your financial advisor before trading. Thank You.

Double BOTTOM - SIMPLE AND POWERFULDear friends,
I explained everything in chart.
Happy investing.
Regards,
Indian Ox

TORRENT POWER LOOKS GOOD BUY 3070-3090 FIRST TARGET 3130 2ND TARGET 3170 SL 3040 .... volume supportable and i can clearly see the upmove

Torntpharm - On Support Torntpharma: From past 6 months trading in a parallel channel - trading baove 50/100/200 ema's
Bounce back after testing 2854 low & currently taking support from lower channel, 50 & 100 EMA's.
However 2952 and 3020 will be strong resistance levels based on previous history.
Watch these levels - Incase if any correction in NIFTY and Torntpharm breaks the lower trend line in channel - can go for short.
Please spend time and do own research before investing.

Torrent pharmaIntraday trade for study purpose.. STUDY N TRADE
Entry , Stoploss n targets mentioned in the charts.
DISCLAIMER:- I’m not SEBI registered research analyst or investment adviser. All stocks & information given is for educational purpose only. Consult with your financial advisor before taking the trade on my views given here.


Torrent PharmaceuticalsCup and handle formation in process
Trendline being broken
If breaks 2894, initiate long
Hold for 15% returns
Strong support at 2690 levels

TORNTPHARM - Intraday watchlistwatchlist for intraday. Can breakout/breakdown
Trade with your own analysis


TORNTPHARM July 21 Keep the lines will go little short and then long .. so you can earn in both chances.

Torrent pharma - bullish tradeBullish pole and flag pattern
Rounding bottom pattern in weekly chart
Stock looks bullish for 2880 and 3028 targets


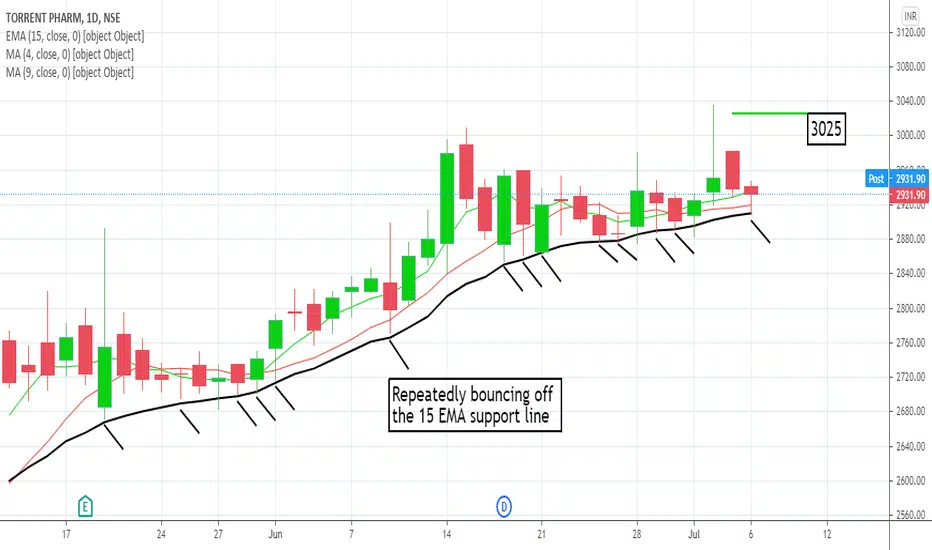
TORNTPHARM: Quick target of 302515-day EMA has acted as a strong support for Torrent Pharma. Today the price has again bounced off the 15 EMA with a small hammer pattern indicating bullish bias. The 4-day SMA is steadily moving above the 9-day SMA which is again a bullish indication. I will look for a very short term target of 3025.
torrent pharma at breakout areaTorrent can give a breakout after returning to the pattern boundary after almost 1 year.
Stay cautious to avoid shakeouts here, might test patience.
