TVS Supply chainTVSSCS : the downtrend script and looking for break upward, if break the trend technical resistance and supports are mentioned in this chart. This is educational purpose chart and your comments are most welcome!
TVSSCS trade ideas

"growth partner of choice"TVSSCS – Steady Base + MACD Crossover | Watch for Breakout Above ₹140
📝 Description / Caption:
TVS Supply Chain (TVSSCS) is showing early signs of recovery after a prolonged downtrend.
Here’s what stands out on the weekly chart:
🔸 MACD crossover after long downside – early momentum shift
🔸 Higher lows forming after bottoming near ₹110
🔸 Volume building gradually, though a breakout spike is awaited
🔸 Stock is testing falling trendline resistance – breakout above ₹135–₹140 could confirm trend change
🔸 Monthly close above ₹140 will be a key bullish trigger
Support zones to watch: ₹126, ₹128.75, and ₹131.75
As long as the stock holds above ₹126, structure remains constructive.
📌 Not a recommendation – just sharing a learning-based view.
Would love to hear what others think about this setup!
TVS Supply Chain Solutions Ltd
About
TVS Supply Chain Solutions provides supply chain management services for international organizations, government departments, and large and medium-sized businesses.
Key Points
Business Segments
1) Integrated Supply Chain Solutions (55% in H1 FY25 vs 40% of FY22): The company provides sourcing and procurement, integrated transportation, logistics operation centers, in-plant logistics operations, finished goods, aftermarket fulfillment, and supply chain consulting. The segment revenue grew by 40% between FY22 and FY24, driven by new business development and expansion in existing customer engagements supported by strong execution.
2) Network Solutions (45% in H1 FY25 vs 60% in FY22): It provides global forwarding solutions that involve managing end-to-end freight forwarding and distribution across ocean, air, and land, warehousing, and time-critical final mile solutions, etc. The segment revenue declined by 28% between FY22 and FY24, due to a decline in freight rates and geo-political tensions.
Asset Light Business Model
The company operates an asset-light business wherein its warehouses and vehicles are operated through leases with its network partners which enables the company to increase its volume of operation across geographies.
Source: Screener.in
Fundamental Note:
TVS Supply Chain is part of the growing logistics sector, with scale, client stickiness, and improving operating leverage. As the broader infra/logistics theme plays out, technicals aligning above ₹140 could support medium-term rerating.

TVS Supply Chain: BO attempt after 6 Month Consolidation.This Supply Chain Giant is attempting to break out. After 6 Months of Consolidation - Is it Time to Load Up? Let's analyse today's Idea.
Price Action Analysis:
Current Market Structure:
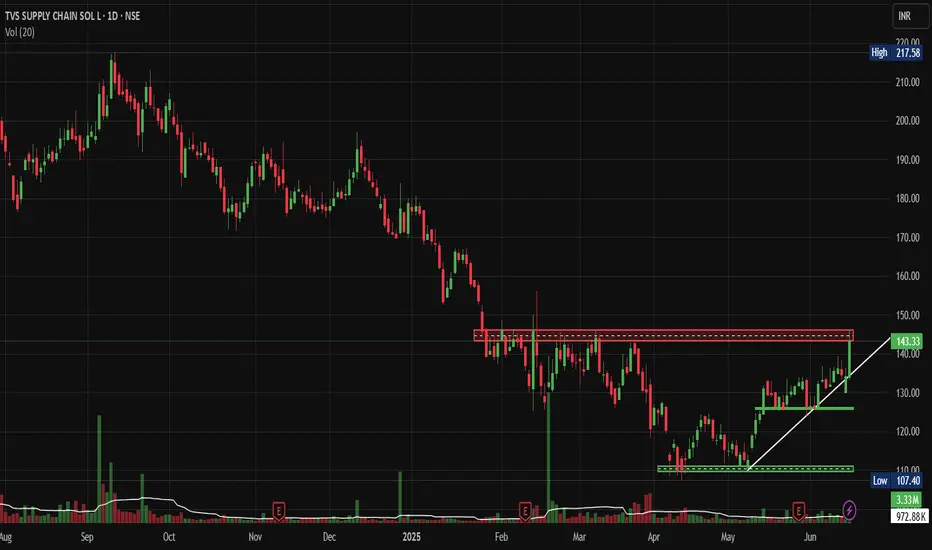
• Stock is currently trading at ₹143.33, showing a strong +6.83% gain
• Price has broken above a key resistance zone around the ₹140 level
• Clear uptrend formation with a higher highs and higher lows pattern emerging
• Recent breakout attempt from a prolonged consolidation phase
Historical Price Movement:
• Stock witnessed a sharp decline from highs of ₹217+ in late 2024 to lows around ₹107
• Extended consolidation phase from February to May 2025 between ₹110-145 levels
• Current breakout attempt suggests potential trend reversal from bearish to bullish
Volume Spread Analysis:
Volume Characteristics:
• Significant volume spike visible during the recent breakout session
• Volume of 3.33M is substantially higher than the 20-day average of 972.88K
• Volume confirmation supporting the price breakout attempt above resistance
• Previous volume spikes coincided with major price movements
Volume Price Relationship:
• Healthy volume-price relationship during the current upward move
• Relatively lower volumes accompanied earlier decline phases
• Current breakout attempt volume suggests institutional participation
Key Technical Levels:
Support Levels:
• Primary Support: ₹130-132 (previous resistance turned support)
• Secondary Support: ₹120-125 (consolidation zone low)
• Major Support: ₹110-115 (multi-month consolidation bottom)
Resistance Levels:
• Immediate Resistance: ₹150-155 (psychological level)
• Medium-term Resistance: ₹165-170 (previous swing high)
• Major Resistance: ₹185-190 (Fibonacci retracement level)
Base Formation:
• Rectangle consolidation pattern formed between ₹110-145 levels
• Base duration: Approximately 4-5 months (February to May 2025)
• Breakout from this base suggests potential for sustained upward movement
Technical Patterns:
Primary Patterns:
• Rectangle/Box pattern completion with upward breakout attempt
• Potential inverse head and shoulders pattern on a longer timeframe
• Ascending triangle formation in recent weeks before the breakout
Trend Analysis:
• Short-term trend: Bullish (breakout confirmed)
• Medium-term trend: Transitioning from bearish to bullish
• Long-term trend: Still in recovery phase from major decline
Trade Setup and Strategy:
Entry Strategy:
• Aggressive Entry: ₹143-145 (current levels on any minor pullback)
• Conservative Entry: ₹135-138 (on retest of breakout level)
• Volume confirmation is required for any entry
Position Sizing:
• Risk 1-2% of portfolio capital on this trade
• Position size calculation: Portfolio Value × Risk % ÷ Stop Loss Distance
• Example: For ₹1,00,000 portfolio with 2% risk = ₹2,000 risk capital
Risk-Reward Calculation:
• Risk-Reward Ratio: Minimum 1:2 preferred
• Expected risk per share: ₹15-20 based on stop loss placement
• Potential reward: ₹30-40 per share to the first target
Exit Strategy:
Profit Targets:
• Target 1: ₹165-170 (15-20% upside) - Book 40% position
• Target 2: ₹185-190 (30-35% upside) - Book 40% position
• Target 3: ₹200+ (40 %+ upside) - Trail remaining 20% position
Stop Loss Levels:
• Initial Stop Loss: ₹125-128 (below consolidation support)
• Trailing Stop: Move to breakeven once Target 1 is achieved
• Final Trail: Use 10-day EMA or ₹10-15 trailing stop
Risk Management Framework:
Risk Control Measures:
• Maximum loss per trade: 2% of total capital
• Position sizing based on stop loss distance
• No averaging down if the trade goes against the initial thesis
• Exit if the technical structure breaks down
Portfolio Allocation:
• Maximum exposure to single stock: 5-8% of portfolio
• Sector allocation limit: 15-20% to logistics/supply chain
• Maintain diversification across market caps and sectors
Sectoral Analysis:
Logistics and Supply Chain Sector:
• The sector has shown resilience post-pandemic disruptions
• Growing e-commerce and digitalization are driving demand
• Government infrastructure push benefiting logistics companies
• Increasing focus on supply chain optimization across industries
Sector Positioning:
• NSE:TVSSCS is positioned in the growing third-party logistics market
• Beneficiary of Make in India and manufacturing growth
• Automotive sector recovery supporting the company's core business
Fundamental Backdrop:
Business Overview:
• Leading third-party logistics and supply chain solutions provider
• Strong presence in automotive, consumer goods, and industrial sectors
• Integrated service offerings including warehousing, transportation, and value-added services
Growth Drivers:
• Expansion in new geographies and service offerings
• Technology-driven efficiency improvements
• Growing outsourcing trend in supply chain management
• Recovery in the automotive sector supporting traditional business
Market Outlook and Catalysts:
Positive Catalysts:
• New client acquisitions and contract wins
• Capacity expansion announcements
• Favourable government policies for the logistics sector
Risk Factors:
• Economic slowdown affecting industrial demand
• Fuel price volatility is impacting transportation costs
• Competitive pricing pressure in the logistics industry
• Global supply chain disruptions
My Take:
TVS Supply Chain Solutions presents a compelling technical setup with the recent breakout attempt from a multi-month consolidation. The combination of strong volume confirmation, supportive sectoral trends, and improving fundamental backdrop makes this an attractive opportunity for Short to medium-term investors. However, proper risk management and position sizing remain crucial for the successful execution of this trade setup.
Keep in the Watchlist.
NO RECO. For Buy/Sell.
📌Thank you for exploring my idea! I hope you found it valuable.
🙏FOLLOW for more
👍BOOST if you found it useful.
✍️COMMENT below with your views.
Meanwhile, check out my other stock ideas on the right side until this trade is activated. I would love your feedback.
Disclaimer: "I am not a SEBI REGISTERED RESEARCH ANALYST AND INVESTMENT ADVISER."
This analysis is intended solely for informational and educational purposes and should not be interpreted as financial advice. It is advisable to consult a qualified financial advisor or conduct thorough research before making investment decisions.
TVSSCS - Triangle into a flag!The following points are of note:
------------------------
1. A symmetrical triangle formed as a near-term bottom for the stock
2. After breaking out of the triangle, price is consolidating in a rectangular range
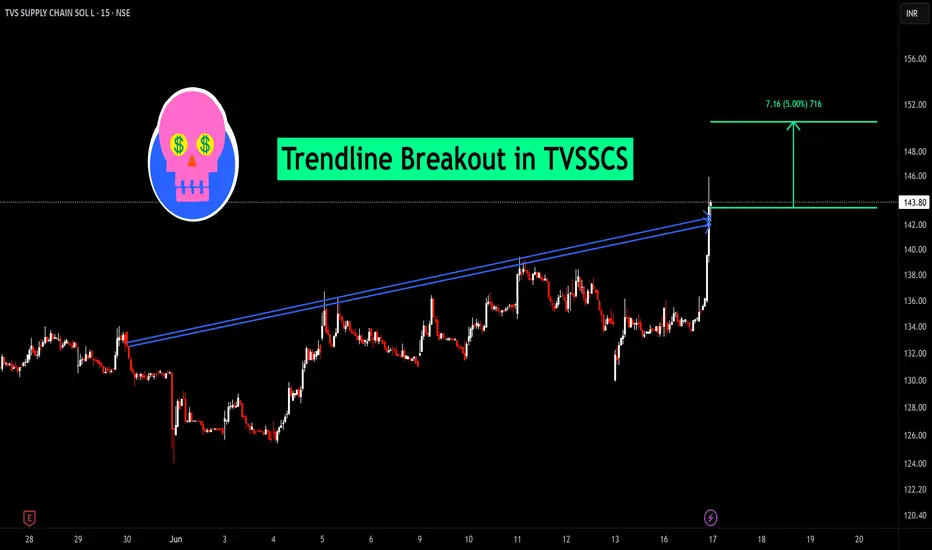
3. A pole and flag formation, when broken out can give targets of 143, 147, with SL of 123
Disclaimer:
This is NOT a trading recommendation, only my observation. Please do your own analysis before entering any trade.

BUY TODAY SELL TOMORROW for 5%DON’T HAVE TIME TO MANAGE YOUR TRADES?
- Take BTST trades at 3:25 pm every day
- Try to exit by taking 4-7% profit of each trade
- SL can also be maintained as closing below the low of the breakout candle
Now, why do I prefer BTST over swing trades? The primary reason is that I have observed that 90% of the stocks give most of the movement in just 1-2 days and the rest of the time they either consolidate or fall
Trendline Breakout in TVSSCS
BUY TODAY SELL TOMORROW for 5%
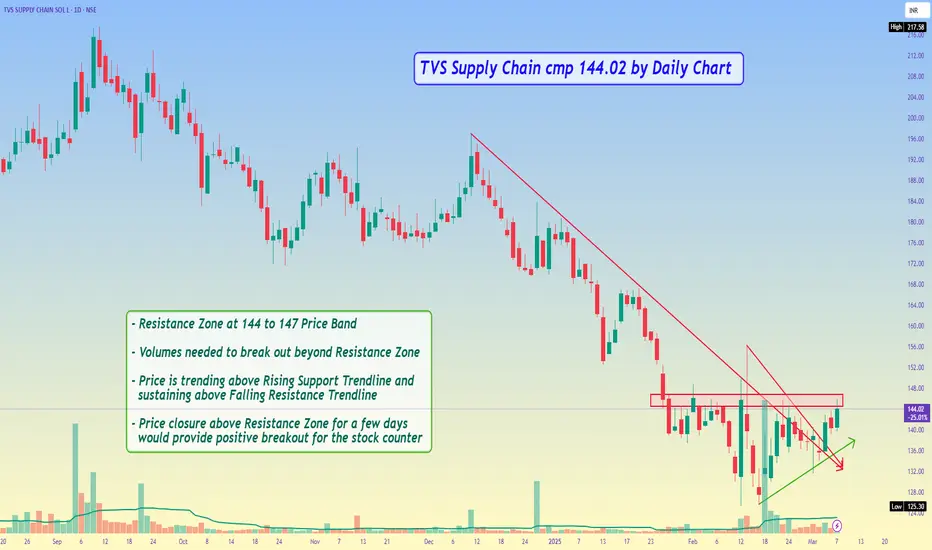
TVS Supply Chain cmp 144.02 by Daily Chart viewTVS Supply Chain cmp 144.02 by Daily Chart view
- Resistance Zone at 144 to 147 Price Band
- Volumes needed to break out beyond Resistance Zone
- Price is trending above Rising Support Trendline and sustaining above Falling Resistance Trendline
- Price closure above Resistance Zone for a few days would provide positive breakout for the stock counter
This Line connects the peaks of the price swingsforming a resistance and support level , the price makes a series of uptrend channal indicates a bullish sentiment in the market, price above 12 and 25 ema , a narrow channel may indicate a stronger trend

tvssupply chaintvssupply chain is now its good level , now lets watch it observe it and if it moves as per our level then grab it, hope it will give good returns

TVS SUPPLY CHAIN,TVS SUPPLY CHAIN is good stock and it will reach at our level around 176 to 180 its best buy with stoploss of 169 to 171, with a target of 259, it takes nearly 3 months for completing this move, lets wait n watch what will happen

TVSSCS-Inverted Head and shoulder— Near Breakout -DailyTVSSCS-Inverted Head and shoulder— Near Breakout -Daily
Name - TVSSCS
Pattern - Inverted head and Shoulder
Timeframe - Daily
Status - Breakout with good volume
Cmp - 206
Target - 257
SL - 201

TVS Supply Chain cmp 208.25 by Daily Chart view since listed*TVS Supply Chain cmp 208.25 by Daily Chart view since listed*
- Support Zone at 200 to 204 Price Band
- Heavy Volumes surge of demand based trading
- Bullish Head & Shoulder made with neckline at Support Zone
- Price supported by Volumes breakout riding well above Falling Resistance Trendline
- Daily basis : Support at 195 > 183 > 172 with Resistance at 217 > 229 > 242 > ATH 258

TVSSCS | Ascending Triangle BreakoutTVSSCS | Ascending Triangle Breakout
Hope this stock goes high after very long time and gives good returns

BUY TODAY SELL TOMORROW for 5%DON’T HAVE TIME TO MANAGE YOUR TRADES?
- Take BTST trades at 3:25 pm every day
- Try to exit by taking 4-7% profit of each trade
- SL can also be maintained as closing below the low of the breakout candle
Now, why do I prefer BTST over swing trades? The primary reason is that I have observed that 90% of the stocks give most of the movement in just 1-2 days and the rest of the time they either consolidate or fall
Symmetrical triangle Breakout in PUNJABCHEM
BUY TODAY SELL TOMORROW for 5%

TVS SUPPLY CHAIN SOL - Swing Trade Analysis - 21st April #stocksTVS SUPPLY CHAIN SOLUTIONS (1D TF) - Swing Trade Analysis given on 21st April, 2024
Pattern: ASCENDING TRIANGLE
- Volume Buildup at Resistance - Done ✓
- Resistance Breakout - In Progress
- Demand Zone Retest & Consolidation - In Progress
* Disclaimer
#tvs #niftyauto

TVS SCS Cmp 200.45 Trendline BO & VolumeTVS SCS Cmp 200.45 dated 20-2-2024
1. Trendline BO @ 205
2. RSI already done BO
3. Price Rise with Voulumes
Buy above 205 target 210-220-230-240-250 SL 180
It is just a view, please trade at your own risk.

Open Target - TVS Supply ChainEnter Trade at the Lowest Possible. Follow the Stoploss Strictly.
Follow me for more charts.

TVSSCS: Swing IdeaTVSSCS is swinging back after a quick rise and fall of 20%. It has taken support at the last opening point of the first listing day. Volumes rising for last 3 days. Doji a day before. RSI bounce back at 50.

TVSSCS: Volatile New Momentum StockTVS Supply Chain Solutions (TVSSCS) is the new listed IPO and few days ago broke out of its listing day resistance with great volumes and rose 28% in 3 days! Then it fell by 15% in next 4 days. Now it is taking support at 10EMA. Lets see if it will now rise again with momentum.

TVSSCSTVSSCS looking good after 200+.
wait for 4hr candle close above 200.
NOTE- Only for Education Purpose.
Please Give A Like If You Like
FOLLOW FOR MORE
