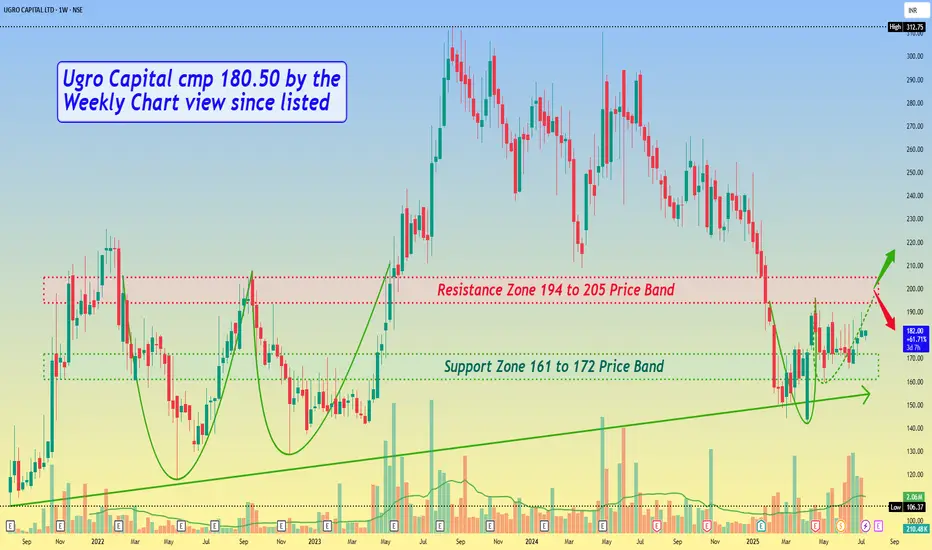
Ugro Capital cmp 180.50 by the Weekly Chart view since listedUgro Capital cmp 180.50 by the Weekly Chart view since listed
- Support Zone 161 to 172 Price Band
- Resistance Zone 194 to 205 Price Band
- Bullish Rounding Bottom 1st done and 2nd in completion stage
- Resistance Zone neckline will be a decent hurdle to cross for fresh breakout
- Volumes surging heavily by demand based buying and well above avg traded quantity
- Majority of the Technical Indicators of BB, EMA, SAR, SuperTrend, MACD, RSI are seen in positive trend
Trade ideas
UGRO CAPITAL#UGROCAP
TF: 1hr
Entry: Above 242
Targets: 251, 260, 270 (positional 300-320)
SL: 1 hr candle closing below 233
Logic Channel Break With Volume

Diverse Trading Strategies for UGRO Capital LtdUGRO Capital Ltd is currently exhibiting a symmetrical triangle pattern, characterized by converging trend lines drawn in black. This technical formation is indicative of a potential continuation or reversal pattern, often signaling an impending breakout, either upward or downward.
Within this chart pattern, the upper trend line serves as a short-term resistance zone, while the price action has encountered difficulties in surpassing this level. A counter-trendline, represented by a dotted black line, suggests an attempt to break free from the prevailing downtrend; however, the stock continues to face resistance from the upper trend line.
The stock has demonstrated notable resilience, establishing multiple support points, clearly identified by the blue line on the chart. These instances of price bounces indicate a consistent level of buying interest and present evidence of the stock's strength. The formation of higher lows during this period signifies a bullish sentiment, suggesting the potential for upward price movement. MACD & RSI values also denotes strong buying pressure and suggests a significant potential for price reversal.
Recent trading activity shows a significant surge in volume over the past two days, substantially exceeding the average trading volumes. This spike is a critical sign of accumulating buying pressure, further supporting the bullish outlook for UGRO Capital Ltd . Increased volume during price ascents often serves as confirmation of the strength of the momentum.
While the current technical indicators present a constructive outlook, a definitive breakout can only be confirmed when the stock price successfully clears the upper trend line resistance. Upon achieving this milestone, the next target of interest will likely be the established resistance level at 299, which could be revisited in the foreseeable future if bullish momentum continues.
Disclaimer: The information provided in this analysis is purely for informational and educational purposes and should not be construed as financial advice. Investors are strongly encouraged to consult with a qualified financial advisor or conduct thorough research prior to making any investment decisions.

Ugro capital is ready to give breakoutUgro capital is ready to give breakout, it has consolidated well, have taken support, now can burst anytime!
Finance companies are also bullish which might give more boost to it.

READY FOR BIG MOVE:- STRONG CLOSING AFTER HUGE CONSOLATION ✅The stock is showing strength with a strong candle near the resistance after a huge consolidation, signaling a potential breakout. MACD histogram is positive, supporting the breakout with bullish signals. Increase in volume confirms strong buying interest and bullish sentiment, supporting the breakout scenario.
✅A leading player in the financial services sector, the company has a strong presence in the Indian market. Continuous innovation and expansion provide a competitive edge

Long UGROSellers are not able to push price down.
price is sustaining above ema 20 on a weekly and monthly timeframe
decent fundamentals
cmp 281
sl 250
target 370

UGRO Capital - NBFC TailwindsOne of the NBFC's which has guided for the highest growth rates
Long above 255 with a SL 5% below cost..
A cross of the 200EMA could lead to a powerful move.
For now there is no other technical breakout but a break above 275 could lead to a trendline breakout above which momentum could slowly start kicking in.
Most NBFC's had a great week last week..so a follow thru could signify sector tailwinds.

Ugrocap - is this preparing for next rally?I think its time up, may be in few weeks UGRO will start next rally.
Just beginner eye, so may go wrong completely also.

UGROCAP - should do very good from hereNSE:UGROCAP
cmp 284
This ought to perform splendidly in coming months
The objective of this analysis is knowledge sharing and education. There isn't any buy or sell advise in this article. Every stock is held for a short to medium amount of time and is positional.
It is expected of each person to carry out independent research and evaluation to ascertain whether my perspective is consistent with your studies.

Amazing breakout on Weekly / Daily Timeframe - UGROCAPCheckout an amazing breakout happened in the stock in Weekly timeframe, macroscopically seen in Daily timeframe. Having a great favour that the stock might be bullish expecting a staggering returns of minimum 25% TGT. IMPORTANT BREAKOUT LEVELS ARE ALWAYS RESPEECTED!
NOTE for learners: Place the breakout levels as per the chart shared and track it yourself to get amazed!!
#No complicated chart patterns
#No big big indicators
#No Excel sheet or number magics
TRADE IDEA: WAIT FOR THE STOCK TO BREAKOUT IN LOWER TIMEFRAME AND RETRACE IF NEEDED. SL IS NEARER SUPPORT ZONE IN Daily TIMEFRAME.
PS: No new Nifty500 script can escape from me when making a breakout. :-)

BUY URGOCAP SWING TO SHORTTERM INVESTStock made a huge consolidation and made breakout and now Back to Breakout area for retracement.
Conservative Traders wait for Proper PriceAction and execute your trades.
Always Maintain proper RiskReward. Here Maintain Proper Stoploss based on Daily candle closing Basis.

UGROCAP - Ugro Capital🔹 Technicals:
▸ Giving a pullback after a big up move
▸ 120% up move from March bottom to the recent top
▸ Price is just below the 20, 50 EMA
▸ There are 3 zones of interest for accumulation:
1. Below the 20, 50 EMAs
2. Previous swing high which may act as a support
3. Demand zone at 218-233
Disclaimer: I am NOT a SEBI Registered Analyst and the information provided here is NOT investment advice. This post is intended solely for educational purposes.

UGROCAP --- one can start accumulation now for big gainsNSE:UGROCAP viewpoint
the stock has given good breakout on weekly time frame around 250 levels
cmp is 260
can be accumulated now. potential to give big gains
this analysis is for knowledge sharing and educational purpose .
this post is not a buy or sell recommendation.

NSE:UGROCAPNSE:UGROCAP
Buy above 313
SL below 287
Targets:318/330/346/354
ATH BO
Fib Levels
***Educational Purpose only***

Ugro Capital go longAce investor Ashish Kacholia has added smallcap multibeggar stock to his portfolio during the June 2023 qtr.
Finding Support at around 260 go long with a Stoploss of 258

UGROCAP - Ichimoku Bullish Breakout Stock Name - Ugro Capital Ltd
Ichimoku Cloud Setup :
1). Today's close is above the Conversion Line
2). Future Kumo is Turning Bullish
3). Chikou span is slanting upwards
All these parameters are showing bullishness at Current Market Price
and more bullishness AFTER crossing 239
#This is not Buy and Sell recommendation to any one. This is for education purpose and a helping hand to learn trading in Market.
# Cloud Trading
# Ichimoku Cloud
# Ichimoku Followers
I hope you all like my analysis.
Please do share your thoughts into comment section.
Please give a like, share & subscribe for daily analysis.

Ugro Capital - Power move aheadA stock which just managed to raise equity from noted investors..This means the company can now grow for in the new future without over leveraging themselves.
The company has already given a good update for Q4 and has lofty projections for future growth.
There could be a potential wedge breakout
Long above 177.50
Stoploss below 170.

UGRO CAPITAL 2 Hourly looking bullishUGRO CAPITAL 2 Hourly has trendline breakout. Good to buy at retracement near 176 for target of 212 with sl below 159


UGROCAP - Weekly Congestion and SqueezeChart has formed a VCP 3 pattern, breaking the resistance of 206 can take it till 235.

IPO Second base formationBase breakout possible, 50 DMA rising, volume and price contraction in progress

Darvas Box breakout in UGROCAPDarvas box breakout on daily and weekly chart.
Volume is also supporting.
buy above 212
SL 164
target 1:2
after 1:1.5 shift the Sl to the buying priceand then to the the bottom of next box and ride the trend.
