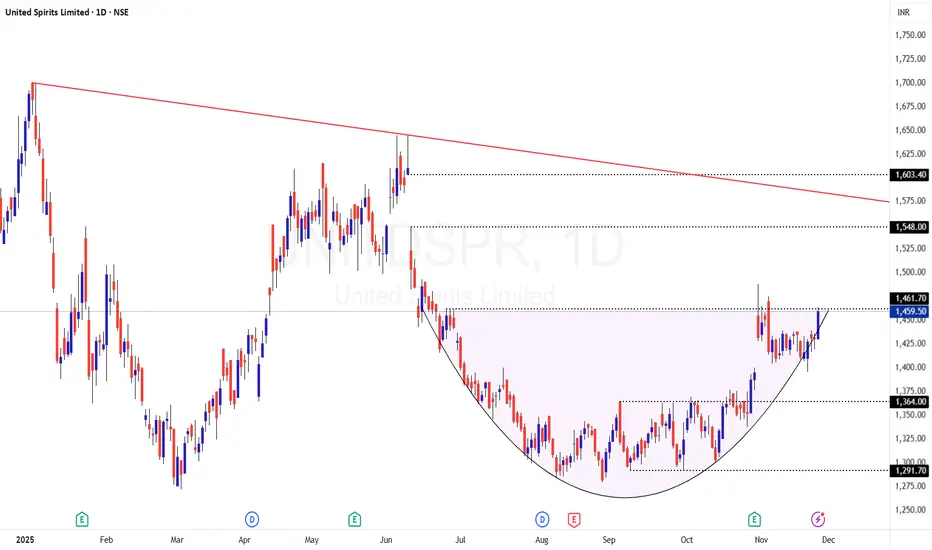
UNITDSPR - Ready to Breakout for 1600 levels
CMP: 1459.5
TF: Daily
Observation:
Price is trading above the cloud and 200 DEMA
Textbook example of Accumulation seen at the lower levels (1290-1360) and the price is trying to breakout of a Rounding bottom / Cup & Handle pattern
The GAP zone of 1548-1603 could be the potential target for this Dec Series I believe. It confluences with the falling trendline from the TOP.
Expecting GOLDEN CROSS (50 DEMA over 200 DEMA) on this chart soon, which could propel this script higher.
Disclaimer: I am not a SEBI registered Analyst and this is not a trading advise. Views are personal and for educational purpose only. Please consult your Financial Advisor for any investment decisions. Please consider my views only to get a different perspective (FOR or AGAINST your views). Please don't trade FNO based on my views. If you like my analysis and learnt something from it, please give a BOOST. Feel free to express your thoughts and questions in the comments section.
United Spirits Limited
No trades
Trade ideas
UNITDSP – Price Testing Major Trendline (Decision Zone)UNITDSP has reached a very important falling trendline resistance that has been pushing the stock down for months.
Right now, the price is hovering exactly at this trendline and moving sideways in a tight consolidation (triangle shape).
This shows that both buyers and sellers are fighting for control here.
What this means:
If the price breaks above this trendline,
it can start a fresh upward move
If it gets rejected again,
the stock may dip back lower
This area is a decision point – the next big move will depend on how the price reacts at this trendline.

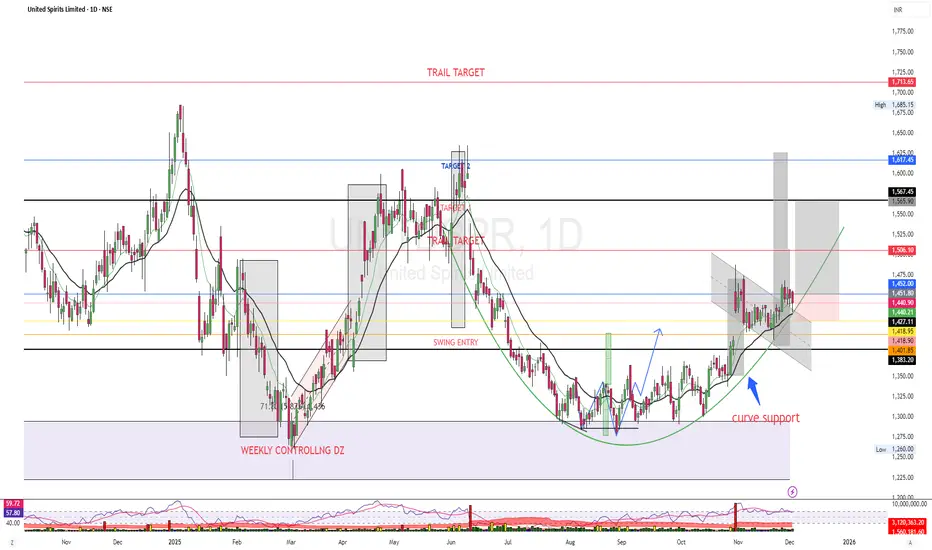
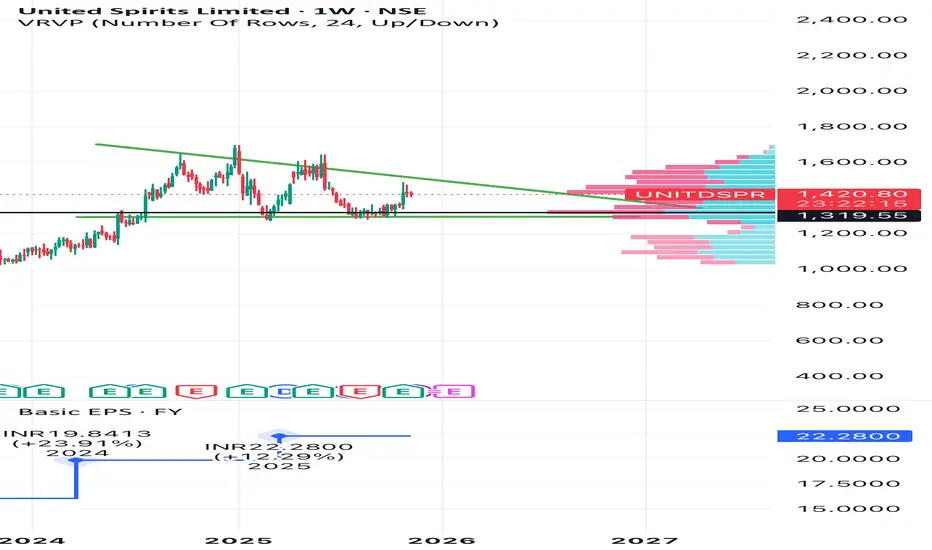
United Spirits – Curve Support Long from Weekly Demand Description:
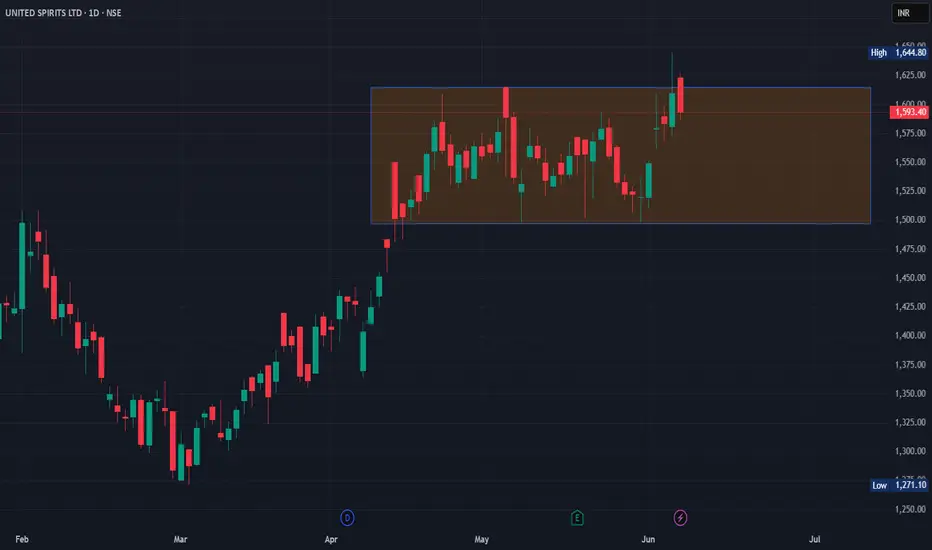
United Spirits has completed a deep correction into the weekly controlling demand zone and is now building a rounding‑bottom structure with clear “curve support” on the daily chart. Price has reclaimed the swing‑entry area and is consolidating in a bullish channel above layered supports, setting up a continuation long toward the Target 1 zone near 1,565 and the higher Target 2 / trail‑target region around 1,625–1,700.
The grey projection box highlights the upside potential if the stock continues to respect the curve support and rising moving averages. As long as price stays above the recent higher‑low and channel support, the bullish view remains valid; a decisive close back inside the demand zone and below curve support would invalidate this long idea and warrant re‑assessment.
#UnitedSpirits #MCDOWELL_N #NSEStocks #IndianStockMarket #CurveSupport #RoundingBottom #WeeklyDemandZone #SwingTrading #PositionalTrade #TrendReversal #TechnicalAnalysis #PriceAction #StockMarketIndia
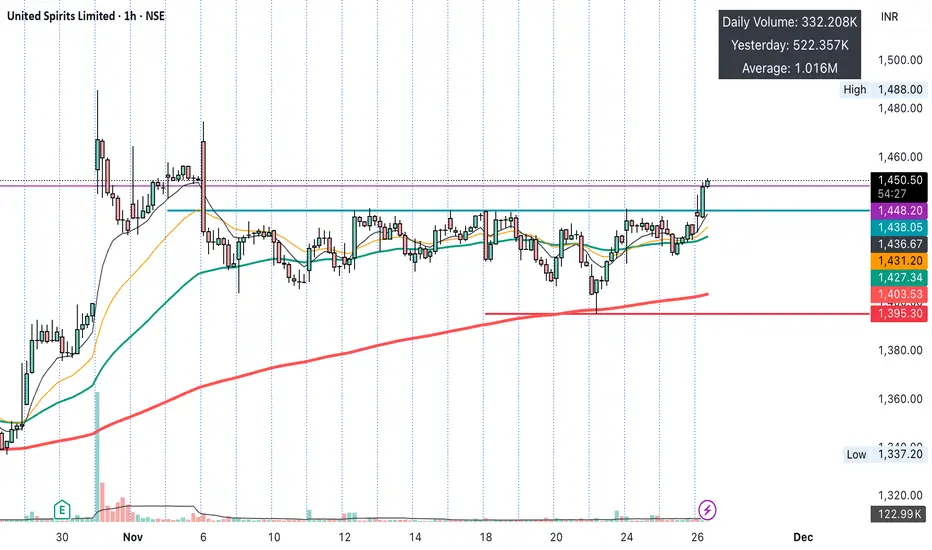
$MCDOWELL-N: Long on Gap Survival & Multi-Timeframe Breakout.This is a live swing trade I am taking in $MCDOWELL-N (United Spirits). The stock has shown exceptional relative strength by holding its post-earnings gap and is now breaking out of a consolidation range.
This post details the *full* mechanical framework I am using to manage this trade.
### 1. Indicators Used on This Chart
* **9 EMA (thin black line):** Short-term momentum.
* **21 EMA (thin orange line):** The **Key Trend Support**. The stock has repeatedly bounced off this line.
* **50 EMA (green line):** Medium-term trend.
* **200 EMA (red line):** Long-term trend.
* **Volume:** Confirming the move.
### 2. Decoding the "Gap Survivor" Setup
This is a story of strength:
1. **The Gap (Oct 31):** The stock gapped up powerfully on strong volume.
2. **The Survival (Nov 1-20):** Instead of filling the gap (which weak stocks do), it consolidated sideways. It *survived* the profit-taking phase.
3. **The Bounce (Nov 21):** The stock dipped to test the **21 EMA (orange line)** and bounced perfectly. This confirmed that institutional buyers are defending the trend.
4. **The Hourly Coil (Micro-Structure):** On the **1-Hour chart**, we can see a clear resistance range forming.
5. **The Breakout (Today - Nov 26):** The price is breaking above the hourly resistance and the daily consolidation high at `₹1,448.20`. This is our multi-timeframe confirmation.
### 3. The Mechanical Trade Plan (The "Swing" Playbook)
This is a cash "Swing" trade.
* **Bias:** Long
* **Entry (Purple Line):** `₹1,448.20`
* **Stop-Loss (Red Line):** `₹1,395.30` (Placed below the 21 EMA bounce and the recent consolidation low).
* **Risk (1R):** My risk is fixed at **`₹52.90`** per share (3.65%).
### 4. Our Exit Strategy (The "2R / 21EMA Hybrid")
1. **Target 1 (Base Hit):** Sell **50% of the position at +2R.**
* **2R Target = ~₹1,554.00**
* This pays for the trade and locks in gains into strength.
2. **The "Free Trade" Maneuver:** As soon as Target 1 is hit, the stop-loss on the remaining 50% is moved to **Breakeven (Entry Price).**
3. **Target 2 (The Runner):** I will trail the remaining "free" position using the **21 EMA (Orange Line)**. Since the 21 EMA has been the "guardian" of this trend all month, it is the perfect trailing stop.
*Disclaimer: This is not financial advice. This is my personal trade journal and framework, shared for educational and analytical purposes only. Always do your own research.*
United Sprits - A good Consolidation seen - ready for upmove.United sprits have been consolidating for quite some time, upmove can be seen anytime now , liquor stocks already moved up, united sprits would move up now .
United Sprits consolidation, upside 1600United sprits is looking good on charts also the results were positive, post consolidation the stock should move upwards around 1600 first target.
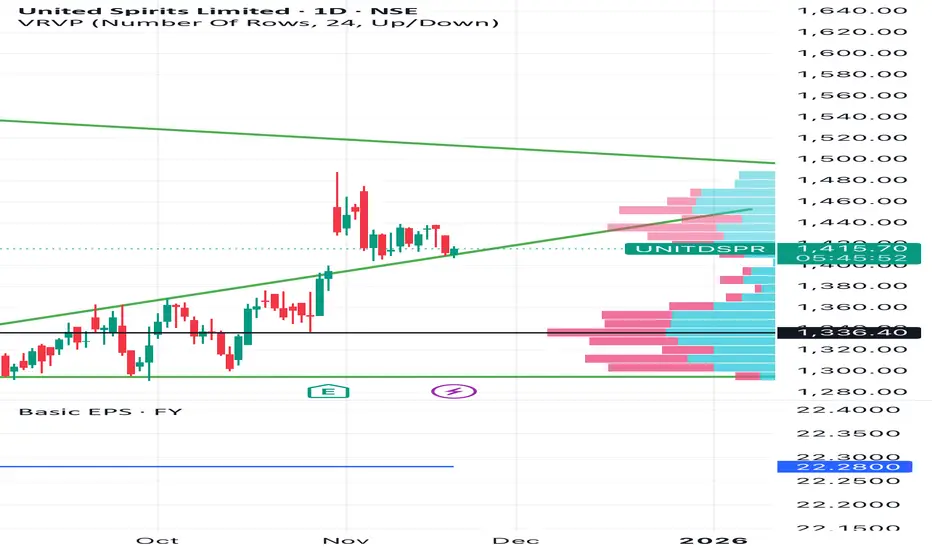
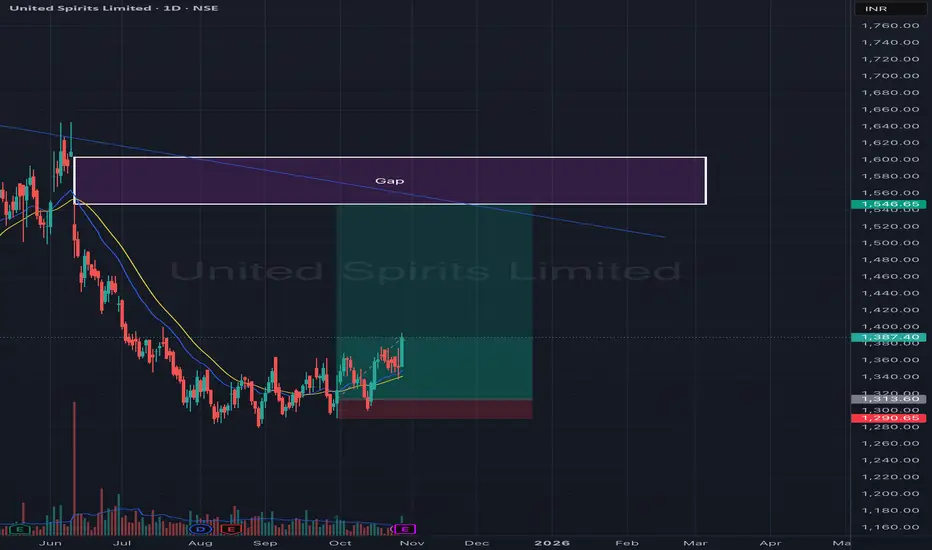
United Spirits Ltd – Gap Zone Revisit Setup (Daily Chart)United Spirits is currently forming an interesting gap fill opportunity setup on the daily timeframe. After a prolonged downtrend from its previous highs, the stock has started to base out and show signs of accumulation near the ₹1,300 zone.
A clear falling trendline resistance has been drawn from the previous swing highs, and price is now inching closer to a potential breakout zone. The chart highlights a gap zone between ₹1,520 and ₹1,560, which remains unfilled since the previous decline — acting as a key magnet for price action in the short-to-medium term.
Recent candles show bullish momentum, supported by a short-term EMA crossover (20 EMA crossing above 50 EMA) and improving volumes. The structure indicates buyers are gradually regaining control after a lengthy consolidation phase.
🎯 Key Levels:
CMP: ₹1,387.40 (+2.63%)
Resistance / Gap Zone: ₹1,520 – ₹1,560
Trendline Resistance: ~₹1,500 zone
Support Zone: ₹1,290 – ₹1,310
Target Zone: ₹1,540 – ₹1,560 (Gap Fill)
Stop-Loss (Swing Basis): Below ₹1,285
📈 Technical View:
Price has broken above short-term moving averages with improving relative strength.
The downtrend line is the next resistance — a breakout above it could accelerate a gap fill rally.
Volume build-up and bullish candles indicate accumulation in progress.
🧠 View:
A move and close above ₹1,400 could confirm trend continuation towards the ₹1,520–₹1,560 gap zone. Traders can watch for breakout confirmation with volume for a potential short-term swing opportunity.
"PARTY ALL NIGHT"Please consult your financial advisor before investing.This is only for learning purpose of chart.
We are NISM certified EQ and MCX trader but not SEBI register investment advisor.
UNITED SPIRIT BUY AFTER 1365.90...
WITH SL 1270.. AND TGT 1490-1510...

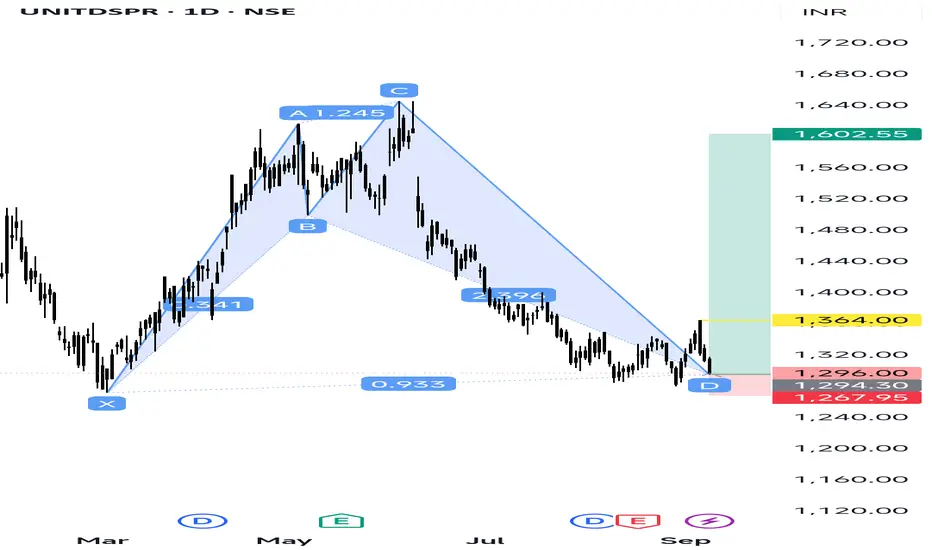
Bullish Shark pattern Here's the explanation.
X to A: Initial strong rally.
A to B: Price retraced to ~0.886 of XA (fits Shark criteria).
B to C: A strong bullish move – extended to above 1.13 of AB.
C to D: A deep retracement, falling back close to 0.886–1.13 zone of XA → forming the Potential Reversal Zone (PRZ).
Now, the price is sitting around D (1296), which is the completion zone.
---
🔹 Trading Plan (General)
1. Entry:
Around Point D (1290–1300 zone) if reversal signs (bullish candles, RSI divergence, volume support) are visible.
2. Targets:
T1 → 1364 (first resistance / yellow line on chart)
T2 → 1500–1520
T3 → 1602 (green zone marked)
3. Stop Loss:
Below 1267 (red zone marked). If price closes below, pattern fails.
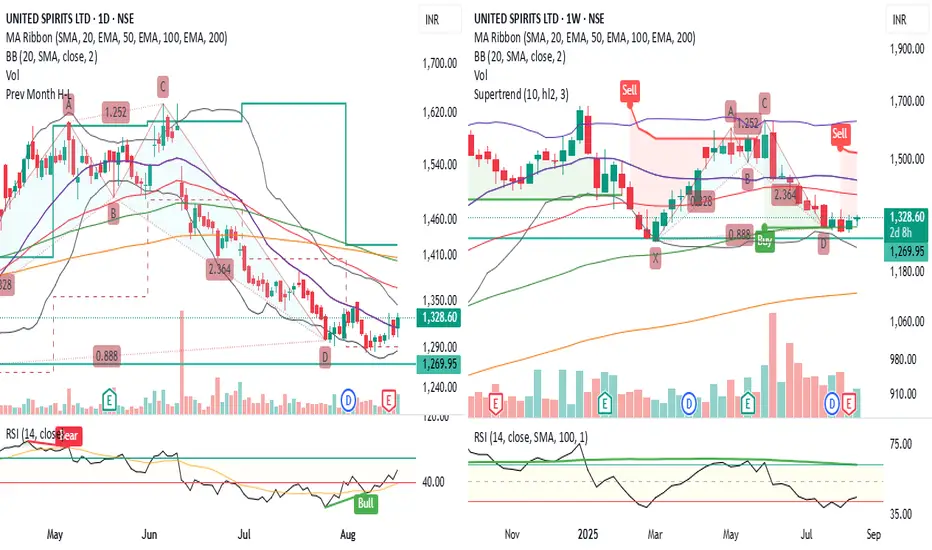
UNITED SPIRITS A Bullish Shark/Consolidation Breakdown on cardsUNITED SPIRITS is an interesting chart
It is forming Bullish Shark like pattern on daily / weekly charts
Price Crossed above 20 SMA on daily chart
Price Took Support at 100 EMA on weekly chart near 1300 levels
Multiple hammer like candles and dojis formed on Daily chart in last few days
Double bottoms formed with Positive RSI Divergences.
Lets See how it evolves from here further
Disclaimer: NOT A BUY / SELL RECOMMENDATION I am not an expert I just share interesting charts here for educational purpose and not to be taken as buy/sell recommendation. Please seek expert opinion before investing and trading as trading/ investing in market is subject to market risks. I do not hold any position in the stock as on date but I may look to take some position with my own Risk Reward matrix.
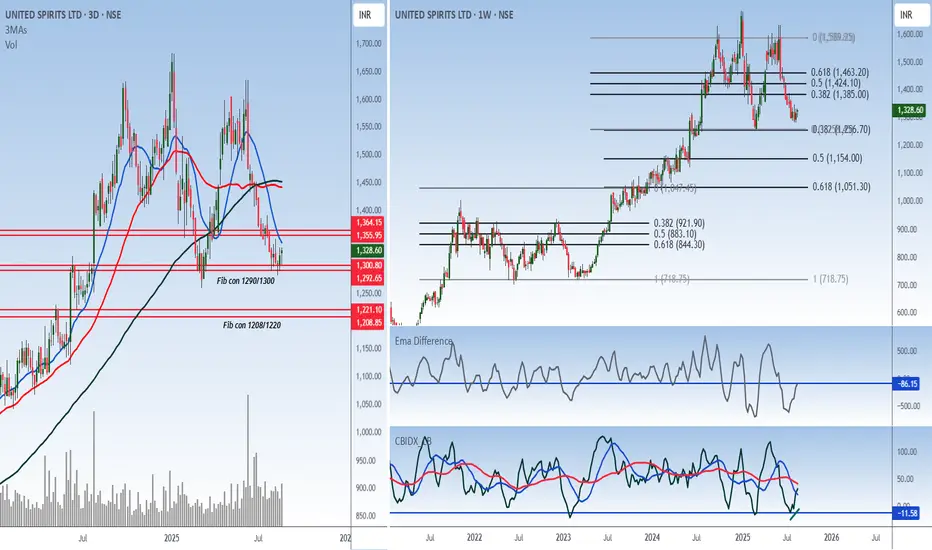
A Rally to book some profitsUnited Spirits CMP 1329
Fib - the stock is likely to rally to 1450/1460. This is a good 10% from here. The stop has to be below the lower confluence at 1200. Hence the risk reward is not in favour to trade this counter.
MA - the longer MA's are also around the 1450 zone making it a strong resistance.
Conclusion - Since the longer term trend is down. I will advise to book some profits on this rally
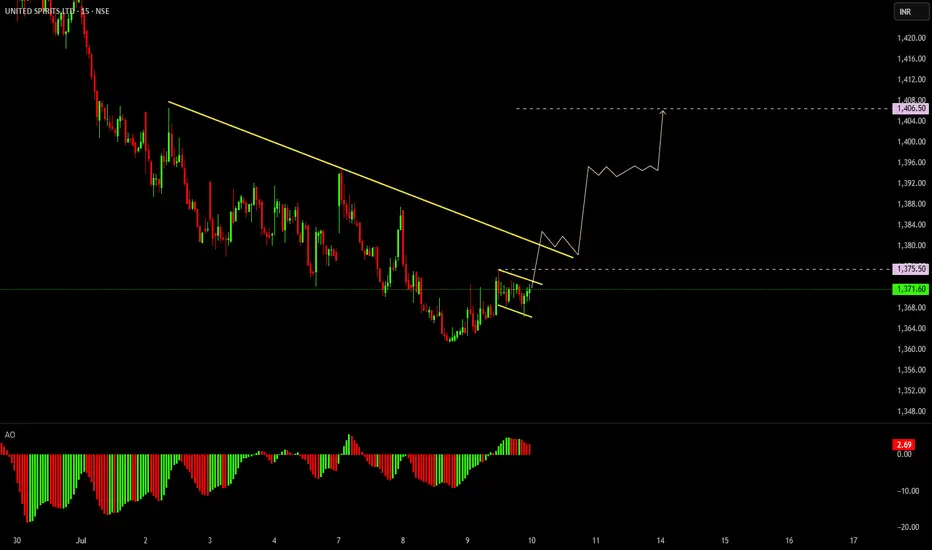
Buy Near Blue line Bottom is near Only Trendlines Used — No Other Confluence
⦁ Stoploss Is Based on the Trendline
⦁ Retest of Trendline Builds Confidence
⦁ Trendline Angle Shows Momentum
⦁ Trendlines Define Risk Clearly
Only 13 Rs/- Stoploss⦁ Only Trendlines Used — No Other Confluence
⦁ Stoploss Is Based on the Trendline
⦁ Retest of Trendline Builds Confidence
⦁ Trendline Angle Shows Momentum
⦁ Trendlines Define Risk Clearly
Patterns Repeating Patterns , FNO Trade I have witnessed these patterns which are repeating in the Market events
I find two important notes form this Stock
01) its in Oversold level
02) PCR oversold below or at 0.30
03) Pattern structure current time frame suggest Flag Pattern
This is Going to move up for short period of time
indicating short covering or intermediate move with in the Large directional move
This is education content one can use the Scanners and patterns identification to take
counter move trades
Good luck
UNITED SPIRITS RANGE BOUNDHi there, sharing you my insights on UNITED SPIRITS for upcoming days.
This stock has been range bound for atleast 1 month.
Waiting for the either side range breakout/breakdown confirmation.
Note: Please ask your financial advisor before investing. (This post is only for educational purpose)
Call on united spirit The stock announced its earnings yestrday which are beat street expectations. So it may move northward direction. The stock is trading at 1530.
Buy price 1520
Target price : 1700
Stop loss : 1430
United SpiritsPrice has formed a rounding bottom and sustaining above the resistance with volume support. 1500 is an important support zone.
Buy above 1550 with the stop loss of 1510 for the targets 1590, 1640, 1700, 1740 and 1780.
Always do your own analysis before taking any trade.
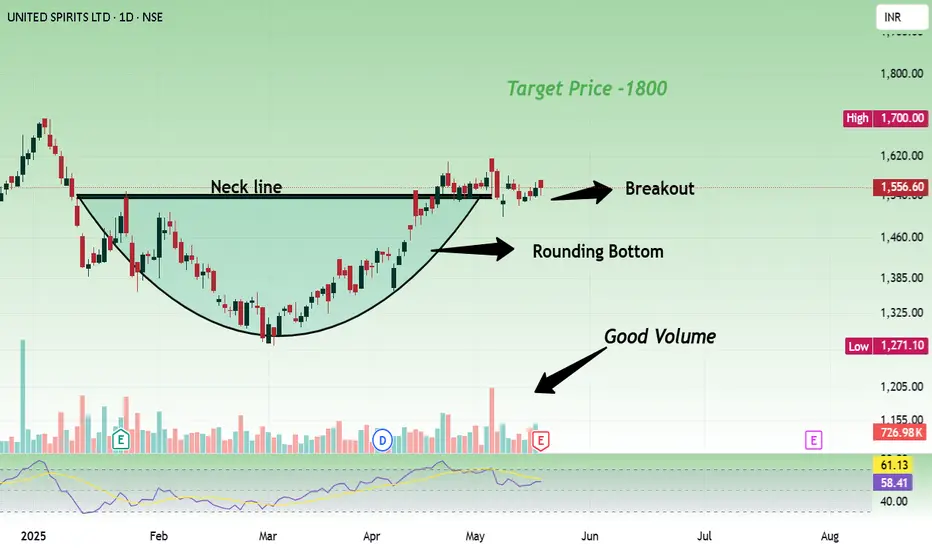
Rounding Bottom Breakout in United SpiritsUnited Spirits has given Rounding bottom Breakout on the daily charts. This pattern is very powerful and now this stock can provide a return of 15% in near term.
On the monthly chart, the stock has a long white bodied candlestick which signifies strength and possible bullish bias.
On the Daily Chart,the stock is trading above its 11 and 22 day EMA, RSI is at 69 and MACD is above zero line suggesting positive momentum.
Volume- The volume has increased towards the breakout which suggests the possible upmove.
CMP- Rs.1570
Price Target - Rs1800
SL- 1525 ( Below the neckline)
Disclaimer: This is not a buy/sell recommendation. For educational purpose only. Kindly consult your financial advisor before entering a trade.

UNITED SPIRITS LTD As of May 1, 2025, here are the key support and resistance levels for United Spirits Ltd (NSE: UNITDSPR) based on the latest technical analysis:
🔹 Support Levels
S1: ₹1,322.63
S2: ₹1,297.97
S3: ₹1,271.98
🔹 Resistance Levels
R1: ₹1,373.28
R2: ₹1,399.27
R3: ₹1,423.93
These levels are derived from pivot point calculations and are commonly used by traders to identify potential price reversal zones.
Please note that these levels are based on historical data and are subject to change with market conditions. It's advisable to monitor the stock's price movements and consult with a financial advisor before making any trading decisions.
UNITDSPR Trading Within Weekly Demand ZoneUNITDSPR is currently trading at ₹1320.15, within the weekly demand zone ranging from ₹1317.45 to ₹1282.85 , identified on 26th July 2024. This zone may serve as a support area where buyers could step in. Traders should monitor price action to assess whether the support holds or if further downside movement occurs.
Disclaimer: This analysis is for informational purposes only and should not be considered financial advice. Please perform your own due diligence or consult a financial advisor before making any investment or trading decisions.

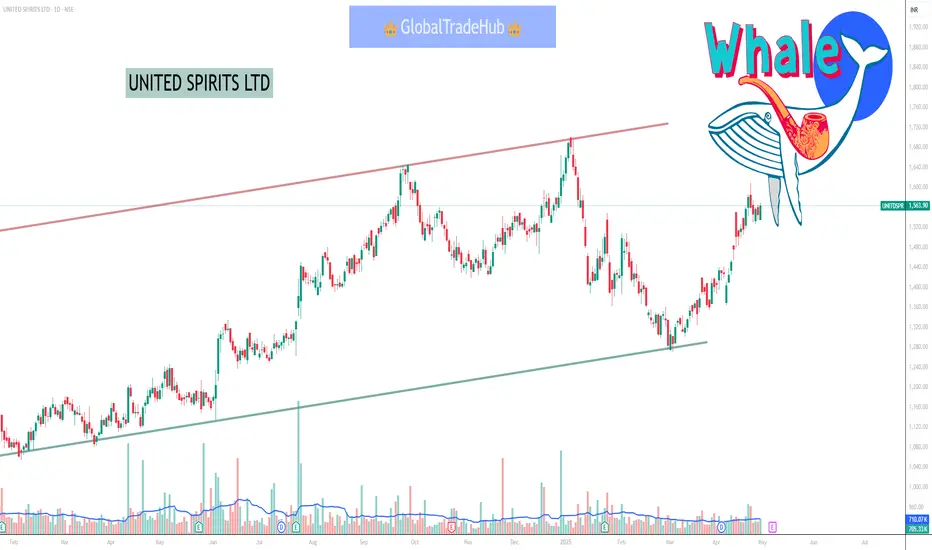
United Spirits: Technical Analysis & Key Levels to WatchAs we analyze the weekly chart of United Spirits Ltd. (UNITDSPR), it’s evident that the stock has been following a steady uptrend, supported by a strong ascending channel. This analysis dives into the technical indicators, price action, and potential future moves to help make an informed investment decision.
1. Trend Analysis: Ascending Channel
The stock has been trading within an ascending channel since mid-2023, forming consistent higher highs and higher lows. This channel signifies a healthy, gradual uptrend.
Upper Resistance: The upper bound of the channel acts as resistance, and the stock recently tested this zone near ₹1,508, showing signs of rejection.
Lower Support: The lower boundary of the channel, around ₹1,181, provides strong support.
The channel structure indicates a bullish bias as long as the price respects the lower boundary.
2. Fibonacci Pivots
The Fibonacci pivot levels on the chart provide key support and resistance zones:
Resistance Levels:
R1: ₹1,529
R2: ₹1,691 (next major resistance if the stock breaks above ₹1,529).
Support Levels:
S1: ₹1,181 (major support near the channel's lower boundary).
S2: ₹1,044 (critical for long-term trend reversal).
If the stock closes below ₹1,181, the short-term bullish momentum may weaken.
3. MACD (Momentum Analysis)
The MACD (12, 26, 9) on the weekly chart shows:
Bearish Crossover: The MACD line has crossed below the signal line, indicating weakening momentum in the short term.
Histogram Decline: A consistent reduction in histogram bars suggests a potential correction phase.
Despite the short-term bearish signals, the broader uptrend remains intact unless the price breaks key support levels.
4. Recent Price Action
In recent weeks, the stock has faced selling pressure near the ₹1,508–₹1,529 resistance zone. This is further confirmed by the bearish candle formation and rejection near the channel's upper boundary.
However, the presence of a truckload of support levels below, including the ₹1,181 pivot, suggests limited downside risk.
5. Risk-Reward Setup
Based on the chart, the risk-reward setup looks favorable:
Entry Zone: ₹1,181–₹1,200 (near channel support and S1 pivot).
Target Levels:
Short-Term: ₹1,529 (channel resistance).
Medium-Term: ₹1,691 (R2 pivot).
Stop-Loss: A weekly close below ₹1,181 may invalidate the bullish view, making ₹1,044 the next key support.
6. Broader Market Context
Given the overall market sentiment, the stock appears poised to perform well if:
The broader indices maintain their upward momentum.
Sectoral tailwinds, such as rising demand for premium beverages and excise duty relief in the Union Budget, continue to favor growth.
Conclusion & Investment Strategy
United Spirits Ltd. remains a strong candidate for bullish investors, given its position within the ascending channel and well-defined support levels.
Short-Term View: Watch for a rebound near ₹1,181 with a target of ₹1,529.
Medium-Term View: A breakout above ₹1,529 could propel the stock toward ₹1,691.
While the MACD suggests some short-term weakness, the overall trend remains bullish as long as the lower channel boundary holds. Traders should remain cautious of any break below ₹1,181, as it could signal deeper corrections.

United Spirits Ltd view for Intraday 15th Jan #UNITDSPR
United Spirits Ltd view for Intraday 15th Jan #UNITDSPR
Resistance 1450 Watching above 1453 for upside movement...
Support area 1400 Below 1435 ignoring upside momentum for intraday
Watching below 1397 or downside movement...
Above 1415 ignoring downside move for intraday
Charts for Educational purposes only.
Please follow strict stop loss and risk reward if you follow the level.
Thanks.

UNITDSPR: Cup & Handle pattern breakout📊 Analysis :
Good bullish candle breakout of C&H pattern with good volume.
📈 Trading Plan :
Entry: Buy above 1565 (wait for a breakout above candle at least 15-30 min with strong volume confirmation).
Target 1: 1650
Stop-Loss: 1525
R:R 1:2
