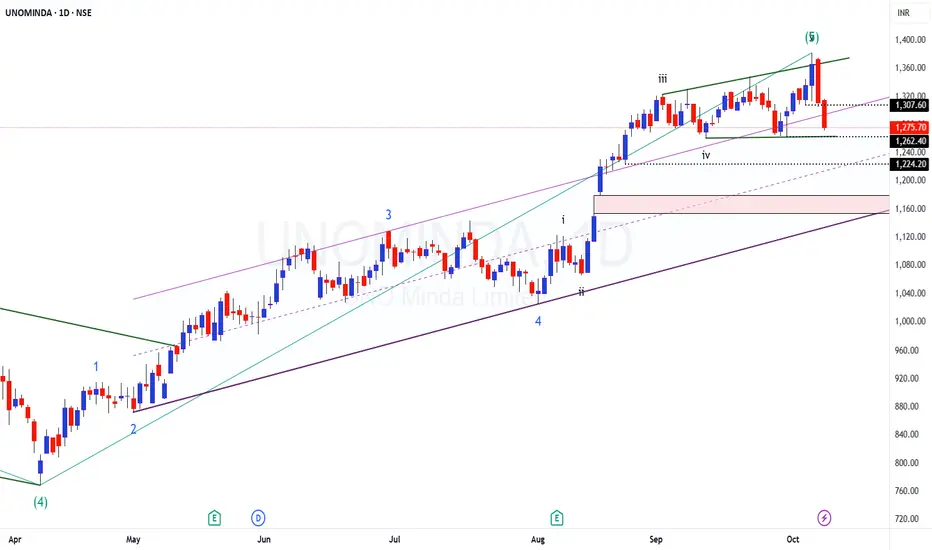
UNOMINDA - PUMP and DUMP?TF: Daily
CMP: 8250
To me, it looks like the 5 wave has ended on larger TF
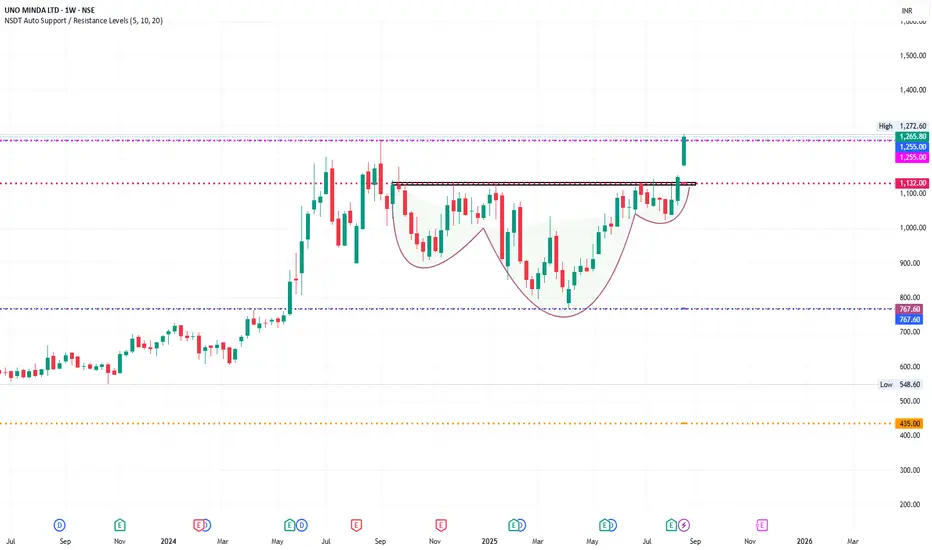
Here is the chart in weekly TF with wave counts
Price movement in the last week looks to be a pump and dump strategy from big guys (of course, the typical THROWOVER move for the final leg)
Breaking the swing low 1260 will be the first sign of weakness here and we can look for the GAP zone to be the first target.
Pullbacks to 1310-1320 be used for entry
Disclaimer: I am not a SEBI registered Analyst and this is not a trading advise. Views are personal and for educational purpose only. Please consult your Financial Advisor for any investment decisions. Please consider my views only to get a different perspective (FOR or AGAINST your views). Please don't trade FNO based on my views. If you like my analysis and learnt something from it, please give a BOOST. Feel free to express your thoughts and questions in the comments section.
UNOMINDA trade ideas
UNOMINDAIt's a matter of great luck in the time cycle, if you find trades on only one side in every cycle. This is a chart of Unominda, as you can see, most of the trades are on one sided. This is rarely seen in charts.
UNOMINDA Price ActionUNO Minda Ltd is trading at ₹1,282 as of September 12, 2025, delivering consistent financial and operational outperformance. For FY25, the company posted consolidated revenue of ₹16,775 crore, up 20% year-on-year, with net profit rising 9% to ₹936 crore. EBITDA grew 18% to ₹1,800 crore, and operating margins remain stable at 10.7%. Recent quarterly profit after tax is ₹289 crore, and EPS for the last twelve months stands at ₹13.97.
Expansion in premium switches, alloy wheels, lighting, sensors, sunroof products, and emerging EV technologies has bolstered top-line growth. Strategic projects—including new capacities for four-wheeler EV components and ADAS products—support a robust future pipeline, while strong cash flows enable ongoing fundraising and project commissioning.
Valuation remains at a premium to the sector, with trailing P/E around 79, price-to-book of 13, and price-to-sales ratio of 4.2, reflecting leadership in innovation and rapid growth. Return on capital employed is healthy at 15.7%, and debt remains modest, sustaining investor and institutional confidence. Technically, the stock is just below its 52-week high and continues to outperform broad market indices, maintaining an upward momentum trend.
Promoter and institutional holding are stable, affirming long-term commitment, and a final dividend of ₹1.50 per share was declared for FY25, rewarding shareholders alongside growth investments. UNO Minda’s medium- and long-term outlook remains highly constructive, anchored by strong financials, prudent capital allocation, innovative leadership, and a resilient growth trajectory.
UNOMINDA -CUP & HANDLE BREAKOUT 🔎 1. Chart Pattern
The chart is clearly showing a Cup and Handle Pattern (highlighted).
Breakout has happened above the neckline (~₹1130–1140) with strong bullish candle.
Cup & Handle is a continuation pattern – breakout targets can be measured.
📌 Target Calculation:
Depth of the cup = 1132 (neckline) – 767 (bottom) ≈ 365 points.
Breakout above 1132 → Target = 1132 + 365 = ₹1495 approx.
Short-term resistance: ₹1270–1280 (already touched).
Next zone: ₹1350 → ₹1450 → ₹1500.
🔎 2. Support & Resistance
Immediate Support: ₹1130–1150 (previous neckline).
Strong Support Zone: ₹1050–1070 (previous consolidation).
Major Support: ₹767 (cup bottom).
Immediate Resistance: ₹1270–1280 (tested).
Major Resistance Levels: ₹1350, then ₹1495.
🔎 3. Candlestick / Price Action
Current weekly candle is long green, wide-range, high volume breakout → very bullish.
Closing above ₹1250 is confirmation of breakout.
🔎 4. Indicators (if applied)
RSI (Relative Strength Index): Likely crossing above 65–70 → shows momentum but not yet extreme overbought (healthy breakout).
MACD: Likely bullish crossover with histogram expansion.
Volume: Breakout candle with strong volume confirms institutional buying.
Moving Averages:
Price is above 20W, 50W, 200W EMAs → strong uptrend.
Golden cross already confirmed earlier.
🔎 5. Trend Outlook
Primary Trend (1–2 years): Strong Bullish.
Intermediate Trend (2–6 months): Bullish continuation towards ₹1450–1500.
Short Term (1–4 weeks): May retest ₹1180–1200 before further rally.
📌 Conclusion (Expert View)
✅ Stock has given a Cup & Handle breakout above ₹1130 with strong momentum.
✅ Upside targets: ₹1350 → ₹1450 → ₹1500.
✅ Downside support: ₹1130, then ₹1050.
⚠️ Near-term, RSI may cool off → watch for pullback to ₹1180–1200 as entry opportunity.
👉 Strategy:
Swing Traders: Buy on dips near ₹1180–1200 with SL below ₹1050.
Investors: Can hold for long-term with next target ₹1500+.
This is only for educational pattern not for sugesstion.
UNO MINDATrade Plan
Buy Above: ₹1,270 (breakout above recent high with volume confirmation).
Sell Below: ₹1,215 (breach of short-term support may signal trend weakness).
Stop Loss: ₹1,210 (slightly below strong support).
Targets:
Primary target: ₹1,330
Secondary target: ₹1,400 (if momentum sustains)
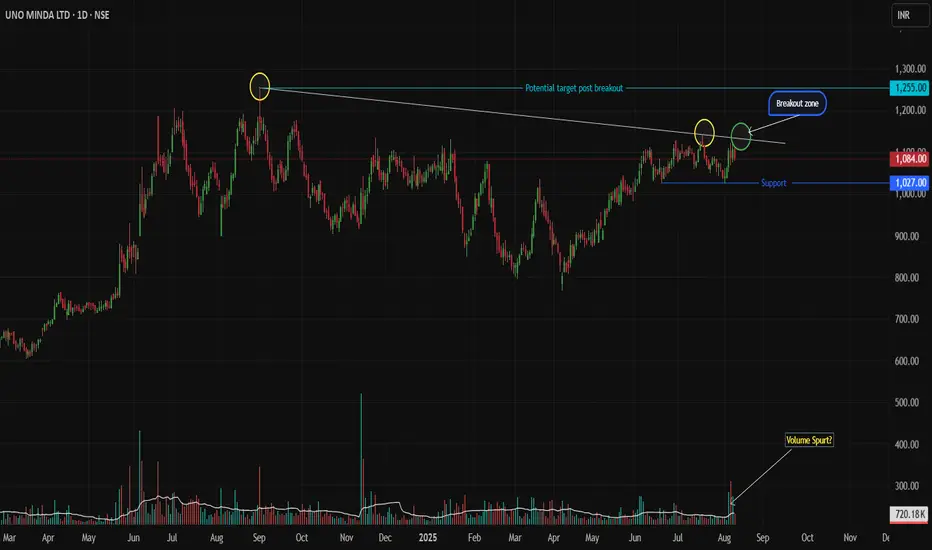
Uno Minda: Triple Trendline Test - Breakout or Pullback Setup Uno Minda Price Action Setup
(Daily Timeframe | Pure Price Action + Volume)
Key Structure
Resistance Trendline: Tested twice (02-Sep-2024 & 17-Jul-2025). Price now approaches it for the 3rd attempt.
Support Zone: Strong base at 1027 (recent swing low).
Long-Term Trend: Bullish (higher highs/lows).
Trade Scenarios
SCENARIO 1 : Trendline Breakout
Trigger:
Daily breakout candle closes above the resistance trendline.
Candle must be strong bullish (full-bodied green) with volume > 20-day average.
Entry: On confirmation of breakout (next candle open/close above breakout candle’s high).
Stop Loss: Low of the breakout candle.
Targets:
First: 1255 (take partial profits).
Trail balance with trailing SL (e.g., below recent swing lows).
SCENARIO 2 : Pullback to Support
Trigger:
Price retests 1027 support, followed by a strong bullish reversal candle (e.g., Bullish Engulfing/Hammer) with rising volume.
Entry: After reversal candle closes (confirmation).
Stop Loss: Below the low of the reversal candle.
Targets:
First: 1130 (take partial profits).
Trail balance aggressively.
Risk Management
Position Size: Risk ≤ 1% capital per trade.
Avoid chasing: Enter only on confirmed triggers.
Invalidation: Exit if price closes below SL levels.
Disclaimer
This idea is educational only. Not financial advice. Trading carries high risk. Past performance doesn’t guarantee future results. Always test strategies in a demo account. Consult a financial advisor before trading.
Boost 👍 if helpful! Comment below for other stocks you want analyzed.
Keep it price-driven. Trade safe! 💡
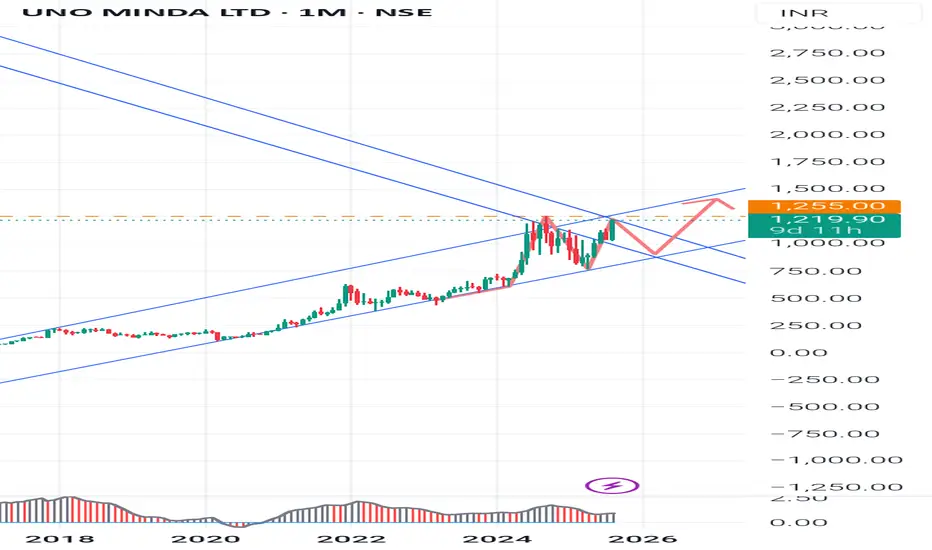
UNO Minda Ltd Stock - Chart Analysis (August 2025)UNO Minda Ltd Stock - Chart Analysis (August 2025)
1. Chart Pattern Insights
Trend: The long-term chart shows a consistent uptrend since 2017, with price largely respecting an upward-sloping channel. Recent price movement is testing the upper boundary.
Pattern: The marked wedge/triangle pattern indicates possible volatility and upcoming breakout.
If price sustains above 1,255, the next bullish target is around 1,400.
Support-:
A breakdown below the lower wedge/channel suggests a test of 1,000 support.
Support Levels: 1,000–1,020 ; next strong support at 768 (previous major low).
Resistance Levels: 1,255 (recent high and pivot); 1,400 (target in bullish scenario), then 1,600 (next significant resistance).
Pivot Points: Weekly pivots confirm 1,255 as a resistance and 1,085-1,140 zone as a key support area.
Volume: Increasing volume on upmoves supports bullish momentum.
2. Stochastic RSI (8, 13, 21) Insights
Strength: Use these settings to assess overbought/oversold zones. A reading above 80 suggests overbought (possible reversal or consolidation), below 20 is oversold (potential buying opportunity).
Momentum: If Stochastic RSI crosses above 50 and price breaks recent resistance, it confirms bullish momentum. Divergence between price and Stochastic RSI often precedes reversals.
3. Fundamental Ratios (2025)
Metric
UNO Minda
Motherson Sumi
Suprajit Engg.
Industry Avg.
P/E (TTM)
75.75
50
40
35
P/B
12.37
8
6
5
ROE
17.5%
12%
11%
13%
ROCE
18.8%
14%
13%
14%
Dividend Yield
0.18%
>0.30%
0.40%
0.35%
OPM
12%
10%
13%
11%
Debt/Equity
0.5
0.7
0.3
0.6
UNO Minda boasts higher profitability (ROCE, ROE, OPM) but is more expensive (higher P/E/PB), reflecting market optimism for its growth.
4. Key Learnings for Students
Charts Teach Structure: Price channels, wedges, and pivot points help spot trend directions. Always align investment with trend- buy in uptrend, sell or avoid in downtrend.
Support & Resistance are Crucial: Identify historical price levels where stock reversed before. These are good zones for setting stop-loss or target levels.
Momentum Matters: Use Stochastic RSI and volume to confirm price movement strength. Entries on strong momentum and exits on exhaustion zones (overbought/oversold).
Valuation Matters: High P/E/PB signals high growth expectation but potentially overpriced risk.
Profitability Ratios (ROE, ROCE): Go for companies with sustained high profitability and reasonable leverage (Debt/Equity).
Diversification: Compare companies within an industry- never invest based solely on price chart, always check business health and fundamentals.
5. Disclaimer
Stock market investing involves risk. The above analysis is for educational purposes only. Past performance does not guarantee future returns. Always do your own research and consult a financial advisor before making investment decisions.
#StockAnalysis #Fundamentals #TechnicalAnalysis #UNO #AutomobileStocks #StudentInvesting
UNOMINDA - 52 wk highest close BO + momentum streghtUNOMINDA - 52 wk highest close BO + momentum strenght
🚀 Stock Analysis Alert: UNOMINDA - Shows Strong Momentum!
Just spotted a powerful signal on UNOMINDA using my custom Strength Meter Pine Indicator! 🔥
📊 Key Observations:
The stock is showing strong momentum compared to NIFTY with
Strength Meter indicates a bullish rising strenght at points --
1. 50.22
2. 66.28
3. 76.17
4. 84.69
Rising strenght from point 1 to 4 shows stock is gaining strenght
Key resistance/support levels
Support = 1027
Resistance = 1570

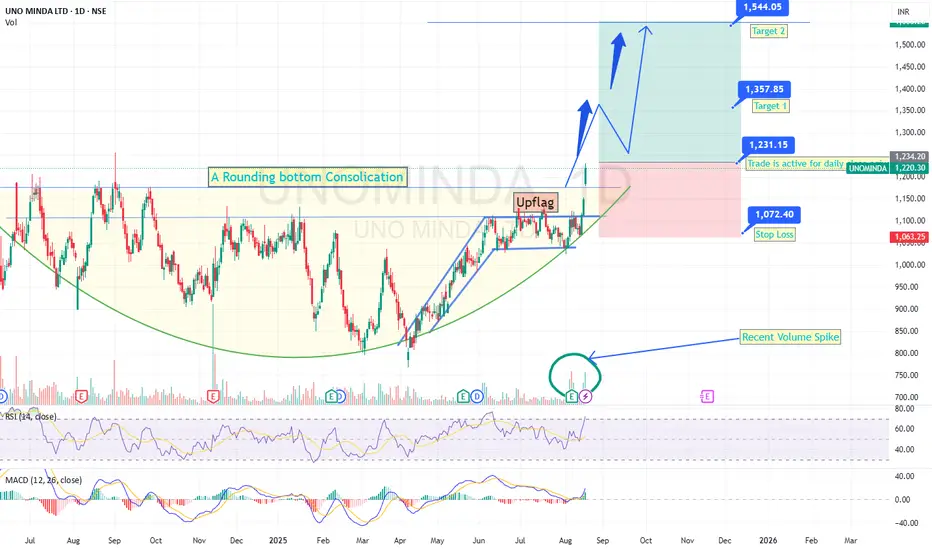
An Upflag Inside an Round bottom consolidation with Gap up B/OUno Minda was consolidating between the 1180-800 price range for past 1.2 years,under a daily time frame.
This is a very good price consolidation with respect to time.
With the recent expectation that the Goverment might slash the GST rate slabs for Automobile Industry, this auto parts maker stock has given a breakout of the rounding bottom consolidation, with an inside upflag break out confirmation too.
Though the breakout has happened with gap up, it is a better candidate for going long, considering the recent surge in volumes with RSI and MACD providing double confirmation.
3 Criteria to consider:
1. Rounding bottrom Breakout
2. Inside upflag breakout
3. News that GST rate migh be slashed for auto industry.
Hence it is better to consider under below levels:
1. Jump in - Daily close >1260
2. Stop Loss - Daily close <1060
3. Target 1 - 1357-1360 range
4. Target 2 - 1548-1550 range.(Takes time, with retest to rounding base and pull back).
The ideas shared here are purely for educational purpose only.
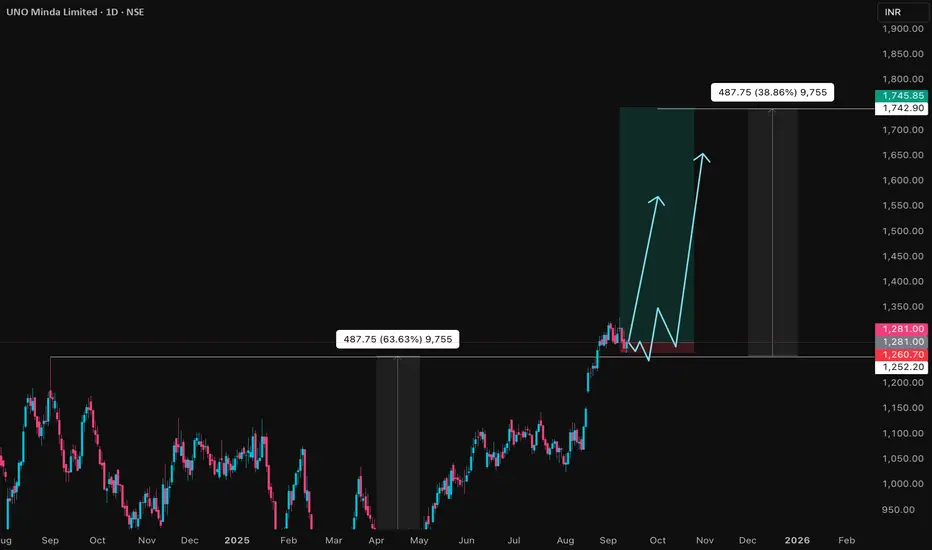
UNO Minda – Potential Wave V Extension in Progress - BuyUNO Minda completed its larger degree Wave V on 8 Jul 2024, followed by a correction in the form of a flat, which ended on 7 Apr 2025.
Since then, the stock has been in a fresh impulsive sequence:
Wave (i) completed on 21 Apr.
Wave (ii) unfolded as a simple flat, ending on 2 May.
Wave (iii) matched the length of Wave (i) (equality).
Wave (iv) again unfolded as a simple flat.
With Wave (i) and (iii) being equal in length, there is a high probability of a Wave (v) extension.
Currently, Wave (v) is unfolding:
Sub-wave (1) ended on 11 Jun.
A larger flat correction followed, completed on 1 Aug 2025.
Strong results for Q1’26, combined with increasing volumes and strong candles, confirm the possibility of a Wave V extension.
ub-wave (3) of (v) is now in progress.
Trading View
Buy at current levels (in which case maintain a stop loss of 1055) or buy on next correction.
Wave V extensions can stretch up to maximum of 1.618 × of Wave 0–iii.

UNOMINDA - Possible Breakout with Bullish Candle📊 UNOMINDA – Technical & Educational Snapshot
Ticker: NSE: UNOMINDA | Sector: 🚗 Auto Components
CMP: ₹1,149.80 ▲ (as of 16 Aug 2025)
Rating (for learning purpose): ⭐⭐⭐⭐
Pattern Observed: 📈 Possible Breakout with Bullish Candle + RSI/Bollinger Band Confirmation
🔑 Key Reference Levels (For Learning)
Resistance Zones: 1150 – 1165 – 1179 – 1204
Support Zones: 1125 – 1100 – 1085
Reference Pullback Zone: 1068
Risk Reference Zone: 1011
Potential Upside Zones (Educational Projection): 1255 → 1387 → 1456 → 1556
📌 Technical Observations
✅ Bullish candle near resistance
✅ RSI momentum breakout above 64
✅ Bollinger Band expansion → volatility visible
✅ Supertrend in bullish territory
✅ Bollinger Band Squeeze → potential directional move
📊 Volume Analysis
The move was supported by 1.86M volume vs 787.43K (20-SMA) — more than 2× above average.
Such spikes are often studied as signs of institutional participation and momentum strength.
⚠️ Still, follow-through in price action and sustained close above resistance are essential to avoid false breakouts.
📝 STWP Trade Analysis (Educational Illustration Only)
1️⃣ Breakout Illustration
Go Long: 1154/above
Stop Loss (Learning Reference): 1064/below
2️⃣ Conservative Pullback Illustration
Go Long: 1149.80 – 1154 zone
Stop Loss (Learning Reference): 1133/below
3️⃣ Low-Level Pullback Illustration
Go Long: 1145/above
Stop Loss (Learning Reference): 1122/below
(Note: These are structured as learning case studies of how swing setups may be visualized by traders. Not trade calls.)
📌 Summary (Learning View Only)
UNOMINDA provides a good case study in breakout + pullback strategies.
Key lesson: Watch for confirmation above resistance or behavior near pullback zones.
Such structures can be useful when studying swing setups.
Note: A possible breakout with a bullish candle supported by RSI strength and Bollinger Band expansion often signals the start of momentum. However, traders typically wait for volume confirmation and sustained close above resistance to validate the move, as false breakouts are common near key levels.
⚠️ Disclaimer – Please Read Carefully
The information shared here is meant purely for learning and awareness. It is not a buy or sell recommendation and should not be taken as investment advice. I am not a SEBI-registered investment advisor, and all views expressed are based on personal study, chart patterns, and publicly available market data.
Trading — whether in stocks or options — carries risk. Markets can move unexpectedly, and losses can sometimes be larger than the money you have invested. Past performance or past setups do not guarantee future results.
If you are a beginner, treat this as a guide to understand how the market works — practice on paper trades before risking real money. If you are an experienced trader, remember to assess your own risk, position sizing, and strategy suitability before entering any trade.
Consult a SEBI-registered financial advisor before making any real trading decision.
By reading, watching, or engaging with this content, you acknowledge that you take full responsibility for your own trades and investments.
________________________________________
💬 Found this useful?
🔼 Give this post a Boost to help more traders discover clean, structured learning.
✍️ Drop your thoughts, questions, or setups in the comments — let’s grow together!
🔁 Share with fellow traders and beginners to spread awareness.
✅ Follow @simpletradewithpatience for beginner-friendly setups, price action insights & disciplined trading content.
🚀 Stay Calm. Stay Clean. Trade With Patience.
Trade Smart | Learn Zones | Be Self-Reliant 📊

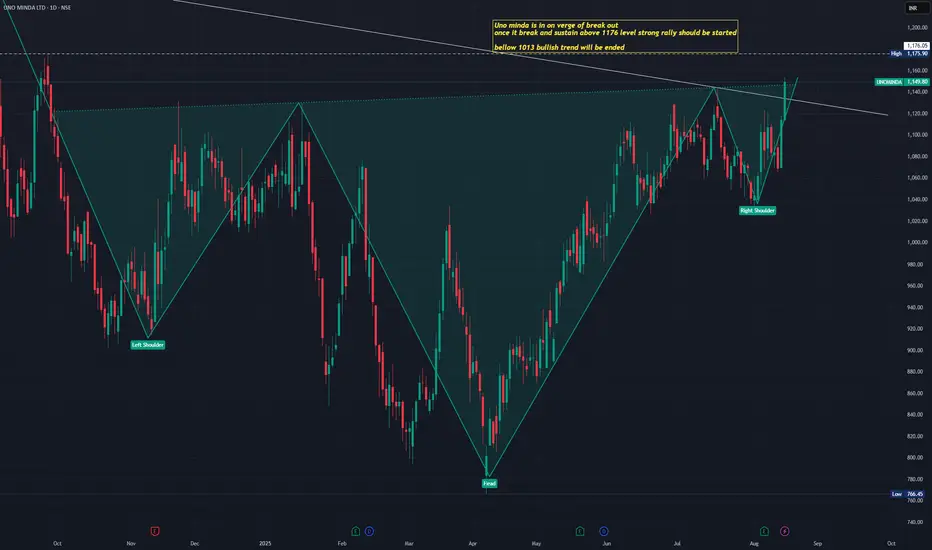
UNO INDA is on strong up rendUno minda is in on verge of break out
once it break and sustain above 1176 level strong rally should be started
bellow 1013 bullish trend will be ended
Uno minda for long termUno minda is in on verge of break out
once it break and sustain above 1176 level strong rally should be started
bellow 1013 bullish trend will be ended

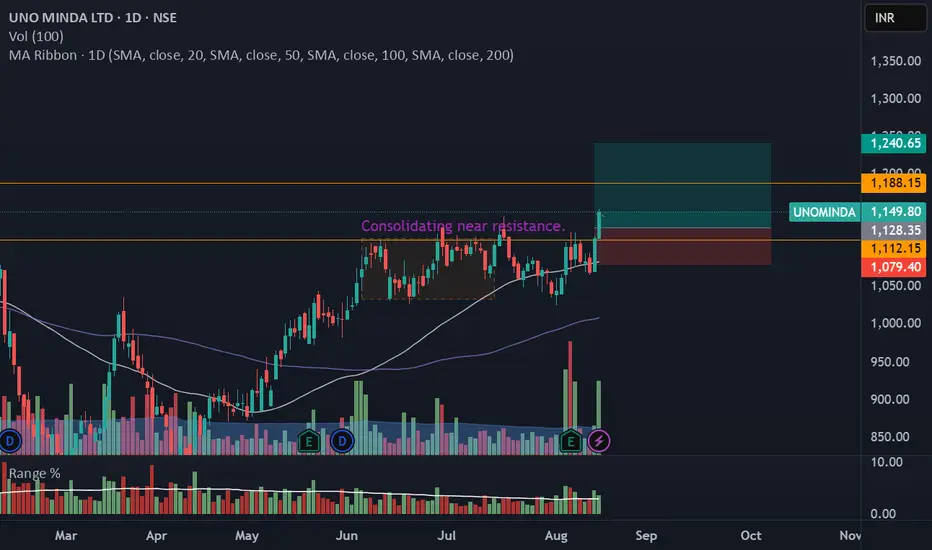
UNOMINDA – Daily Timeframe Breakout Idea (Resistance Zone Break)UNO MINDA LTD. has shown a breakout above a key horizontal resistance level on the daily chart, accompanied by a nearly 1.5 times volume surge near the breakout, as seen earlier, supported by strong momentum.
🔍 Breakout Context:
- Price broke above the ~₹1110 and 1120 horizontal resistance, which had held for over 6 months.
- Breakout supported by more than average volume and just above average range near the resistance zone.
- The price is also trading above both the 50- and 100-day SMAs, indicating strong trend continuation.
- This aligns with a bullish continuation setup.
📉 Trade Plan:
- CMP: ₹1149
- Entry: Near ₹1128
- Target: ₹1240 (~10% upside from CMP)
- Stop-Loss: ₹1079 (Closing Candle)
- Risk-Reward Ratio: ~1 : 2.2
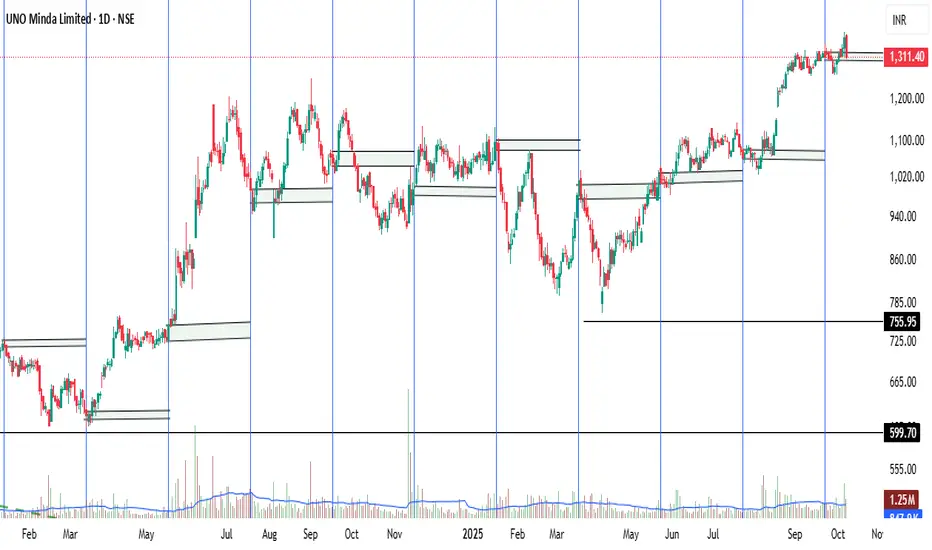
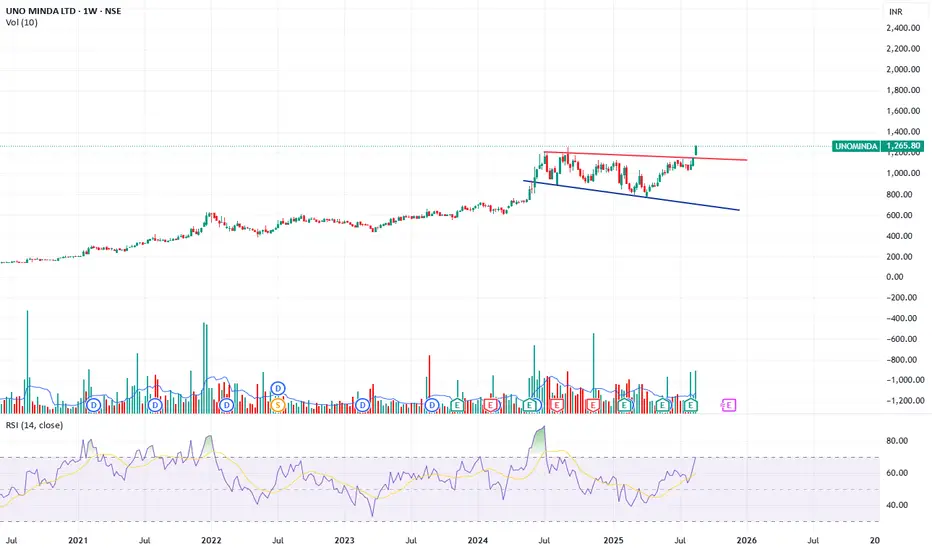
Uno Minda Ltd. (UNOMINDA)Friends,
This is the weekly chart of UNOMINDA. Here we are looking at the chart of last 10 years. There is a one trend line and some curve lines present in this chart. The trend line is working as support and the curve line is working as resistance.If you look carefully then Uno Minda Ltd. is a good company which has become a multibagger stock today.
And if you observe carefully you will find that every time the curve line crosses the UNOMINDA chart, the price moves upwards and never breaks the trend line.The trend line was not broken for at least last 8 years, but for last two years the trend line is breaking.Currently the stock is running below the trend line.
It is understood that if there is something wrong with the fundamentals of the stock, then it may be due to the top line i.e. sales getting affected, or the company may be facing debt problems, this can be understood by looking at the chat also.Stay tune!

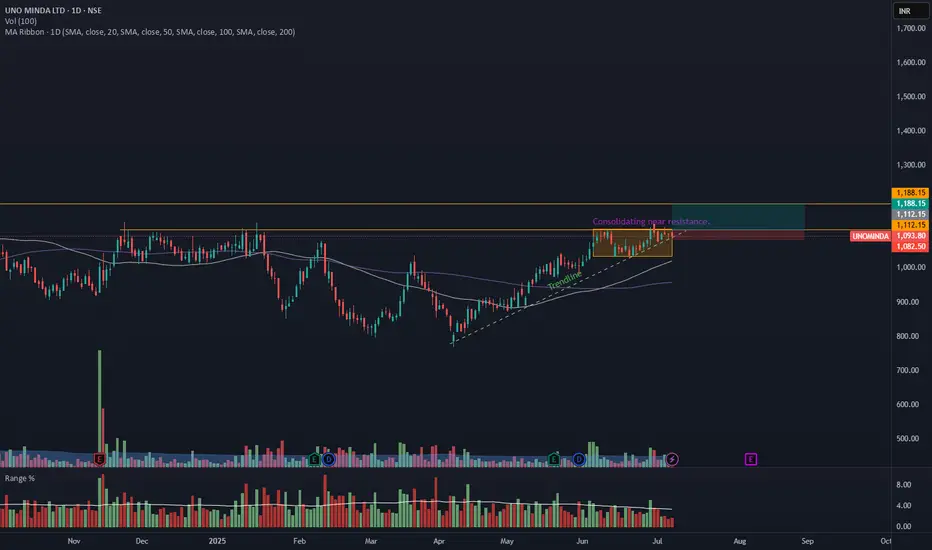
UNOMINDA – Daily Timeframe Breakout Idea (Resistance Zone Break)UNO MINDA LTD. has shown a breakout above a key horizontal resistance level on the daily chart, accompanied by a nearly 1.5 times volume surge near the breakout, as seen earlier, supported by strong momentum.
🔍 Breakout Context:
- Price might break above the ~₹1110 horizontal resistance, which had held for over 6 months.
- Breakout supported by more than average volume and just above average range near the resistance zone.
- The price is also trading above both the 50- and 100-day SMAs, indicating strong trend continuation.
- This aligns with a bullish continuation setup.
📉 Trade Plan:
- CMP: ₹1093
- Entry: Near ₹1112
- Target: ₹1188 (~7% upside from CMP)
- Stop-Loss: ₹1082
- Risk-Reward Ratio: ~1 : 2.0
📌 Note:
- Look for a confirmation candle to enter the trade.
- Avoid chasing the extended move unless confident in intraday momentum.
⚠️ Disclaimer: This post is for educational purposes only and not financial advice. Always do your research or consult a financial advisor before trading.
UNO Minda: Tight Wedge Breakout with Strong Trend Support
✅ UNO Minda is forming a falling wedge pattern on the weekly chart, which is a bullish continuation setup. The price is attempting a breakout above the converging trendline near the 1100–1120 zone.
✅ The stock is holding above its 200 EMA and the ascending trendline support, both reinforcing a strong underlying uptrend. The yellow moving average line around 869 is acting as a solid base.
✅ RSI is climbing steadily and is above 60, indicating good bullish momentum that supports a sustained breakout.
✅ Volumes are stable with occasional spikes, showing that buyers are stepping in near trendline supports, which is a healthy sign.
Outlook: A decisive weekly close above the wedge resistance zone with good volumes could propel UNO Minda towards the 1250–1300 levels in the coming weeks. The auto ancillary sector is looking robust with rising demand for premium components, EV parts, and new order wins boosting growth prospects for UNO Minda.

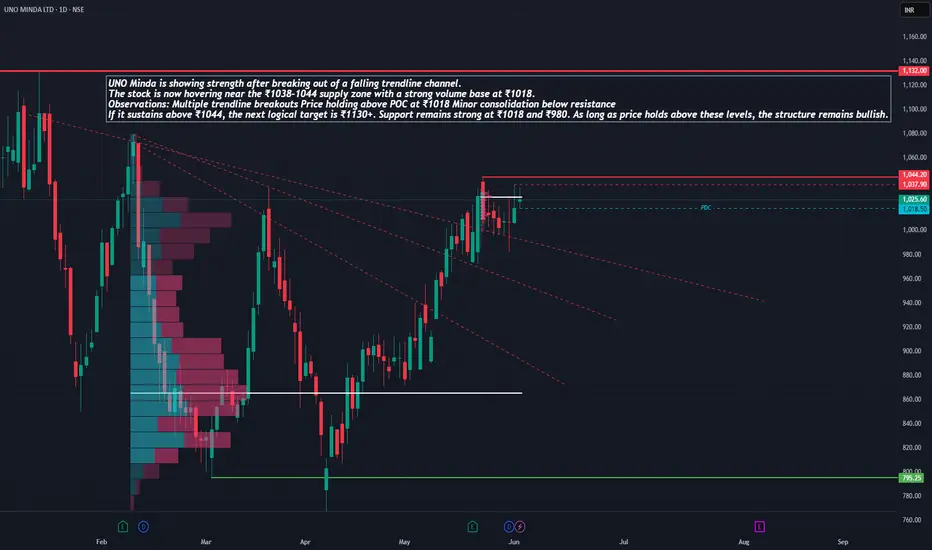
UNO MINDA – Ready to Revisit All-Time Highs?UNO Minda is showing strength after breaking out of a falling trendline channel. The stock is now hovering near the ₹1038–1044 supply zone with a strong volume base at ₹1018.
Observations:
Multiple trendline breakouts
Price holding above POC at ₹1018
Minor consolidation below resistance
If it sustains above ₹1044, the next logical target is ₹1130+. Support remains strong at ₹1018 and ₹980. As long as price holds above these levels, the structure remains bullish.
Like, comment your thoughts, and share this post
Explore more stock ideas on the right hand side your feedback means a lot to me!
Disclaimer: This post is for educational purposes only and should not be considered a buy/sell recommendation.
Uno MindaDate : 04.02.2025
Uno Minda
Timeframe : Day chart
Remarks :
buy above 1010, target 1071
Regards,
Ankur

#UNOMINDA - VCP + Hidden Trend Line Break Out📊 Script: UNOMINDA
Key highlights: 💡⚡
📈 VCP Break-Out in Daily chart.
📈 Price gave a good up move and consolidated before BO.
📈 Volume spike on Breakout
📈 MACD Cross Over
📈 One can go for Swing Trade.
📈 Enter ONLY above the Hidden Trend Line Break
BUY ONLY ABOVE 1147 DCB
⏱️ C.M.P 📑💰- 1115
🟢 Target 🎯🏆 – 19%
⚠️ Stoploss ☠️🚫 – 9.50%
⚠️ Important: Always Exit the trade before any Event.
⚠️ Important: Always maintain your Risk & Reward Ratio.
✅Boost, Like and follow to never miss a new idea!✅
Disclaimer: I am not SEBI Registered Advisor. My posts are purely for training and educational purposes.
Eat🍜 Sleep😴 TradingView📈 Repeat 🔁
Happy learning with MMT. Cheers!🥂

Uno Minda: Increase in Volume, But Can Price Break Free?Technical Analysis (Weekly Chart):
Volume Increase: Recent trading sessions have shown a notable rise in volume, indicating heightened investor interest.
Price Compression: Despite the increased volume, the stock's price has remained within a narrow range, suggesting consolidation.
Support Level: The stock has established a support level around ₹1,000, which has been tested multiple times in recent weeks.
Resistance Level: Resistance is observed near ₹1,105, a level the stock has approached but struggled to surpass.
Other resistance levels: 1135 | 1180 | 1254
Keep in mind:
Nifty remains in a correction phase. A deeper market correction could drag the stock price down (900-925), even if its current technicals suggest upward potential.
Disclaimer:
This analysis is intended for educational purposes and is not a recommendation to buy. It is important to learn how to recognize and understand patterns in stock movements.

Setting up UNOMINDA
+ Prior uptrend
+ Above Key EMAs
+ Rising sales & EPS
Disc : Charts are shared for educational Purposes only.

Triangle patternTriangle pattern on uno minda currently at pullback buy tomorrow
3% stop loss 20 % target
