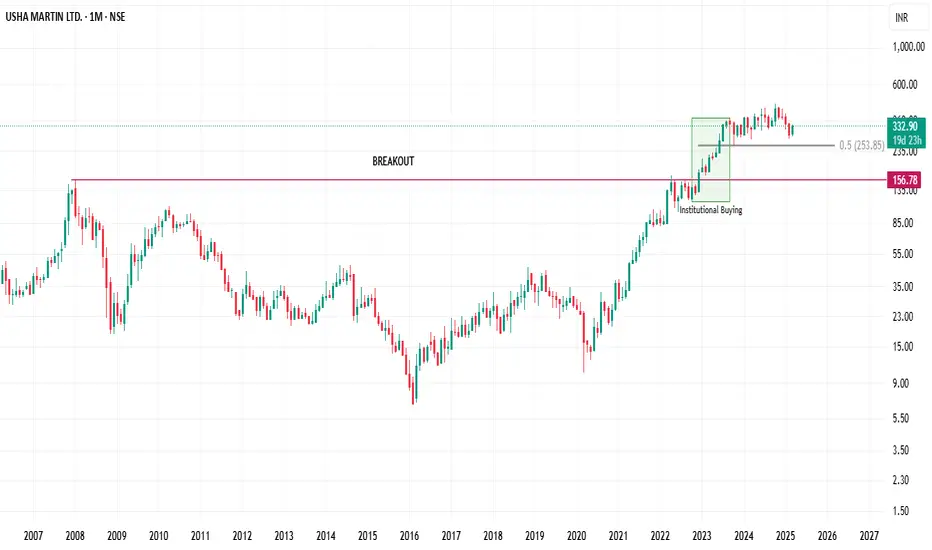
USHAMART Could it give good returns!!! #multibagger #NSE #BSEPrice breaking out of 1-year consolidation
Upside Price levels
Level 1 500
Level 2 550
Level 3 620
Level 4 800(High risk takers)
Time frame 1-2 years
Stoploss 420 (low risk takers)
Stoploss 340 (high risk takers)
Trade ideas

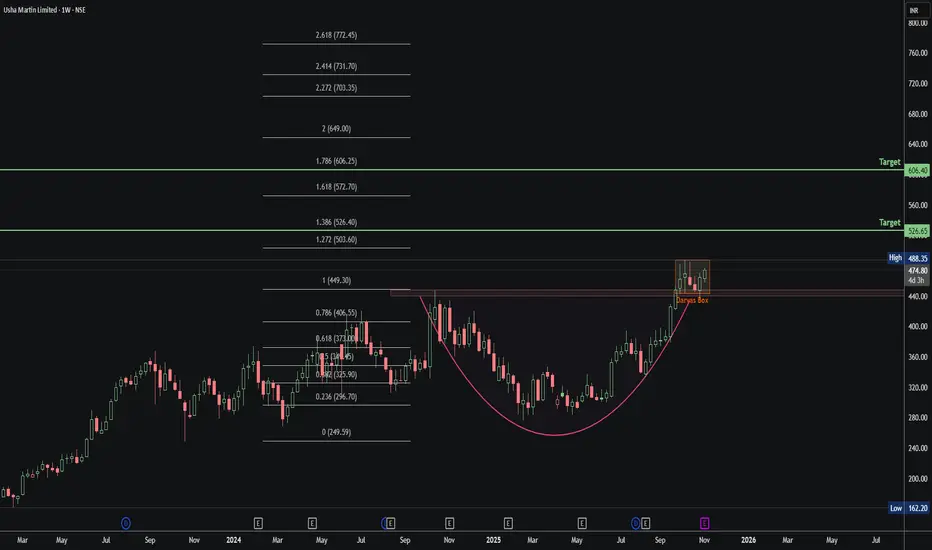
Usha Martin: Cup & Handle Breakout Loading!🧩 1. Cup & Handle Setup
Smooth U-shaped Cup with a tight Darvas Box Handle on top.
Classic bullish continuation structure — breakout confirmation above ₹488.
📈 2. Fibonacci Outlook
0.786 (₹406) → Neckline retest
1.0 (₹449) → Cup breakout
1.272 (₹503) / 1.386 (₹526) → 🎯 Short-term targets
1.618 (₹572) / 1.786 (₹606) → 🎯 Mid-term targets
🧱 3. Darvas Box
Tight consolidation between ₹471–₹488.
Low-volume zone = accumulation before breakout.
Break above ₹488 → continuation toward fib targets.
🔍 4. Key Levels
Support: ₹440 / ₹406
Resistance: ₹488
Targets: 🎯 ₹526 → ₹606 → ₹649
Invalidation: Close below ₹380
⚙️ 5. Psychology
Cup = Accumulation phase
Handle (Darvas Box) = Rest before breakout
Breakout = Momentum expansion with volume.
✅ Quick Summary
Pattern: Cup & Handle + Darvas Box
Trend Bias: Bullish continuation
Breakout Zone: ₹488+
Targets: ₹526 / ₹606 / ₹649
Stop Zone: Below ₹380
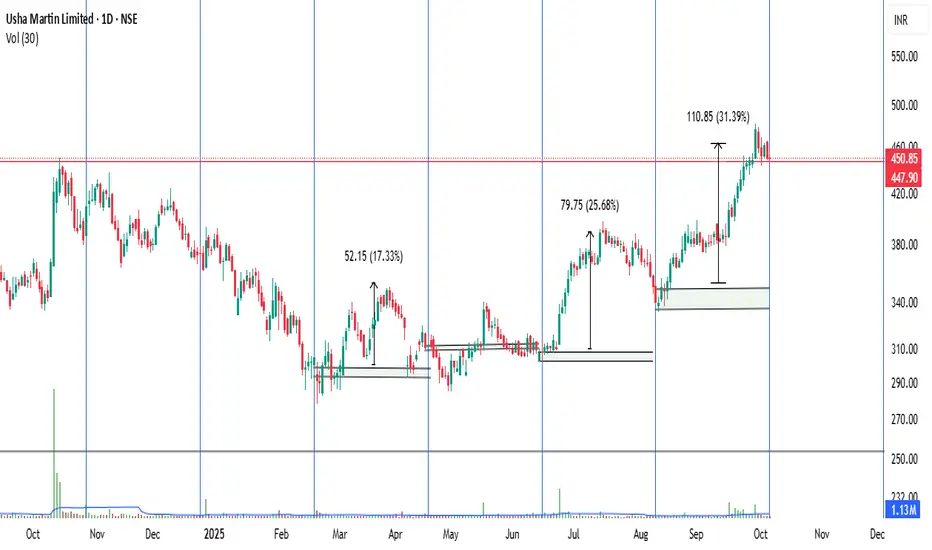
BUY TODAY SELL TOMORROW for 5%DON’T HAVE TIME TO MANAGE YOUR TRADES?
- Take BTST trades at 3:25 pm every day
- Try to exit by taking 4-7% profit of each trade
- SL can also be maintained as closing below the low of the breakout candle
Now, why do I prefer BTST over swing trades? The primary reason is that I have observed that 90% of the stocks give most of the movement in just 1-2 days and the rest of the time they either consolidate or fall
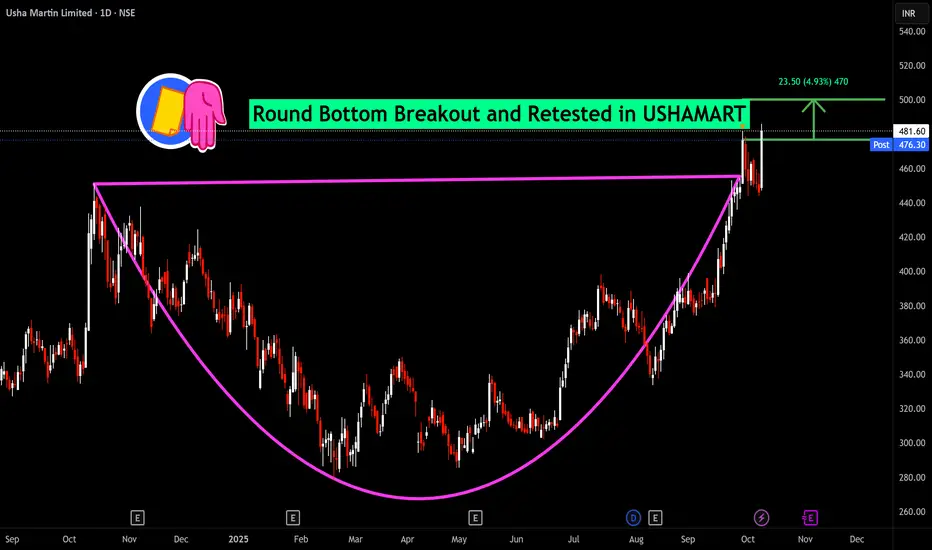
Round Bottom Breakout and Retested in USHAMART
BUY TODAY SELL TOMORROW for 5%
Usha Martin Ltd (USHAMART)Usha Martin Ltd (NSE: USHAMART) is an established Indian company primarily engaged in manufacturing steel wires, strands, wire ropes, cords, and related accessories, with additional involvement in optical fiber cables and other telecom products. Founded in 1960 and headquartered in Kolkata, it serves key sectors like infrastructure, automotive, mining, elevators, and offshore oil & gas. As of October 2025, the stock trades around ₹450–₹462, with a market cap of approximately ₹13,800–14,000 crore. While stock investing involves risks and isn't a recommendation, here are substantiated reasons why analysts and investors might view it as a compelling buy, based on recent financials, market trends, and technical signals.
Strong Financials: ₹403 Cr profit in FY25, 23% EPS growth, low debt (0.05 D/E), 14.8% ROE.
Technical Breakout: Bullish patterns, support at ₹425–₹440, targets ₹500–₹590.
Growth Drivers: Infrastructure, auto, EV, and telecom demand; export growth.
Risks: Commodity volatility, modest sales growth (10% 5Y).
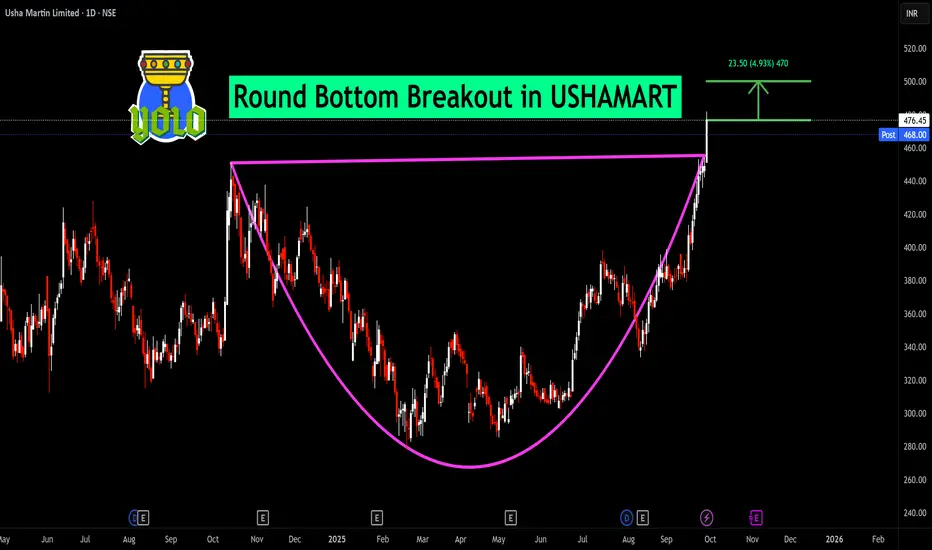
BUY TODAY SELL TOMORROW for 5%DON’T HAVE TIME TO MANAGE YOUR TRADES?
- Take BTST trades at 3:25 pm every day
- Try to exit by taking 4-7% profit of each trade
- SL can also be maintained as closing below the low of the breakout candle
Now, why do I prefer BTST over swing trades? The primary reason is that I have observed that 90% of the stocks give most of the movement in just 1-2 days and the rest of the time they either consolidate or fall
Round Bottom Breakout in USHAMART
BUY TODAY SELL TOMORROW for 5%
usha martinPrice has formed an inverted Head & Shoulders, a reversal pattern signaling strength.
Breakout above neckline near ₹398 has triggered upward momentum.
Current price is around ₹410, with next resistance/target near ₹447.
Stop loss area is around ₹367 to manage risk.
Trend remains positive as long as it sustains above breakout zone.
👉 In short: Bullish bias with target ₹447; support at ₹367.

#USHAMART - VCP BreakOut in Daily Time Frame Script: USHAMART
Key highlights: 💡⚡
📈 VCP BreakOut in Daily Time Frame
📈 Price consolidated near Resistance before BO
📈 Volume spike during Breakout
📈 MACD Crossover
📈 Stock is near ATH
📈 Can go for a swing trade
BUY ONLY ABOVE 410 DCB
⏱️ C.M.P 📑💰- 407
🟢 Target 🎯🏆 – 12.90%
⚠️ Stoploss ☠️🚫 – 6.20%
⚠️ Important: Market conditions are Okish, Position size 50% per Trade. Protect Capital Always
⚠️ Important: Always Exit the trade before any Event.
⚠️ Important: Always maintain your Risk:Reward Ratio as 1:2, with this RR, you only need a 33% win rate to Breakeven.
✅Like and follow to never miss a new idea!✅
Disclaimer: I am not SEBI Registered Advisor. My posts are purely for training and educational purposes.
Eat🍜 Sleep😴 TradingView📈 Repeat 🔁
Happy learning with MMT. Cheers!🥂
Usha Martin LtdDate 28.08.2025
Usha Martin
Timeframe : Weekly Chart
About
(1) Usha Martin Ltd is primarily engaged in manufacture and sale of steel wires, strands, wire ropes, cords, related accessories
(2) It ranks among the top five manufacturers in the sector
Revenue Mix
Product-Wise
(1) Wire Rope: 73% in H1FY25 vs 67% in FY23
(2) LRPC: 10% in H1FY25 vs 15% in FY23
(3) Wire & Strand: 9% in H1FY25 vs 10% in FY23
(4) Others: 8%
End-User Segment:
(1) Engineering: 20%
(2) Oil & Offshore: 20%
(3) Crane: 16%
(4) Construction & Infrastructure: 12%
(5) Elevator: 9%
(6) Others: 23%
Geography-Wise:
(1) India: 45%
(2) Europe: 25%
(3) Asia Pacific: 13%
(4) Middle East & Africa: 9%
(5) America: 8%
Valuations
(1) Market Cap ₹ 11,629 Cr
(2) Stock P/E 28.8
(3) ROCE 18.8 %
(4) ROE 15.8 %
(5) OPM 17%
(6) Sales Growth 9.20%
(7) Promoter 42.45%
(8) DII 11.06%
(9) FII 14.29%
Regards,
Ankur

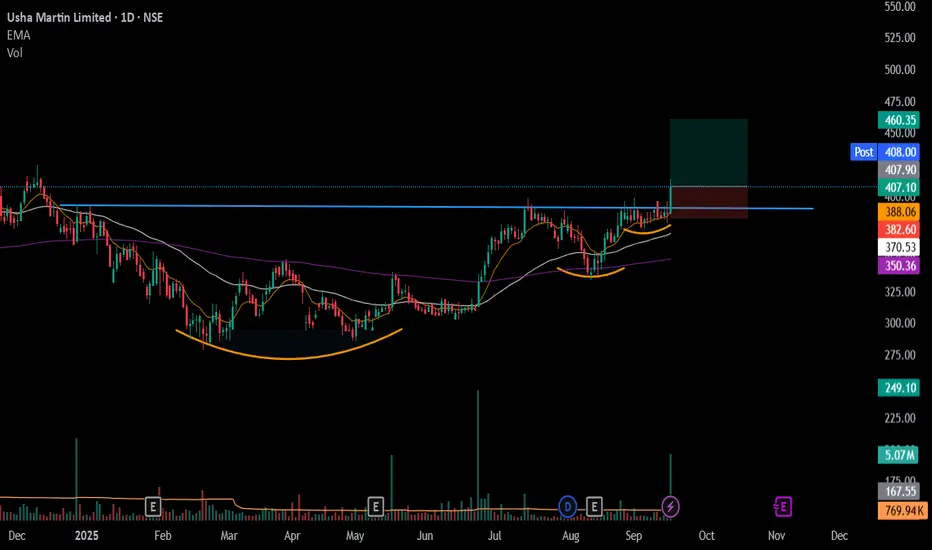
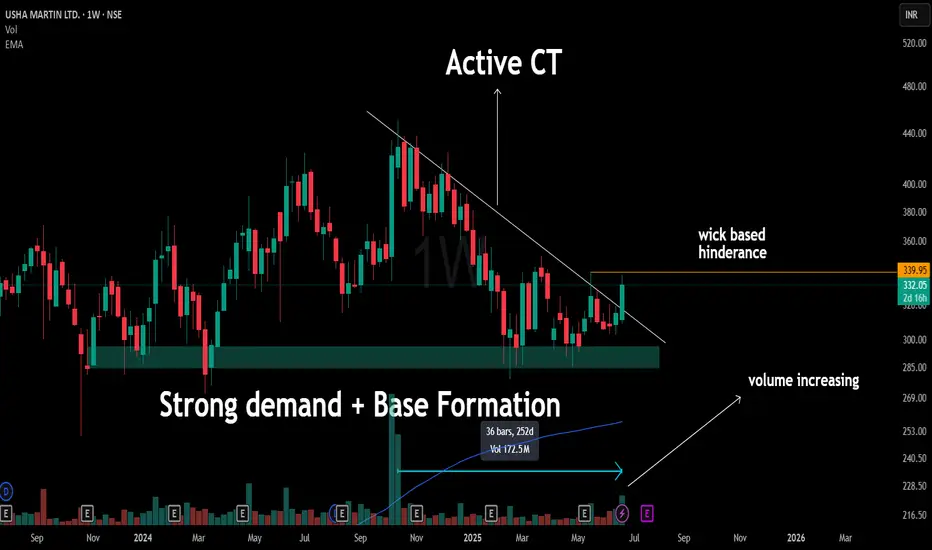
USHA MARTIN – Weekly Structure SnapshotA clean White CT that had acted as a multi-month resistance is now being engaged. Price is attempting to push above it, but the current candle is still developing — small-bodied so far, which is typical during early phases of structural tests on the weekly timeframe (WTF).
🟧 Just above lies a wick-based hindrance — a level that previously reacted with strong rejection. It's also where the current active CT had its last struggle, making it a structurally relevant zone, not something to ignore.
The base that formed in the ₹270–290 region stands out — multiple rejections without deeper breakdowns, a sign of demand stability. Volume expansion this week is notable — especially after 252 days of subdued activity — marking a shift in participation worth observing.
📌 This is not a prediction. Not a forecast. Not a trading call.
Just a structural walkthrough of what price is doing — and where attention has historically been paid.
Let the price write the story — our job is to read structure, not write headlines.
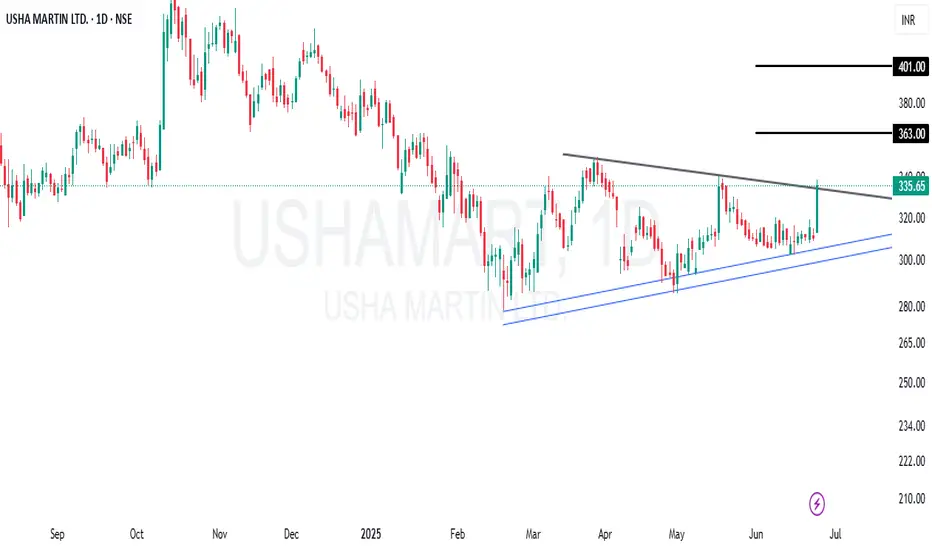
Ascending Triangle Breakout| Element | Details |
| ------------------ | ---------------------------- |
| **Pattern** | Ascending Triangle Breakout |
| **Breakout Level** | ₹330–₹335 |
| **Entry** | ₹330–₹338 |
| **Stop Loss** | ₹319 / ₹305 |
| **Target 1** | ₹363 |
| **Target 2** | ₹401 |
| **Volume** | High — Breakout Confirmation |
| **Trend** | Bullish (Short-Term) |
| **Holding Time** | 2–6 weeks (Swing Position) |
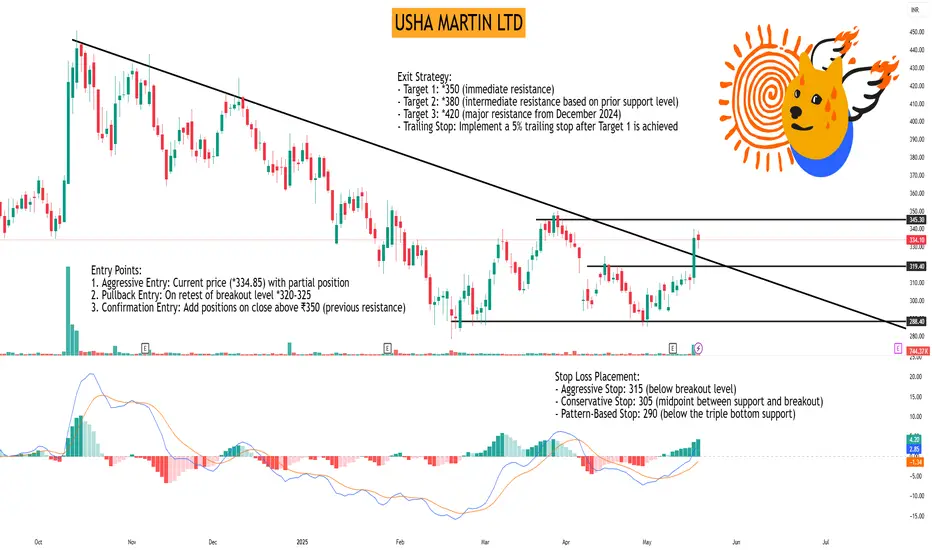
USHA MARTIN BREAKS OUT! 7.5% SURGE SIGNALS MASSIVE RALLY AHEADNSE:USHAMART Made Beautiful Chart Structure of Kinda Triple Bottom Reversal Pattern today after Q4 Results with Good Price and Volume action and Breaking the Trendline.
Price Action:
- The stock has been in a downtrend since November 2024, forming a clear descending resistance line (white diagonal Trendline)
- Currently showing strong breakout momentum at ₹334.85, up ₹23.75 (+7.46%) in today's session
- Successfully broken above both the downtrend line and horizontal resistance at ₹320-325
- Multiple tests of support at the ₹290 level have created a solid base for the current rally
- Higher lows forming since March indicate increasing buying pressure
Volume Analysis:
- Today's volume at 4.98M shares vs. average of 688.65K (over 7x normal volume)
- Previous support bounces (green arrows) also occurred with increased volume
- Extremely high volume on today's breakout confirms strong institutional interest
- Volume profile shows healthy accumulation during support tests
Key Support and Resistance Levels:
- Strong support established at ₹290 level (green horizontal line)
- Intermediate resistance/support at ₹320-325 (lower red horizontal line)
- Major resistance at ₹350 level (upper red horizontal line)
- The previous rejection point at ₹350 (red arrow) now becomes the next target
- Long-term resistance from October to December 2024 around ₹420
Technical Patterns:
1. Downtrend Line Breakout*- Price has decisively broken above the multi-month downtrend line
2. Kinda Triple Bottom- Formed at ₹290 level (February-May), creating a solid foundation
3. Ascending Triangle- Recent price action shows higher lows against horizontal resistance
4. Volume Confirmation- Massive volume spike validates the technical breakout
5. Bullish Engulfing Candle- Today's price action engulfs previous bearish candles
Trade Setup:
- Pattern: Downtrend line breakout + horizontal resistance break
- Confirmation: Strong price action with 7x normal volume
- Context: Potential trend reversal after extended downtrend and base formation
Entry Points:
1. Aggressive Entry: Current price (₹334.85) with partial position
2. Pullback Entry: On retest of breakout level ₹320-325
3. Confirmation Entry: Add positions on close above ₹350 (previous resistance)
Exit Strategy:
- Target 1: ₹350 (immediate resistance)
- Target 2: ₹380 (intermediate resistance based on prior support level)
- Target 3: ₹420 (major resistance from December 2024)
- Trailing Stop: Implement a 5% trailing stop after Target 1 is achieved
Stop Loss Placement:
- Aggressive Stop: ₹315 (below breakout level)
- Conservative Stop: ₹305 (midpoint between support and breakout)
- Pattern-Based Stop: ₹290 (below the triple bottom support)
Risk Management:
- Position sizing: Limit risk to 1-2% of trading capital
- Risk-reward ratio: Maintain at least 1:1.5 (with aggressive stop)
- Consider scaling in: 50% at current level, 25% on pullback, 25% on further confirmation
- Scale out: 30% at Target 1, 40% at Target 2, hold remainder with trailing stop
Today's powerful breakout on record volume after forming a kinda triple bottom pattern suggests a potential trend reversal. The breakout above both the descending trendline and horizontal resistance provides a compelling technical case for upside continuation. If the stock can maintain momentum above the ₹325 level, it could target the next resistance at ₹350 quickly, with potential for a move toward ₹380-420 in the coming weeks.
Keep in the Watchlist.
NO RECO. For Buy/Sell.
📌Thank you for exploring my idea! I hope you found it valuable.
🙏FLLOW for more
👍BOOST if useful
✍️COMMENT below with your views.
Meanwhile, check out my other stock ideas on the right side until this trade is activated. I would love your feedback.
Disclaimer: "I am not a SEBI REGISTERED RESEARCH ANALYST AND INVESTMENT ADVISER."
This analysis is intended solely for informational and educational purposes and should not be interpreted as financial advice. It is advisable to consult a qualified financial advisor or conduct thorough research before making investment decisions.

USHA MARTIN LTD.USHA MARTIN LTD.
USHA MARTIN BREAKS OUT! 7.5% SURGE SIGNALS MASSIVE RALLY AHEAD
USHAMART
Made Beautiful Chart Structure of Kinda Triple Bottom Reversal Pattern today after Q4 Results with Good Price and Volume action and Breaking the Trendline.
Price Action:
-The stock has been in a downtrend since November 2024, forming a clear descending resistance line (white diagonal Trendline)
-Currently showing strong breakout momentum at ₹334.85, up *23.75 (+7.46%) in today's session
-Successfully broken above both the downtrend line and horizontal resistance at *320-325
-Multiple tests of support at the *290 level have created a solid base for the current rally
-Higher lows forming since March indicate increasing buying pressure
Volume Analysis:
- Today's volume at 4.98M shares vs. average of 688.65K (over 7x normal volume) -Previous support bounces (green arrows) also occurred with increased volume - Extremely high volume on today's breakout confirms strong institutional interest - Volume profile shows healthy accumulation during support tests
Key Support and Resistance Levels:
- Strong support established at *290 level (green horizontal line)
- Intermediate resistance/support at *320-325 (lower red horizontal line)
-Major resistance at *350 level (upper red horizontal line)
- The previous rejection point at ₹350 (red arrow) now becomes the next target
- Long-term resistance from October to December 2024 around *420
Technical Patterns:
1. Downtrend Line Breakout*- Price has decisively broken above the multi-month downtrend line
2. Kinda Triple Bottom- Formed at ₹290 level (February-May), creating a solid foundation
3. Ascending Triangle- Recent price action shows higher lows against horizontal resistance
4. Volume Confirmation- Massive volume spike validates the technical breakout
5. Bullish Engulfing Candle-Today's price action engulfs previous bearish candles
Trade Setup:
- Pattern: Downtrend line breakout + horizontal resistance break
- Confirmation: Strong price action with 7x normal volume
- Context: Potential trend reversal after extended downtrend and base formation
Entry Points:
1. Aggressive Entry: Current price (*334.85) with partial position
2. Pullback Entry: On retest of breakout level *320-325
3. Confirmation Entry: Add positions on close above ₹350 (previous resistance)
Exit Strategy:
- Target 1: *350 (immediate resistance)
- Target 2: *380 (intermediate resistance based on prior support level)
- Target 3: *420 (major resistance from December 2024)
- Trailing Stop: Implement a 5% trailing stop after Target 1 is achieved
Stop Loss Placement:
- Aggressive Stop: 315 (below breakout level)
- Conservative Stop: 305 (midpoint between support and breakout)
- Pattern-Based Stop: 290 (below the triple bottom support)
Risk Management:
- Position sizing: Limit risk to 1-2% of trading capital
-Risk-reward ratio: Maintain at least 1:1.5 (with aggressive stop)
- Consider scaling in: 50% at current level, 25% on pullback, 25% on further confirmation
- Scale out: 30% at Target 1, 40% at Target 2, hold remainder with trailing stop
Today's powerful breakout on record volume after forming a kinda triple bottom pattern suggests a potential trend reversal. The breakout above both the descending trendline and horizontal resistance provides a compelling technical case for upside continuation. If the stock can maintain momentum above the *325 level, it could target the next resistance at ₹350 quickly, with potential for a move toward *380-420 in the coming weeks.
Keep in the Watchlist.
NO RECO. For Buy/Sell.
Thank you for exploring my idea! I hope you found it valuable.
FLLOW for more
BOOST if useful
COMMENT below with your views.
Meanwhile, check out my other stock ideas on the right side until this trade is activated. I would love your feedback.
Disclaimer: "I am not a SEBI REGISTERED RESEARCH ANALYST AND INVESTMENT ADVISER."
This analysis is intended solely for informational and educational purposes and should not be interpreted as financial advice. It is advisable to consult a qualified financial advisor or conduct thorough research before making investment decisions.
Usha Martin LtdUsha Martin Ltd(Smallcap) is primarily engaged in manufacture and sale of steel wires, strands, wire ropes, cords, related accessories, etc. It is also involved in sale of other products such as wire drawing and allied machines.
The company offers a range of specialty wire ropes, high-quality wires, low relaxation prestressed concrete steel strands (LRPC), bespoke end-fitments, accessories, and related services. It also manufactures jelly-filled and optical fiber telecommunication cables.
USHAMART - TRENDLINE RESISTANCEUSHAMART - TRENDLINE RESISTANCE - 30min CHART
Analysis based on Price Action strategy.
For learning and educational purposes only, not a trading advice. Pls consult your financial advisor before investing.

USHAMART BULLISHHUSHA MARTIN LTD is looking strong upside.
Entry for swing trade
You can go for it after doing your own analysis.
entry price target and stop loss has been updated in the chart.
ONLY FOR EDUCATIONAL PURPOSE..!

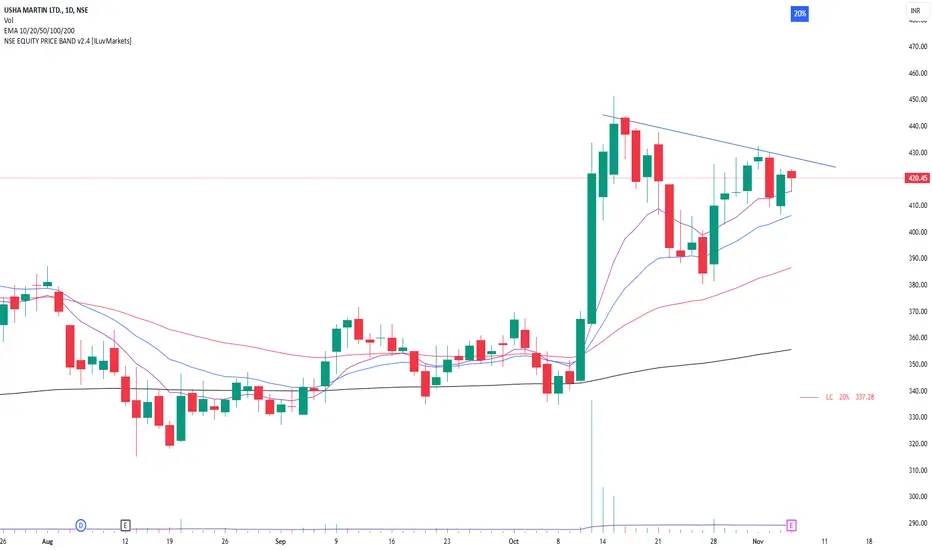
Moving within a channel with resistance becoming support UshaMarMoving within a parallel channel with resitance becoming support and breakout after retest on 15 min chart. Take profits accord to fib levels. This is not a financial advice please do your research before placing trades.

Inside BarUSHAMART
+ Strong prior Move followed by a low volume base
+ Inside bar at 10 EMA
+ Above Key EMAs
Disc : Charts are shared for educational Purposes only.
Amazing breakout on Weekly / Daily Timeframe - USHAMARTCheckout an amazing breakout happened in the stock in Weekly timeframe, macroscopically seen in Daily timeframe. Having a great favor that the stock might be bullish expecting a staggering returns of minimum 25% TGT. IMPORTANT BREAKOUT LEVELS ARE ALWAYS RESPECTED!
NOTE for learners: Place the breakout levels as per the chart shared and track it yourself to get amazed!!
#No complicated chart patterns
#No big big indicators
#No Excel sheet or number magics
TRADE IDEA: WAIT FOR THE STOCK TO BREAKOUT IN LOWER TIMEFRAME AND RETRACE IF NEEDED. SL IS NEARER SUPPORT ZONE IN Daily TIMEFRAME.
Checkout an amazing breakout happened in the stock in Weekly timeframe.
Breakouts happening in longer timeframe is way more powerful than the breakouts seen in Daily timeframe. You can blindly invest once the weekly candle closes above the breakout line and stay invested forever. Also these stocks breakouts are lifelong predictions, it means technically these breakouts happen giving more returns in the longer runs. Hence, even when the scrip makes a loss of 10% / 20% / 30% / 50%, the stock will regain and turn around. Once they again enter the same breakout level, they will flyyyyyyyyyyyy like a ROCKET if held in the portfolio in the longer run.
Time makes money, GREEDY & EGO will not make money.
Also, magically these breakouts tend to prove that the companies turn around and fundamentally becoming strong. Also the magic happens when more diversification is done in various sectors under various scripts with equal money invested in each N500 scripts.
The real deal is when to purchase and where to purchase the stock. That is where Breakout study comes into play.
LET'S PUMP IN SOME MONEY AND REVOLUTIONIZE THE NATION'S ECONOMY!

Usha Martin AnalysisHello Traders, an upside moment is expected in usha martin as it is consolidating near all time high and we can see a momentum upwards in this stock soon once it sustains above resistance in coming trading sessions.

WAVE Confirmation = Strong BuyWeakly Timeframe : MACD - RSI - Stosch = Strong buy
Daily - RSI & Stosch = Strong Buy
Candle - Bullish Candle
Volume - Above Average
EMA - Positive Crossover
Chart Pattern - Cup & handle
FIB Retracement - 50%
Divergence - N/A

USHAMART - INVERTED HEAD & SHOULDERUSHAMART is seemed to be making an Inverted H&S pattern. It may go down make 2nd shoulder and then reverse. Formation of a Hammer candle at 2nd shoulder will be a good confirmation.
It is also moving in an Ascending Channel from June 2023 at Weekly chart.
330 seems a good support, horizontal and lower trendline, it may reverse from this level.
420-427 seems a Resistance.
Finding right support and resistance levels are important, and price action makes it better to understand.
For learning and educational purposes only, not an advice!

Ushamartin -Breakout viewUshaMart :
Closed above Resistance levels
Need to sustain 440 levels, immediate support at 425 and 410

Keep an EYE on Usha Martin LtdBigger the consolidation better the breakout / so keep an eye on usha martin ltd / high probability of channel breakout on daily chart. cmp 413.40 Plan your trade
not a buy or sell recommendation / do your analysis before take a trade
