UTI Asset Management Company Ltd ViewKey Market Data (as of August 7, 2025)
NSE Ticker: UTIAMC
Last Traded Price: ₹1,321.00
52-Week Range: ₹906.40 – ₹1,494.95
Market Capitalization: ₹16,916.59 Cr
UTI Asset Management Company Ltd is India’s oldest mutual fund house, originally formed under the Unit Trust of India Act, 1963. After the Act’s repeal, UTI AMC was incorporated in February 2003 and is registered with SEBI under the SEBI (Mutual Funds) Regulations, 1996. It operates nationwide with over 174 financial centres and serves investors through domestic schemes and AMFI-certified advisors.
Key Insights
The consensus average across major aggregators sits around ₹1,375–1,430, implying a modest upside vs. current levels.
Targets at ₹1,650 and ₹1,500 respectively, reflecting bullish views on AUM growth and profitability expansion.
Recommendation Considerations
Investors should weigh these targets against UTIAMC’s strong dividend yield, zero-debt balance sheet, and recent equity AUM momentum when forming a view on potential upside vs. downside.
P/E (TTM) : 23.60|P/B :3.66m|EPS (TTM) : ₹55.75|Book Value: ₹359.01|
Metric Value
ROE 15.91%
Dividend Yield 3.64%
Debt/Equity 0.00
Disclaimer: lnkd.in
UTIAMC trade ideas

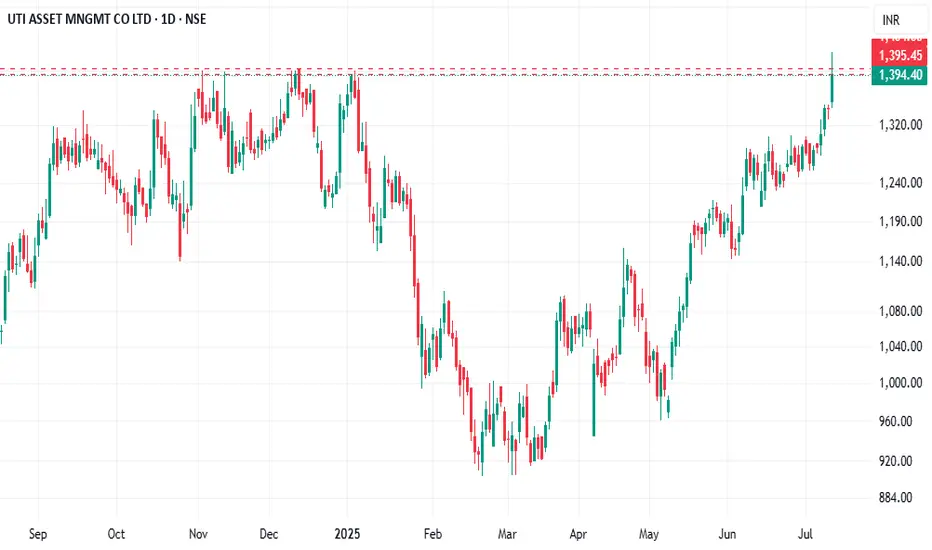
UTI Asset Management Co. Ltd Potential for New High?The stock is in a strong bullish trend since April.
A sequence of higher highs and higher lows indicates sustained buying.
Outlook: Potential for New High?
✅ Yes — If the stock sustains above ₹1,395 with volume confirmation, it has a strong chance of making new highs in the near term.
⚠️ However, a failure to hold this level may lead to a pullback toward ₹1,320–₹1,350.
📜 Disclaimer:
This analysis is for educational and informational purposes only and does not constitute investment advice. Stock markets are subject to risks, and past performance is not indicative of future results. Please consult your financial advisor before making any investment decisions.
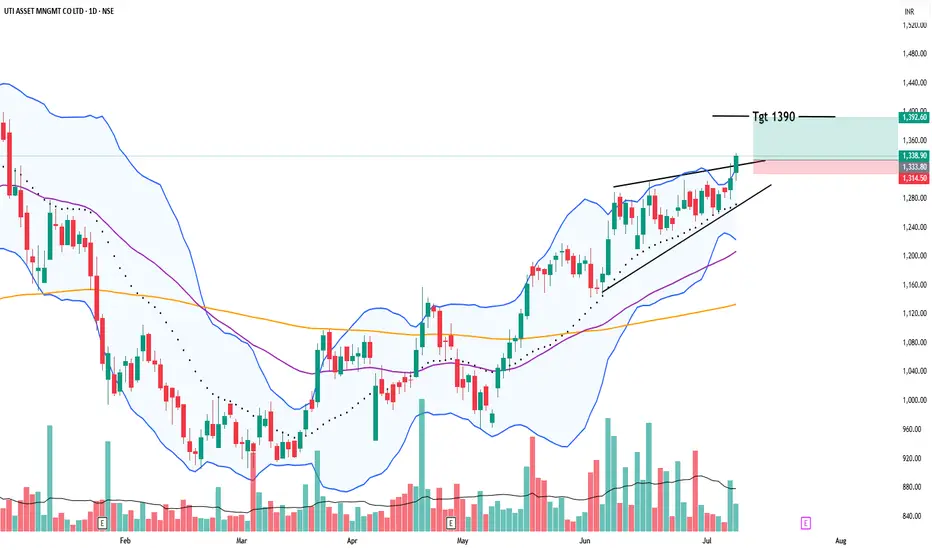
UTI ASSET MANAGEMENTBullish Trend Making HL's & HH's
With High TF in Favour
Chart Pattern: Flag BO
Tgt 1390 ( Study Purpose )
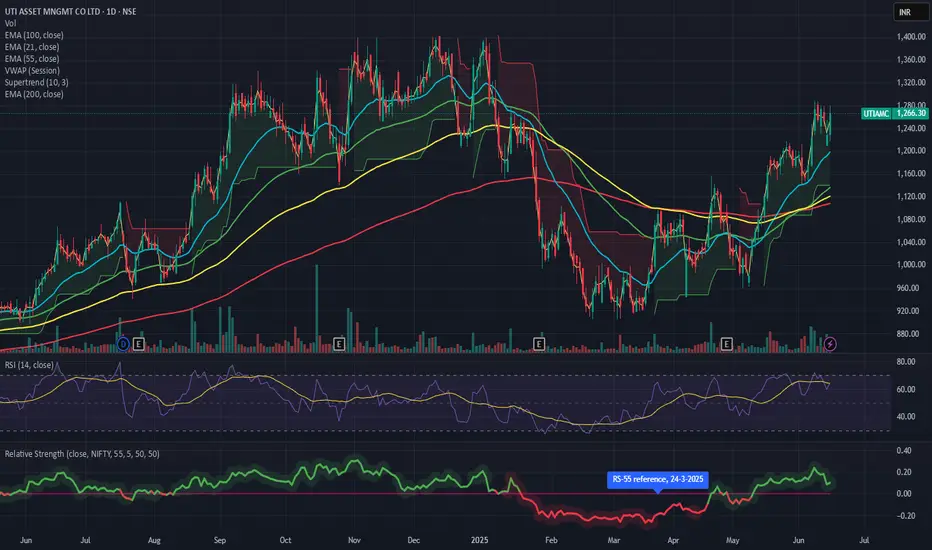
UTI AMC Ready to Explode? Breakout + Volume = Action TimeUTI AMC just broke out of consolidation with strong volume and bullish structure.
Price is above all major EMAs + VWAP.
RSI strong, breakout candle clean, and broker upgrades are backing the story (Motilal Oswal: ₹1550 target).
Trade Plan:
🎯 Entry: ₹1255–1270
🔐 SL: ₹1225
🎯 Target 1: ₹1320
🎯 Target 2: ₹1375
#UTIAMC #BreakoutTrade #SwingSetup #TradingViewIndia #SniperSetup
UTI ASSET MNGMT - Bullish Flag & Pole Breakout (Daily T/F)Trade Setup
📌 Stock: UTI ASSET MNGMT ( NSE:UTIAMC )
📌 Trend: Strong Bullish Momentum
📌 Risk-Reward Ratio: 1:3 (Favorable)
🎯 Entry Zone: ₹1220.45(Breakout Confirmation)
🛑 Stop Loss: ₹1141.00(Daily Closing Basis) (-6.6% Risk)
🎯 Target Levels:
₹1253.75
₹1287.95
₹1323.05
₹1355.50
₹1390.60
₹1424.70
₹1461.60 (Final Target)
Technical Rationale
✅ Bullish Flag & Pole Breakout - Classic bullish pattern confirming uptrend continuation
✅ Strong Momentum - Daily, Weekly & Monthly RSI >60 (Bullish zone)
✅ Volume Confirmation - Breakout volume 754.88K vs previous day's 178.21K (Nearly 4.5x surge)
✅ Multi-Timeframe Alignment - Daily and weekly charts showing strength
Key Observations
• The breakout comes with significantly higher volume, validating strength
• Well-defined pattern with clear price & volume breakout
• Conservative stop loss at recent swing low
Trade Management Strategy
• Consider partial profit booking at each target level
• Move stop loss to breakeven after Target 1 is achieved
• Trail stop loss to protect profits as price progresses
Disclaimer ⚠️
This analysis is strictly for educational purposes and should not be construed as financial advice. Trading in equities involves substantial risk of capital loss. Past performance is not indicative of future results. Always conduct your own research, consider your risk appetite, and consult a financial advisor before making any investment decisions. The author assumes no responsibility for any trading outcomes based on this information.
What do you think? Are you watching NSE:UTIAMC for this breakout opportunity? Share your views in the comments!

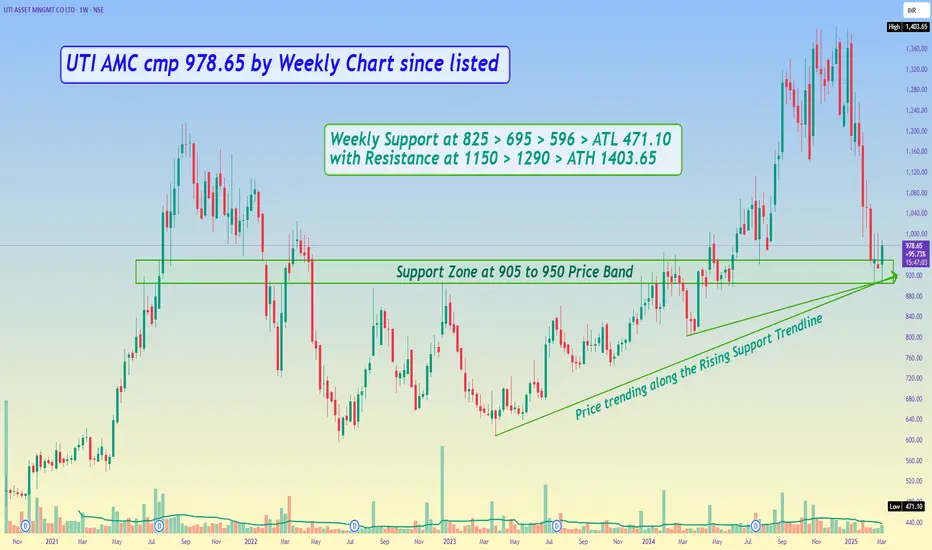
UTI AMC cmp 978.65 by Weekly Chart since listedUTI AMC cmp 978.65 by Weekly Chart since listed
- Support Zone at 905 to 950 Price Band
- Price trending along the Rising Support Trendline
- Weekly Support at 825 > 695 > 596 > ATL 471.10 with Resistance at 1150 > 1290 > ATH 1403.65
UTI Showing signs of reversal. Add to your WL📊 Stock Analysis for UTI AMC
🔘Entry Levels:
Initial Entry (Small Qty): ₹1,260
Fresh Entry: Above ₹1,405 (with a strong breakout and good volume)
Stop Loss (SL):
₹1,133 (below the 200DMA and major support zone)
Target Levels (T):
T1: ₹1,405
T2: ₹1,721
Risk-to-Reward (R:R):
From Initial Entry to T2: Approx. 1:2.6
From Fresh Entry (T1) to T2: Approx. 1:2
🔘Setup Overview
The stock has consistently taken support at the 200 DMA, indicating strong demand at lower levels.
It’s currently consolidating near the ₹1,260-₹1,400 zone, forming a potential breakout pattern.
A breakout above ₹1,405 with high volume can lead to a new bullish rally.
⚠️Risk Considerations
Below ₹1,133, the structure may turn bearish, invalidating the setup.
Ensure the breakout above ₹1,405 is confirmed with strong volume and price action.
🔘Reasons for Risk Level
The 200 DMA support provides a good risk management level.
If the stock breaks down below ₹1,133, it could retest lower levels, indicating a potential trend reversal.
❗️Disclaimer
This analysis is for informational purposes only and should not be considered financial advice. Please conduct your own research or consult a financial advisor before making investment decisions. Trading in the stock market involves risk, and past performance is not indicative of future results.

3 Yrs Break Out on Monthly Frame with RetracementUTI AMC
Very Strong Fundamentals
Decent Long Term Pick for Investors
Plz Choice ANY 1 of the trading options & STICK to it
LTP 1320
For QUICK Traders
Enter Now with SL @ 1275
Tgts of 1400 & 1440
For Positional Traders
Add on Dips till 1200
SL CLB 1160 & 1100 ( Depending on your risk Appetite )
Targets 1450-1525-1625-1675-1775-1855
Don't forget to Boost 🚀 this idea
For more info - Plz visit my profile & follow me
Rgds,
Naresh G
Sebi Reg. RA

UTI ASSET MGT UTIAMC Is showing strength and it crossed its all time high in this falling market also , now market is stabilised and again resuming its original northside direction so stock will hit our target within three month, lets see.

Amazing breakout on Weekly / Daily Timeframe - UTIAMCCheckout an amazing breakout happened in the stock in Weekly timeframe, macroscopically seen in Daily timeframe. Having a great favor that the stock might be bullish expecting a staggering returns of minimum 25% TGT. IMPORTANT BREAKOUT LEVELS ARE ALWAYS RESPECTED!
NOTE for learners: Place the breakout levels as per the chart shared and track it yourself to get amazed!!
#No complicated chart patterns
#No big big indicators
#No Excel sheet or number magics
TRADE IDEA: WAIT FOR THE STOCK TO BREAKOUT IN LOWER TIMEFRAME AND RETRACE IF NEEDED. SL IS NEARER SUPPORT ZONE IN Daily TIMEFRAME.
Checkout an amazing breakout happened in the stock in Weekly timeframe.
Breakouts happening in longer timeframe is way more powerful than the breakouts seen in Daily timeframe. You can blindly invest once the weekly candle closes above the breakout line and stay invested forever. Also these stocks breakouts are lifelong predictions, it means technically these breakouts happen giving more returns in the longer runs. Hence, even when the scrip makes a loss of 10% / 20% / 30% / 50%, the stock will regain and turn around. Once they again enter the same breakout level, they will flyyyyyyyyyyyy like a ROCKET if held in the portfolio in the longer run.
Time makes money, GREEDY & EGO will not make money.
Also, magically these breakouts tend to prove that the companies turn around and fundamentally becoming strong. Also the magic happens when more diversification is done in various sectors under various scripts with equal money invested in each N500 scripts.
The real deal is when to purchase and where to purchase the stock. That is where Breakout study comes into play.
LET'S PUMP IN SOME MONEY AND REVOLUTIONIZE THE NATION'S ECONOMY!

UTI ASSET MNGMT#Debt free #Asset #Management company with good ROCE & ROE
given Breakout in #Monthly Chart with good #Volume.
#IPO Price above closed.
#UTIAMC CMP 1334 TGT 1838 SL 1200 (Monthly Clbs)
#Profit #Growth witnessed in last two years with good ROCE
Good FII+DII Holding #Dividend
Follow us for more such suggestions.


Diwali Pick-2 - UTIAMCDiwali Pick -2 --UTIAMC
Closed above long term resistance (Re-test done and currently fresh breakout), multiyear breakout in progress
Looks great above 1370 with support at 1200

Cheapest AMC Stock In India NSE:UTIAMC
Breakout then Retest
Now Ready for Big Up move
What you think ? 1700+ Coming in next 6 month or not!

UTIAMC- Re-test and Fresh BreakoutUTIAMC : Long term view
Closed above long term resistance (Re-test and currently fresh breakout), multiyear breakout in progress
Looks good above 1355 with support at 1200

Retesting Major Levels UTI AMCNSE:UTIAMC after giving a rounding bottom breakout on weekly charts is now retesting breakout levels. Keep in Radar.
Check out my other stock ideas below until this trade gets activated, I would love your feedback.
Disclaimer: This analysis is intended solely for informational and educational purposes and should not be interpreted as financial advice. It is advisable to consult a qualified financial advisor or conduct thorough research before making investment decisions.

UTIAMC: Multi-Year Breakout: Weekly Timeframe: Week ending 04-OcUTIAMC: Multi-Year Breakout: Weekly Timeframe: Week ending 04-Oct
Stock comfortably broke the high (1216.2) it made in 06-Sep-21 and closed above in the week starting 02-Sep-24. A multi-year breakout on a weekly time frame
Over the same window company's PE ratio has decreased from 27.2 on (06-Sep-21) to 19.7 on (04-Oct-24) indicating a more attractive valuation given the company's earnings
RSI in the week of 02-Sep-24 (64.08) is above 60.
Breakout in 02-Sep-24 happened with above average trade volume (9 SMA)
Drawdown = 621.2/-
Target = Breakout level + Drawdown during consolidation phase = 1216.2 + 621.2 ~ 1830
SuperTrend = 973.73 (06-Sep-24)
Missed identifying the stock at initial breakout. However the stock retested and closed at the breakout level in the week of 30-Sep-24.
Will initiate trade if the next week is bullish and closes above the breakout level
ATR = 78.69 (30-Sep-24)
SuperTrend = 1049.96 (30-Sep-24)
RSI in the week of 30-Sep-24 (66.22) is also above 60.
Stop Loss = 1 ATR below previous swing low = 1198.6 - 78.69 ~ 1110

UTIAMC - Rounding Bottom BreakoutUTIAMC has given a long term breakout of 3 years long rounding bottom pattern. Breakout volume is also significant. If it sustain above breakout level, then we can see a good momentum in short term and can expect below level in coming months.
🔊 UTIAMC - UTI ASSET MNGMT CO LTD
⌛Duration - Short Term (6 month to 8 month)
📊📈 Trade Logic - Rounding Bottom Breakout
CMP - ₹1263.70
Time Frame - Weekly
🎯Target 1 : ₹1425
🎯Target 2 : ₹1600
🎯Target 3 : ₹1850
🛑 Stop : ₹1000
🏆 Risk/Reward Ratio (1: 2.5)
Disclaimer: The stock information shared above is not a recommendation to buy, sell, or hold. It reflects my own analysis and is intended solely for educational purposes. Any actions you take based on this information are your responsibility, and the admin of this channel is not liable for any financial gains or losses. Please consult a financial advisor before making any investment decisions. I am not a SEBI-registered advisor.

Bullish Rounding Bottom over the span of 3 years.UTIAMC is poised for a significant breakout as it trades at its highest level ever. If the weekly candle closes with strength, it could be a good opportunity to enter a swing trade with a stop-loss placed at the weekly candle's low. Additionally, in the daily timeframe, the price is consistently making higher highs and higher lows.
Disclaimer: This analysis is based on historical data and technical indicators. It does not constitute financial advice. Always consult with a financial advisor before making investment decisions

ROUNDING BOTTOM BREAKOUT IN UTI ASSET MANAGEMENT CO LTD.Rounding bottom breakout
after 3 years consolidation may
give a very higher side target.

UTIAMC - Multiyear breakout in progressUTIAMC : Long term view
Closed above long term resistance, multiyear breakout in progress
Stay Long with support at 1170

UTIAMC-DO NOT MISSLogic-Simple weekly resistance breakout, retest and continuation.
Weekly closing above 910 will be a confirmation. 1000 will be immediate resistance.
A good investment stock for long term as well available at a fair valuation with more than 2% dividend yield. I am expecting similar rally as HDFC AMC in this stock but move would be slow.
Not a recommendation, just my personal opinion!

multiple timeframe breakout UTI AMCUTI Asset Management Company Ltd is primarily engaged in the activities of raising funds for and to render investment management services to schemes of UTI Mutual Fund. It is registered with SEBI under the SEBI (Mutual Funds) Regulations, 1996. It was the first to introduce Mutual Funds in India and is focused solely on Investment management and related services.
