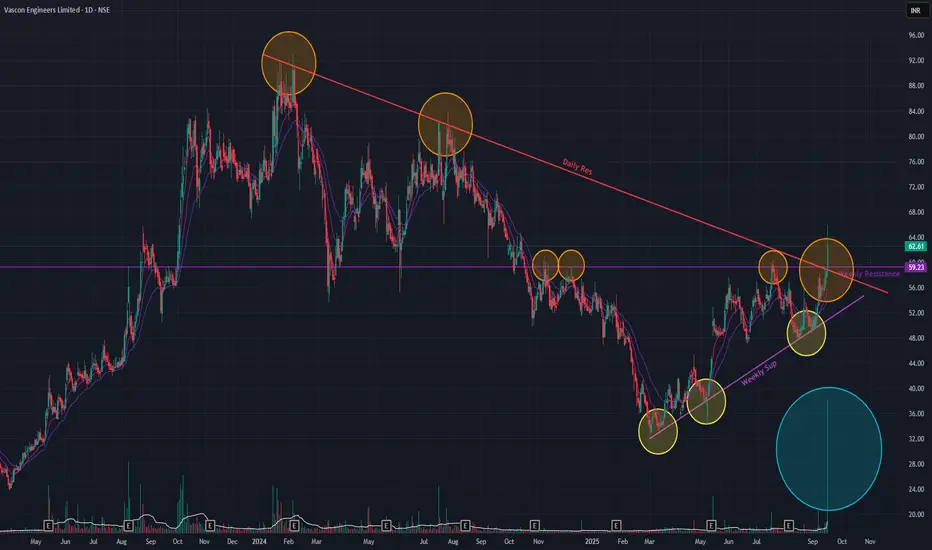
Buy, Sell, or Skip? Multi Timeframe Support ZonesUncover how support levels across multiple timeframes help clarify key buy/sell decisions—purely for technical education.
Chart used is 3 months old for educational purposes only.
6.37 INR
1.30 B INR
10.74 B INR
109.84 M
About Vascon Engineers Limited
Sector
Industry
Website
Headquarters
Pune
Founded
1986
ISIN
INE893I01013
FIGI
BBG000BXK831
IPO date
Feb 17, 2010
IPO offer price
3.56 USD
Vascon Engineers Ltd. engages in the construction and development of residential and non-residential properties. It operates through the following segments: Engineering, Procurement and Construction (EPC); Real Estate Development and Manufacturing and Building Management System. The EPC segment include construction of residential, commercial, industrial, and other construction. The Real Estate Development segment focuses in the development of residential, hotel premises, and industrial park. The Manufacturing and BMS segment manufactures clean room partition and BMS. The company was founded by R. Vasudevan on January 1, 1986 and is headquartered in Pune, India.
Related stocks

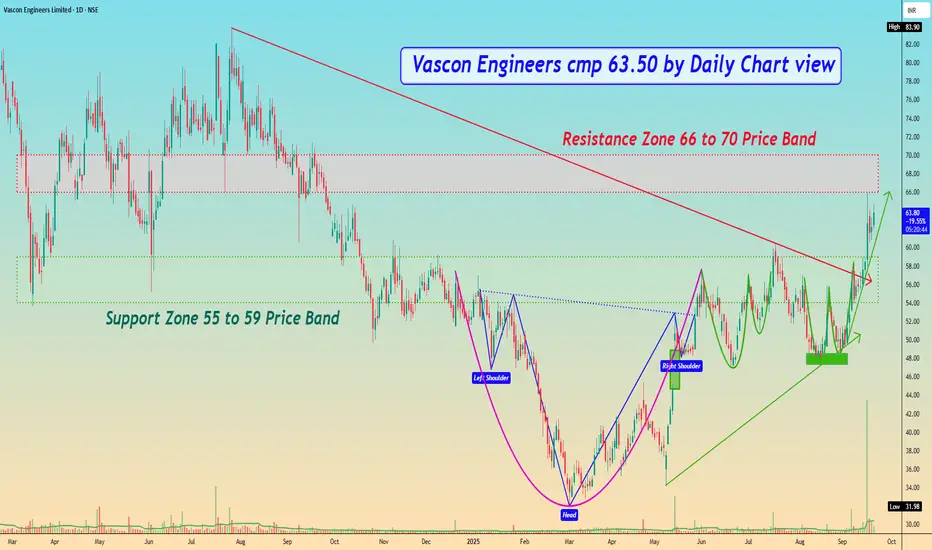
Vascon Engineers cmp 63.50 by Daily Chart viewVascon Engineers cmp 63.50 by Daily Chart view
- Support Zone 55 to 59 Price Band
- Resistance Zone 66 to 70 Price Band
- Heavy Volumes surge based breakout above Support Zone earlier Resistance Zone
- Multiple Bullish Patterns made around Support Zone with Head & Shoulders, Rounding Bottoms, Cup a
Vascon Eng (Daily Timeframe) - Is this the trend reversal ?Vascon is showing strong indications of a major trend reversal. After forming a series of higher lows since March 2025, the stock has now broken out of a clear Inverted Head & Shoulder pattern on the weekly timeframe.
The breakout is particularly significant as it occurred at a confluence of two
Vascon Engineers cmp 55.70 by Weekly Chart viewVascon Engineers cmp 55.70 by Weekly Chart view
- Support Zone 49.50 to 53.50 Price Band
- Resistance Zone 49.50 to 53.50 Price Band
- Volumes are getting close to average traded quantity
- Common Technical Indicators BB, EMA, SAR, MACD, RSI indicating positive trend
- Multiple Bullish Technical Ch

Vascon Engineers – Weekly CT BreakoutA clean Weekly CT breakout supported by strong volume (19M+), signaling strength. Key levels and structure:
🔍 Technical Breakdown:
📏 CT Line (White): Clean breakout from weekly closing-based counter-trendline
🕵️ Hidden Line (Dotted White): Secondary hidden resistance cleared
🟧 ₹45.49 Zone: Major ga

Vascon Engineers Ltd ₹ 63.6Vascon Engineers Ltd
₹ 63.6
-0.76%
27 Sep - close price
EXPORT TO EXCEL
FOLLOW
vascon.com
BSE: 533156
NSE: VASCONEQ
ABOUT
Incorporated in 1986, Vascon Engineers
Ltd is a is a Pune-based player, engaged in engineering, procurement and construction (EPC), real estate construction and development

Vascon EnginneringLooking good for long term target of 200 , nice retracement and breakout with w patter
Volume and candlestick supporting breakout

Vascon Engg long Term Chart Vascon Engg long Term Chart
Fibonacci levels
Expecting Tar
Rest market is Supreme


See all ideas
Summarizing what the indicators are suggesting.
Oscillators
Neutral
SellBuy
Strong sellStrong buy
Strong sellSellNeutralBuyStrong buy
Oscillators
Neutral
SellBuy
Strong sellStrong buy
Strong sellSellNeutralBuyStrong buy
Summary
Neutral
SellBuy
Strong sellStrong buy
Strong sellSellNeutralBuyStrong buy
Summary
Neutral
SellBuy
Strong sellStrong buy
Strong sellSellNeutralBuyStrong buy
Summary
Neutral
SellBuy
Strong sellStrong buy
Strong sellSellNeutralBuyStrong buy
Moving Averages
Neutral
SellBuy
Strong sellStrong buy
Strong sellSellNeutralBuyStrong buy
Moving Averages
Neutral
SellBuy
Strong sellStrong buy
Strong sellSellNeutralBuyStrong buy
Displays a symbol's price movements over previous years to identify recurring trends.
Frequently Asked Questions
The current price of VASCONEQ is 53.21 INR — it has decreased by −4.80% in the past 24 hours. Watch Vascon Engineers Limited stock price performance more closely on the chart.
Depending on the exchange, the stock ticker may vary. For instance, on BSE exchange Vascon Engineers Limited stocks are traded under the ticker VASCONEQ.
VASCONEQ stock has fallen by −11.68% compared to the previous week, the month change is a −21.38% fall, over the last year Vascon Engineers Limited has showed a −1.65% decrease.
VASCONEQ reached its all-time high on Aug 23, 2010 with the price of 195.85 INR, and its all-time low was 6.02 INR and was reached on Mar 30, 2020. View more price dynamics on VASCONEQ chart.
See other stocks reaching their highest and lowest prices.
See other stocks reaching their highest and lowest prices.
VASCONEQ stock is 5.61% volatile and has beta coefficient of 2.31. Track Vascon Engineers Limited stock price on the chart and check out the list of the most volatile stocks — is Vascon Engineers Limited there?
Today Vascon Engineers Limited has the market capitalization of 11.71 B, it has decreased by −6.50% over the last week.
Yes, you can track Vascon Engineers Limited financials in yearly and quarterly reports right on TradingView.
VASCONEQ net income for the last quarter is 114.30 M INR, while the quarter before that showed 224.70 M INR of net income which accounts for −49.13% change. Track more Vascon Engineers Limited financial stats to get the full picture.
Vascon Engineers Limited dividend yield was 0.00% in 2024, and payout ratio reached 0.00%. The year before the numbers were 0.41% and 8.19% correspondingly. See high-dividend stocks and find more opportunities for your portfolio.
As of Nov 20, 2025, the company has 772 employees. See our rating of the largest employees — is Vascon Engineers Limited on this list?
EBITDA measures a company's operating performance, its growth signifies an improvement in the efficiency of a company. Vascon Engineers Limited EBITDA is 864.80 M INR, and current EBITDA margin is 7.36%. See more stats in Vascon Engineers Limited financial statements.
Like other stocks, VASCONEQ shares are traded on stock exchanges, e.g. Nasdaq, Nyse, Euronext, and the easiest way to buy them is through an online stock broker. To do this, you need to open an account and follow a broker's procedures, then start trading. You can trade Vascon Engineers Limited stock right from TradingView charts — choose your broker and connect to your account.
Investing in stocks requires a comprehensive research: you should carefully study all the available data, e.g. company's financials, related news, and its technical analysis. So Vascon Engineers Limited technincal analysis shows the sell today, and its 1 week rating is sell. Since market conditions are prone to changes, it's worth looking a bit further into the future — according to the 1 month rating Vascon Engineers Limited stock shows the neutral signal. See more of Vascon Engineers Limited technicals for a more comprehensive analysis.
If you're still not sure, try looking for inspiration in our curated watchlists.
If you're still not sure, try looking for inspiration in our curated watchlists.