Venkys: Double Bottom Breakout Potential with Rising Institution"Venkys: Double Bottom Breakout Potential with Rising Institutional Confidence"
Stock: Venkys India Ltd.
Analysis:
Venkys appears to be reversing its downtrend and is on the verge of a double bottom breakout, signaling a potential uptrend in the near term. Despite recent weak financial results lea
Venky's (India) Limited
No trades
Next report date
—
Report period
—
EPS estimate
—
Revenue estimate
—
16.30 INR
1.17 B INR
33.07 B INR
4.58 M
About Venky's (India) Limited
Sector
Industry
CEO
Balaji Rao Banda
Website
Headquarters
Pune
Founded
1976
Identifiers
2
ISININE398A01010
Venky's India Ltd. engages in the production and sale of poultry products. It operates through the following segments: Poultry & Poultry Products, Animal Health Products, and Oilseed. The Poultry & Poultry Products segment produces and sells chicks, grownup commercial broiler and layer, processed chicken, specific pathogen free eggs, poultry feed and other miscellaneous poultry products. The Animal Health Products segment offers medicines and other health products for birds. The Oilseed segment provides edible refined soya oil and soya de-oiled cake. The company was founded in 1976 and is headquartered in Pune, India.
Related stocks
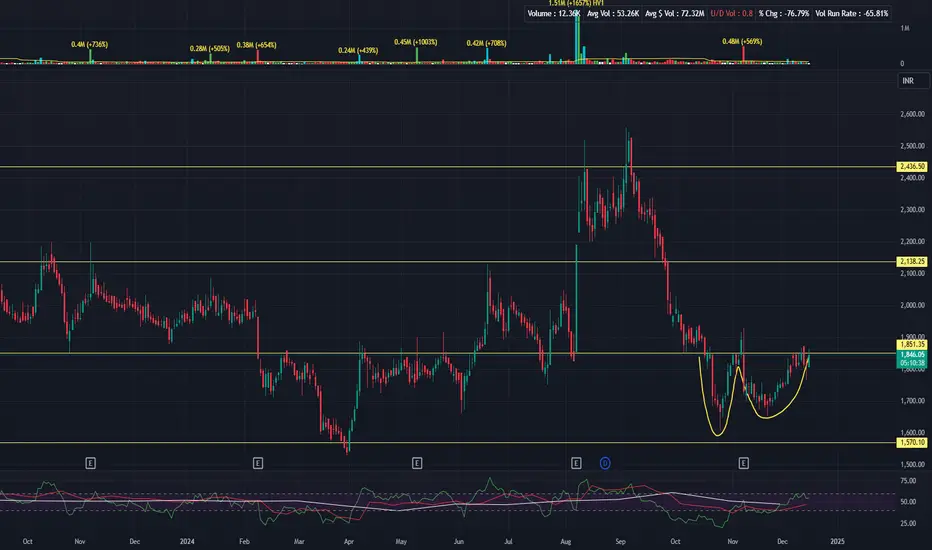
VENKEYS Trading Within Demand Zone of ₹1851.30-₹1752VENKEYS stock is currently trading at ₹1841.90, positioned within the demand zone of ₹1851.30-₹1752. This zone has been tested before, indicating strong historical buyer interest. Investors may watch for potential bullish activity as the stock consolidates within this key range.

VENKYS - Rounding bottom with fresh volumesRounding bottom with fresh volumes.
Targets(T1, T2, T3 & T4) mentioned along with expected time frames. Stop loss marked as SL. Can achieve better targets, should carry trailing stop loss once in good gains.
Also keep tracking quarterly results to monitor performance.

VENKEYS Triangle BreakoutVenkeys has given a breakout from triangle pattern on 1D timeframe with strong volumes. It has broken its 2 year old resistance. It is apparently retesting its resistance.

VENKEYS LONG IDEAVenkeys is looking good on chart.It is yet to break long term trendline resistance.
Once breaks trendline it can start marching towards channel upper line.
Need to plan trade asd per risk management using given Stop loss levels.
Note: No idea about fundamentals of comapny. It's completely Tech

VENKEYS : Leadership BlueprintsLeadership Blueprints :
1. HV1
2. Earnings
3. Weekly pivot break
4. W-rsi > 60
5. Launchpad (bunched moving averages)
6. Stage 2 uptrend

Venkeys - Monthly Chart - Ascending Channel - LongVENKEYS is moving in a clear Ascending Channel with support at the bottom of the channel retested multiple times as shown in the chart.
The Price has again bounced after touching the bottom of the channel
Key Points:
Ascending Channel: The stock has been trading within a well-defined ascendin

Venkys stockI have added my opinion on venkys stock which is going to expect good move from here
Only education purpose only


See all ideas
Summarizing what the indicators are suggesting.
Oscillators
Neutral
SellBuy
Strong sellStrong buy
Strong sellSellNeutralBuyStrong buy
Oscillators
Neutral
SellBuy
Strong sellStrong buy
Strong sellSellNeutralBuyStrong buy
Summary
Neutral
SellBuy
Strong sellStrong buy
Strong sellSellNeutralBuyStrong buy
Summary
Neutral
SellBuy
Strong sellStrong buy
Strong sellSellNeutralBuyStrong buy
Summary
Neutral
SellBuy
Strong sellStrong buy
Strong sellSellNeutralBuyStrong buy
Moving Averages
Neutral
SellBuy
Strong sellStrong buy
Strong sellSellNeutralBuyStrong buy
Moving Averages
Neutral
SellBuy
Strong sellStrong buy
Strong sellSellNeutralBuyStrong buy
Displays a symbol's price movements over previous years to identify recurring trends.
Frequently Asked Questions
The current price of VENKEYS is 1,450.90 INR — it has increased by 1.27% in the past 24 hours. Watch Venky's (India) Limited stock price performance more closely on the chart.
Depending on the exchange, the stock ticker may vary. For instance, on BSE exchange Venky's (India) Limited stocks are traded under the ticker VENKEYS.
VENKEYS stock has risen by 2.14% compared to the previous week, the month change is a 7.87% rise, over the last year Venky's (India) Limited has showed a −17.98% decrease.
VENKEYS reached its all-time high on Apr 9, 2018 with the price of 4,711.25 INR, and its all-time low was 34.00 INR and was reached on May 17, 2004. View more price dynamics on VENKEYS chart.
See other stocks reaching their highest and lowest prices.
See other stocks reaching their highest and lowest prices.
VENKEYS stock is 1.40% volatile and has beta coefficient of 0.78. Track Venky's (India) Limited stock price on the chart and check out the list of the most volatile stocks — is Venky's (India) Limited there?
Today Venky's (India) Limited has the market capitalization of 20.18 B, it has decreased by −0.78% over the last week.
Yes, you can track Venky's (India) Limited financials in yearly and quarterly reports right on TradingView.
Venky's (India) Limited is going to release the next earnings report on Feb 6, 2026. Keep track of upcoming events with our Earnings Calendar.
VENKEYS net income for the last quarter is −265.30 M INR, while the quarter before that showed 158.30 M INR of net income which accounts for −267.59% change. Track more Venky's (India) Limited financial stats to get the full picture.
Yes, VENKEYS dividends are paid annually. The last dividend per share was 10.00 INR. As of today, Dividend Yield (TTM)% is 0.70%. Tracking Venky's (India) Limited dividends might help you take more informed decisions.
Venky's (India) Limited dividend yield was 0.62% in 2024, and payout ratio reached 12.08%. The year before the numbers were 0.45% and 12.47% correspondingly. See high-dividend stocks and find more opportunities for your portfolio.
As of Dec 24, 2025, the company has 5.62 K employees. See our rating of the largest employees — is Venky's (India) Limited on this list?
EBITDA measures a company's operating performance, its growth signifies an improvement in the efficiency of a company. Venky's (India) Limited EBITDA is 469.00 M INR, and current EBITDA margin is 5.37%. See more stats in Venky's (India) Limited financial statements.
Like other stocks, VENKEYS shares are traded on stock exchanges, e.g. Nasdaq, Nyse, Euronext, and the easiest way to buy them is through an online stock broker. To do this, you need to open an account and follow a broker's procedures, then start trading. You can trade Venky's (India) Limited stock right from TradingView charts — choose your broker and connect to your account.
Investing in stocks requires a comprehensive research: you should carefully study all the available data, e.g. company's financials, related news, and its technical analysis. So Venky's (India) Limited technincal analysis shows the buy rating today, and its 1 week rating is neutral. Since market conditions are prone to changes, it's worth looking a bit further into the future — according to the 1 month rating Venky's (India) Limited stock shows the sell signal. See more of Venky's (India) Limited technicals for a more comprehensive analysis.
If you're still not sure, try looking for inspiration in our curated watchlists.
If you're still not sure, try looking for inspiration in our curated watchlists.