VIPIND 1 Day Time Frame 📌 Current Price Action (Latest):
• Last traded around ₹379–₹380 in recent sessions. Daily price range seen near ₹374–₹384.
📊 Daily Pivot & Key Levels (Current)
Based on pivot-point calculations from live technical data:
📍 Pivot Zones (Daily):
• Central Pivot (Standard): ~₹403.27
📈 Resistance Levels:
• R1: ~₹420.13
• R2: ~₹430.37
(above current price – upside targets)
📉 Support Levels:
• S1: ~₹393.03
• S2: ~₹376.17
• S3: ~₹365.93
• S4: ~₹349.07
📌 Support/Resistance Summary (Daily):
Near-term resistance: ~393–420
Immediate support: ~376–365
Deeper support: ~350 and below
📌 Short-Term Intraday/1-Day Reaction Levels
Based on recent technical analysis:
Upside Resistance:
~₹386–₹393 (near current trading highs)
~₹400+ (psychological/local resistance)
Downside Support:
₹376–₹374 (short-term support)
₹371–₹369 (secondary support
₹365 / lower (deeper level)
📈 How to Use These Levels Today
Bullish scenario:
✔ If price holds above ₹376–₹380 range and breaks ₹393+, upside toward ₹400–₹420 becomes probable.
Bearish scenario:
✘ If price breaks below ₹374–₹370, the next support targets are ₹365 and then ₹350.
Neutral / Range:
📍 Between ₹374–₹393, expect sideways or consolidation movement in the 1-day chart.
V.I.P.INDUSTRIES LTD.
No trades
What traders are saying

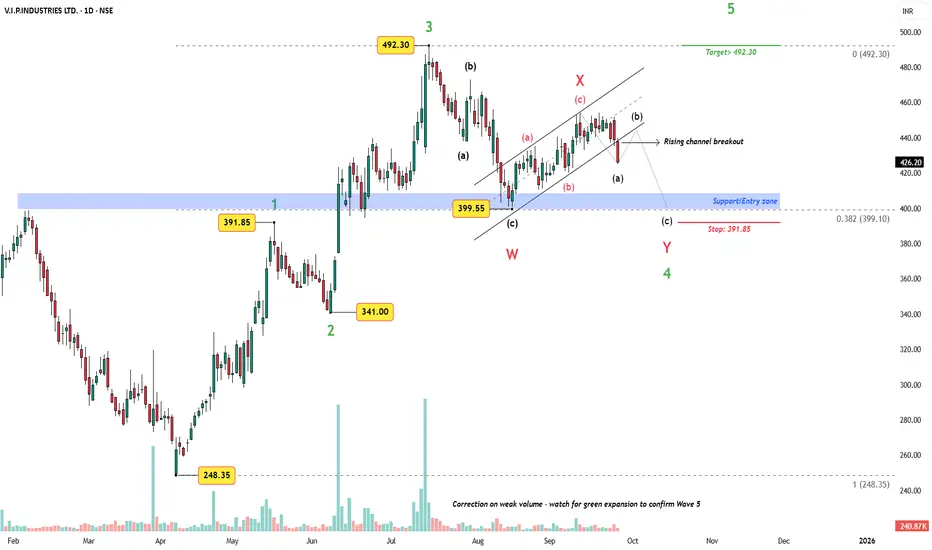
VIP Industries – Rising Channel Breakdown, Support Zone in FocusChart Structure
The stock completed a wave 3 advance up to 492.30. What followed is a corrective W–X–Y structure, which probably might test the previous breakout zone around 408–400. This aligns with the 0.382 Fibonacci retracement and previous Wave 1 high, providing strong support.
Key Observations
The corrective leg has unfolded on weak volume, typical of a Wave 4 structure.
Recent breakdown from the rising channel suggests a final (c) leg of Wave Y into the blue support zone.
A possible wave (b) retest of the broken channel cannot be ruled out before the final dip.
As per Elliott Wave rules, Wave 4 must not overlap Wave 2 (391.85) – keeping structural integrity intact.
Trade Plan
Entry Zone: Strictly in the 408–400 support band.
Stop-Loss: 391.85 (under prior Wave 1 high, violation would invalidate the count).
Target: A new high above Wave 3, i.e., ≥492.30, as Wave 5 should extend beyond Wave 3.
Volume Insight
Correction is unfolding on weak volume – confirmation of Wave 5 will require a green volume expansion from the support zone.
Conclusion
As long as 391.85 holds, the Wave 4 correction is near its end. A rally into Wave 5 with targets above 492 remains the primary scenario. However, patience is key – entry only in the marked support band.
Disclaimer: This analysis is for educational purposes only and does not constitute investment advice. Please do your own research (DYOR) before making any trading decisions.
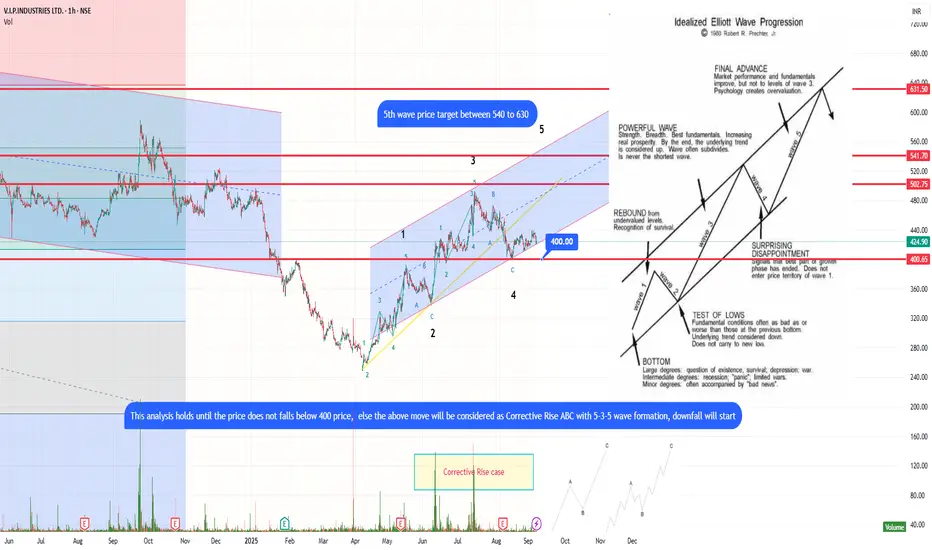
VIPIND UPMOVE Classic Elliott wave VIPIND UPMOVE Classic Elliott wave
Idealised Elliott wave in progression Wave 4 completed, 5th wave projected target between 540 to 630 price.
This analysis holds valid till price does not fall below price 400, else the move will be considered as corrective rise ABC with 5-3-5 wave formation, further correction will come prices will fall.
Let's wait and watch.
Trade with due deligence.
VIPIND Price ActionVIP Industries is trading around ₹420 at the end of August 2025, showing relative stability despite recent operational headwinds. The company reported a decline in both revenue and profitability for the June quarter, with net sales falling to approximately ₹561 crore and a posted net loss of about ₹13 crore. This downturn was influenced by weaker demand, one-off costs, and significant de-growth in certain sales channels, though management indicated structural efforts and cost controls limited the impact on margins.
The stock’s price-to-book ratio remains elevated at over 9, and the company is not currently paying dividends, focusing resources on supporting its brand and operations. Despite these challenges, VIP Industries continues to maintain a strong brand presence and an extensive market reach in the luggage segment. Its market capitalization stands near ₹6,000 crore, and the stock is trading at about 9.2 times book value, reflecting modest investor optimism about a potential business recovery.
Technically, the share price is consolidating well above the yearly low but remains below the 52-week high, with trading volumes indicating ongoing investor interest. Near-term performance will depend on management’s success in reviving e-commerce channels, sustaining cost discipline, and capitalizing on a potential pickup in travel-related demand. The company’s medium-term outlook remains cautious but could improve if growth resumes and operating performance stabilizes.
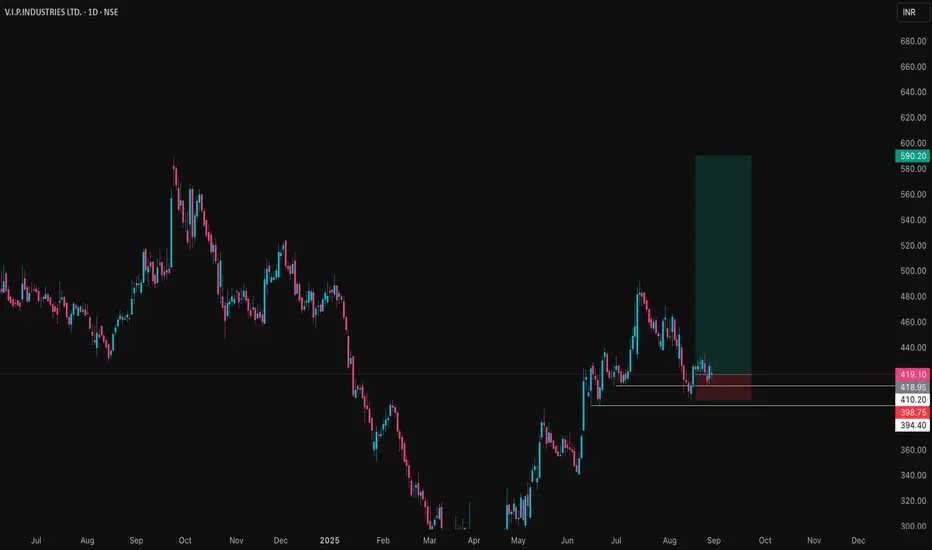
VIPIND: Unlocking Potential After Downtrend
VIP Industries has demonstrated robust bullish momentum over the past few trading sessions, signaling a notable shift in market sentiment. This upward trajectory is particularly significant given the stock's prolonged downtrend since October 2024.
From an Elliott Wave perspective, the recent price action suggests the potential completion of a corrective phase. The retracement from what appears to be Wave 1 to Wave 2 aligns closely with the 61.8% Fibonacci retracement level, which often precedes the initiation of a strong Wave 3 impulse. This potential wave structure, if confirmed, could indicate further upside potential.
A key development supporting this bullish outlook is the stock's recent decisive close above its 200-day EMA, accompanied by a significant surge in trading volume. This confluence of price action and volume confirms strong buying interest and suggests a potential long-term trend reversal. The increased volume further validates the strength of the breakout, indicating broader market participation.
While the immediate outlook appears constructive, traders should be mindful of potential profit-taking around the ₹446 level. This area may present a temporary resistance zone where some short-term corrections or consolidation could occur. However, should the stock successfully navigate this level, the next significant upside resistance target to monitor is ₹492 . This level aligns with prior price highs and could represent a more substantial challenge for further upward movement.
For risk management purposes, a prudent approach would involve considering a stop-loss order positioned below the identified support zone, as depicted on the chart. This strategy aims to mitigate potential downside risk in the event of an unexpected reversal in market sentiment.
Disclaimer: The information provided in this technical analysis is for informational and educational purposes only and should not be construed as financial advice. It is based on observations from the provided chart and commonly used technical indicators. Market conditions can change rapidly, and past performance is not indicative of future results. Always conduct your own comprehensive due diligence and consult with a qualified financial advisor before making any investment decisions.
Exhaustion vs Runaway Gap |How to Catch Trend and Spot ReversalsGaps often confuse traders — some lead to powerful trends, others signal trend exhaustion. In this video, I break down the key psychological and technical differences between Runaway Gaps and Exhaustion Gaps, with real examples and clean explanations.

VIP Industries bouncebackVIP Industries bounceback has to surpass the trendline to prove itself. It has shown a good rebounce from low, but this will be a crucial resistance to break and continue the rally

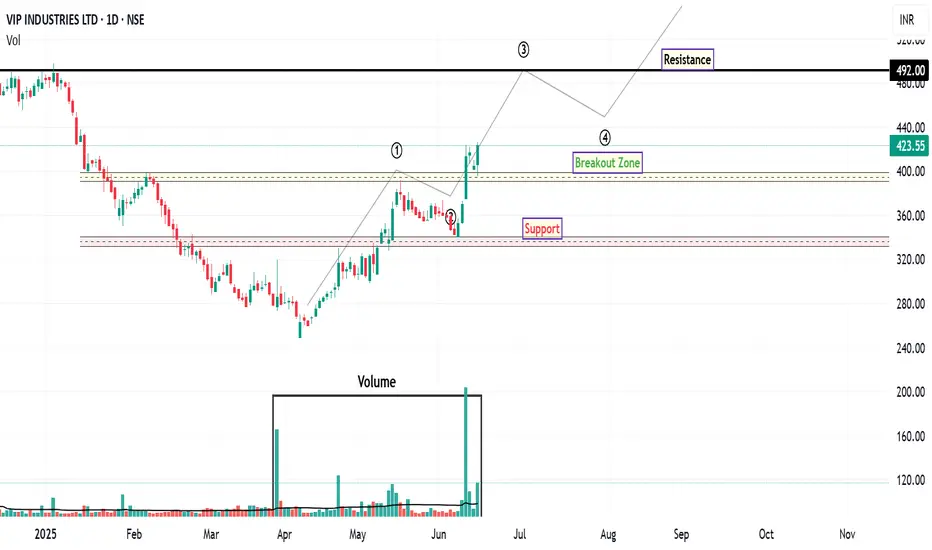
V I P Industries LtdVIPIND - The stock recently bounced from the lower boundary of its channel and is now approaching the upper boundary. Notably, a significant increase in volume has been observed during upward moves, which suggests strong buying interest. The last candlestick formed a strong bullish candle, breaking out from a short-term flag consolidation pattern.
If the price breaks above the 440 level, the stock could continue its rally towards 480 and potentially 500.

VIP Ind Short Term TradeA head and shoulders pattern is visible on the charts
The breakout is supported with high volume, and after the breakout resistance has turned into support
Thus, for a short term trade,
tgt 450 , sl 393
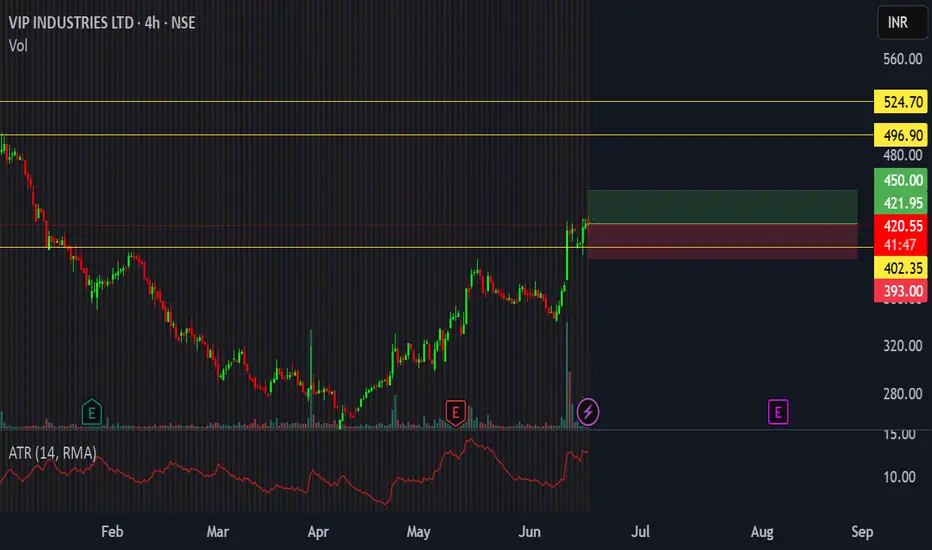
Bullish Breakout in VIP Industries 🔍 Chart Overview:
Breakout above resistance zone at ₹420
Strong volume spike confirming buying interest
Price action broke out of a consolidation channel
Formed a bullish flag/pennant pattern before breakout
🔧 Technical Indicators:
RSI moving above 60 → bullish momentum building
MACD crossover near zero line → fresh upward signal
50 EMA support intact, stock trading above all major EMAs

VIP Ind Breakout in DTF !!VIP ind has given breakout in its DTF !! with volumes
CMP: 501
Dip :480
Tgt: 525,550,590,610+
SL: 420 below WCB
Chart only for Educational Purpose.

VIP Industries Breakout from Downward Trendline + Retest DoneVIP Industries has decisively broken out from a long-term downward trendline and is now consolidating around 563, showing strong momentum. The stock is reclaiming higher levels with increasing volume, indicating buying interest. RSI is at 63, suggesting bullish momentum but still has room for further upside. A clear move above 600 will confirm continuation of the uptrend. Traders should watch for this level for further bullishness.

VIP Industries Buy ideastock has formed a falling wedge on monthly chart. Taken support on 40 RSI support and showing upside movement. MACD is also trying to make crossover on monthly chart. Can buy for a target of 770. can touch this level in 1-2 year.

VIP IND LTD VIP IND LTD
CMP: 563
TARGET 1: 753
TARGET 2: 963
SL : 471
VIEW FOR 8 month to 1 year
partnered with Unicommerce to streamline

VIP - Falling Channel Breakout viewVIP :
Falling Channel breakout in progress
Looks good only above 573 with support at 545

Scanner scans - VIP Ind 10% in a dayWow ! 10% in a day of showing up on the scanner. I wish I had more money to deploy.
Did anyone benefit from it? Please comment.
Please refer previous day's video for showing up on scanner.

VIPIND for 20% gain in 8-10 Month. Quarterly result of VIPIND expected to come better than last quarter. Skybag is everywhere is the school now. there is 20% potential gain within a year time Frame.

VIP Industries cmp 534.00 by Weekly Chart viewsVIP Industries cmp 534.00 by Weekly Chart views
- Strong Resistance Zone at 538 to 552 Price Band
- Volumes gradually building up over the past few weeks
- Weekly basis Support at 495 > 448 > 401 with Resistance 552 > 590 > 639
- *Back to back Rounding Bottoms in the completion stages at Resistance Zone Neckline*

VIP INDUSTRIES : A good bet for short term📈 VIP INDUSTRIES is a good buying candidate for a short term swing trading.
🔰 It can show some decent upside move upto 15% to 30% in the near future.
🟢 Range : 515 - 525
🎯 Target : 560 / 600 / 655 / 700
🛑 Stop : 490 ( wcb )
⚠️ Disclaimer : It's not a buy/sell recommendation. It's a view only for an educational purposes.

VIPINDVIPIND has given resistance breakout with decent volume. Market participation in recent days also increased. Crossed 200MA today. Keep it on radar.

VIP Industries 38% gainVIP industries chart in formation stage.
Potential gain of 38% gain from current level of Rs 514

VIPIND : Possible upside VIP Industries : - Crossing and closing above long-term trend line on a daily basis.
Currently trading above Weekly and Monthly Pivots.
The current close is above 4 weeks High.
Daily RSI > Weekly RSI > Monthly RSI
Close is above 20 Day SMA on Daily and Weekly time frames.
The next expected target is 572 & if the market sustains above 25000, we should see a good upside above 580 levels.

VIPIND (VIP Industries)
Based on VIP industries chart a hammer candle formed at a support level. A hammer candle is typically considered a bullish reversal pattern, especially when it forms at the bottom of a downtrend, indicating potential buying interest and a possible reversal.
Breakout of Hammer Candle price has broken out above the hammer candle's high, which is another bullish sign. A breakout above the high of a hammer indicates a potential trend reversal from bearish to bullish.
price is also breaking above a downtrend line, which is another bullish indicator. This breakout suggests a potential end to the existing downtrend n the beginning of a new uptrend.
Higher than average volume would provide more confidence in the sustainability of the uptrend.
Buy at the current level of 515 the technical indicators suggest a potential buying opportunity. The breakout above the hammer candle with the trendline breach signifies that the stock might see further upside momentum. A potential target could be around the next resistance zone at approx 700 levels , which shows a potential ~ 4 0% upside.
Stop Loss for a safer trade, you can consider a stop loss below the recent support level or below the low of the hammer candle to minimize risk in case the trend does not sustain.
Kindly Note: Always consider other factors like market conditions, news, and company fundamentals before making a final decision it's just for study purpose
Thanks
X @vijaigautam
