VMM ( Vishalmega mart) near ATHVMM (Vishal Mega Mart) is in strong uptrends above 60. Above 50 EMA and near all time high
Once break AHT and sustain than there chance of more upside
VMM trade ideas

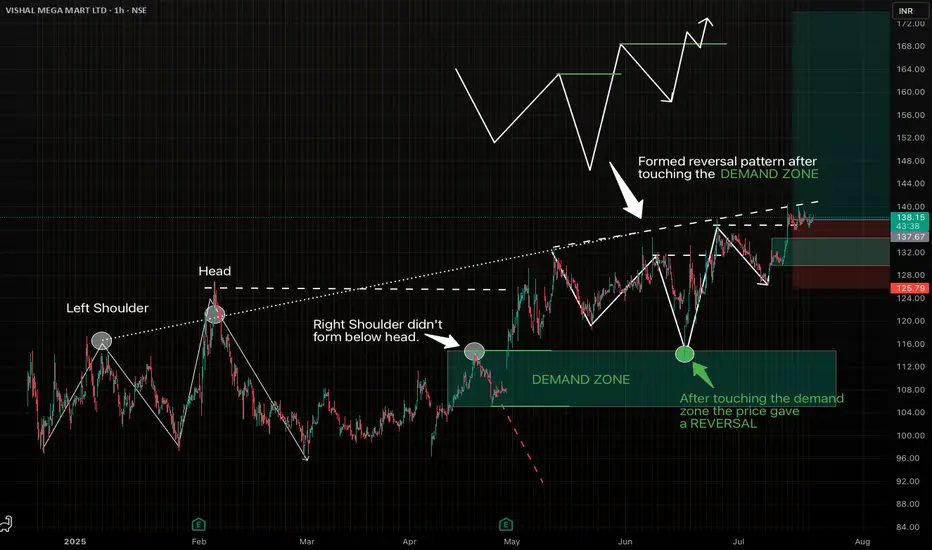
Strong reversal pattern on VMM. Looks good for swing trade.Spotted a beautiful setup on VISHAL MEGA MART LTD (1H Chart), following my favourite "Elevated Right Shoulder" pattern.
- The Left Shoulder and Head formed clearly.
- The Right Shoulder didn't go below the head, indicating ultra bullish structure and formed a demand zone.
- Price touched the Demand Zone and gave a perfect reversal.
-Clean entry with favourable risk-reward.
Let's see how it plays out.
Vishal Mega Mart LtdVishal mega mart ltd in a up-trend, buy for the target of 160 & above. Stock will see good upside in coming months

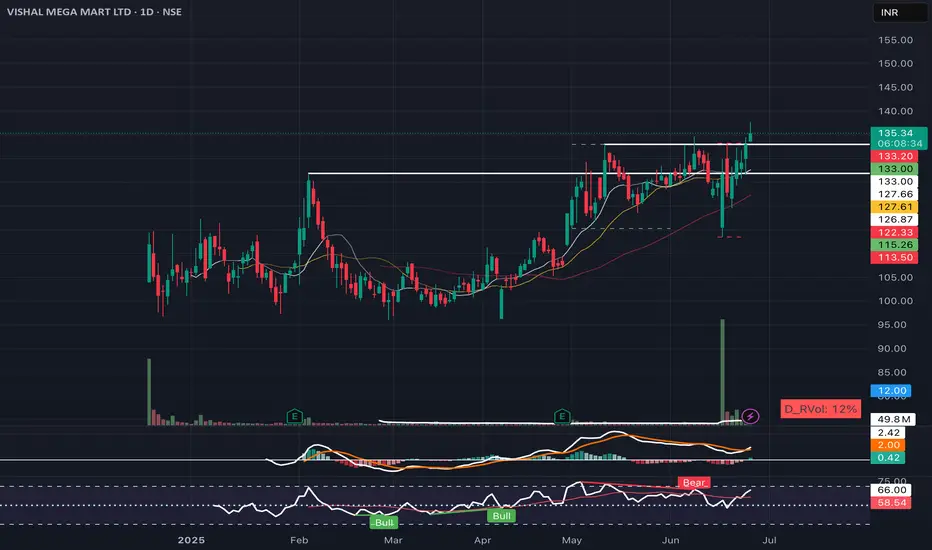
VISHAL MEGA MART – Breakout Above Resistance📈 VISHAL MEGA MART – Breakout Above Resistance
Date: June 25, 2025 | Exchange: NSE | Timeframe: Daily
Vishal Mega Mart has broken out above a key resistance at 133–134 with strong follow-through. Price is now sustaining above the prior range high, confirming a bullish structure.
Key Levels:
* Support: 133 / 127.5
* Indicators: MACD in bullish territory, RSI near breakout zone (67)
View: Bullish bias intact. Sustained move above 134 could lead to momentum continuation toward 145+ levels in the short term.
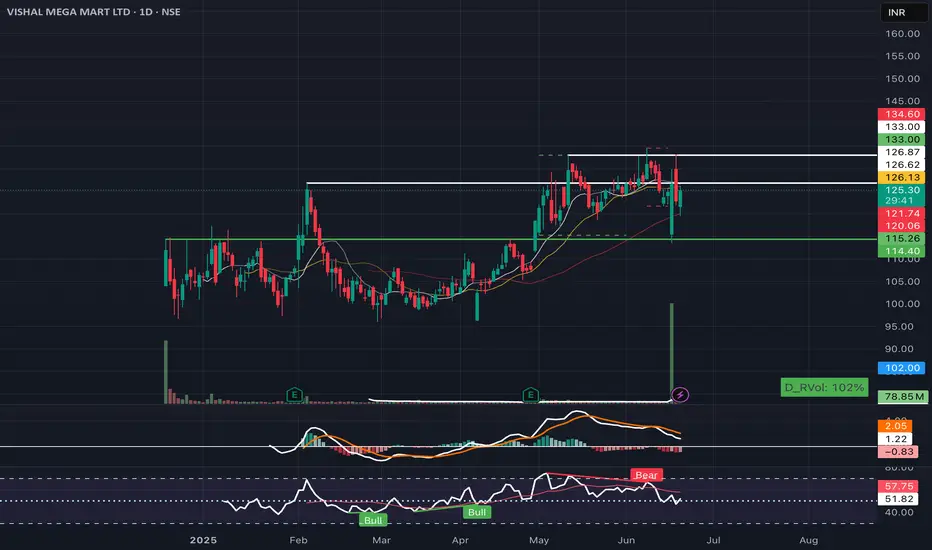
VISHAL MEGA MART – Demand Zone Bounce with Volume Surge📈 VISHAL MEGA MART – Demand Zone Bounce with Volume Surge
Date: June 19, 2025 | Exchange: NSE | Timeframe: Daily
Vishal Mega Mart rebounded sharply from the key demand zone near 114–115 with strong volumes, indicating institutional buyer interest at lower levels. Price is now reclaiming the previous consolidation zone.
Key Levels:
* Resistance: 126.6 / 133
* Support: 121.7 / 115
* Indicators: MACD near crossover, RSI rebounding from midline
View: Bullish bias as long as price holds above 121. A move above 127–128 may open path toward 140+ in the short term.
BUY TODAY SELL TOMORROW for 5%DON’T HAVE TIME TO MANAGE YOUR TRADES?
- Take BTST trades at 3:25 pm every day
- Try to exit by taking 4-7% profit of each trade
- SL can also be maintained as closing below the low of the breakout candle
Now, why do I prefer BTST over swing trades? The primary reason is that I have observed that 90% of the stocks give most of the movement in just 1-2 days and the rest of the time they either consolidate or fall
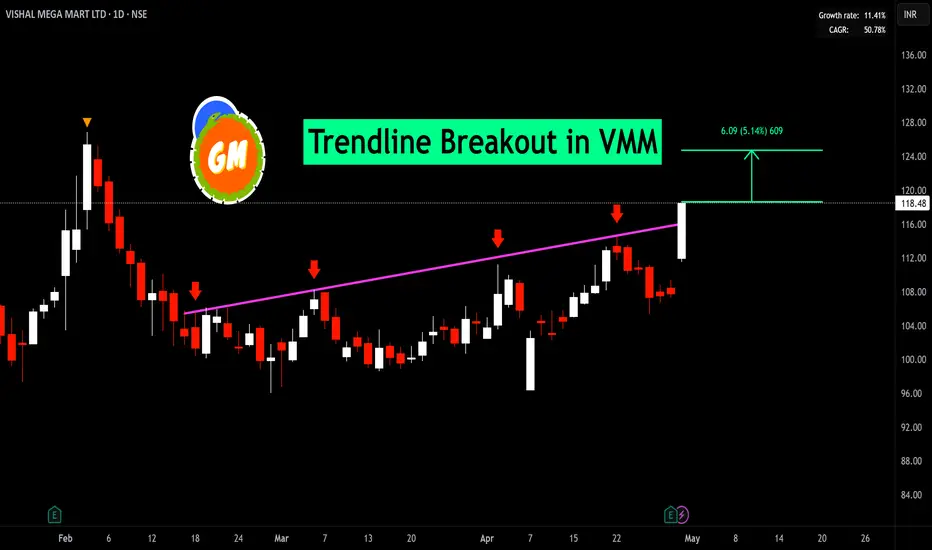
Trendline Breakout in VMM
BUY TODAY SELL TOMORROW for 5%
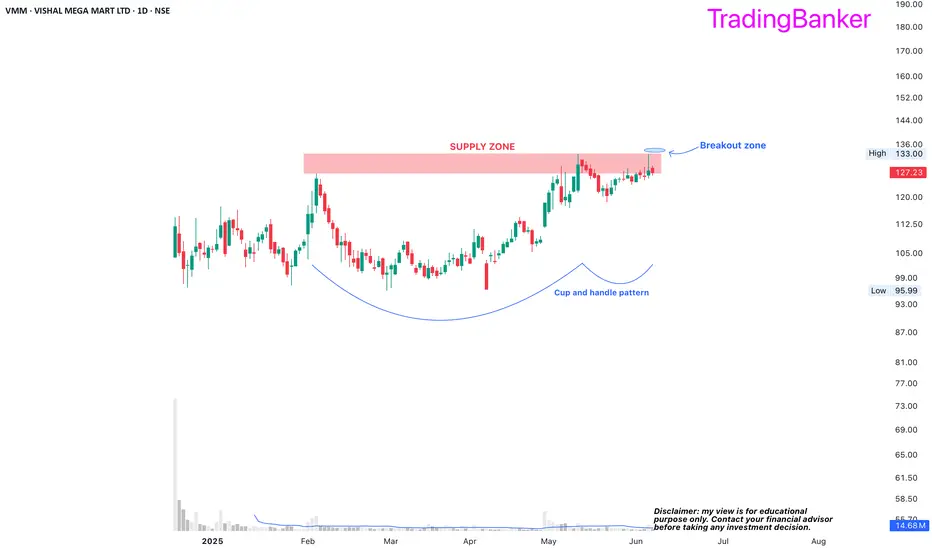
VMM: cup and handle breakout6. VMM
-cup and handle breakout in the offing
-volatility has been low and the price is showing contraction near the supply zone
-breakout is above 135 once sustained
Vishal Mega Mart Ltd (VMM) Cup and Handle BO with good volumeThe chart you've provided is a **cup and handle breakout pattern** for *Vishal Mega Mart Ltd (VMM)*, which is a classic bullish continuation pattern in technical analysis.
### Key Observations:
1. **Cup and Handle Formation**:
- The "cup" part of the pattern formed over February to mid-April.
- The "handle" formed shortly after and broke out with a strong bullish candle on April 30.
2. **Breakout Details**:
- Breakout above the resistance zone of **₹113.50–₹117.41**.
- The stock closed at **₹118.48**, up **10%** on high volume—indicating strong buying interest.
3. **Price Target Projection**:
- Depth of the cup is approximately **₹17.56**.
- Projected target from breakout point (₹117.41) is around **₹127.50**, which is also marked on the chart.
4. **Volume Confirmation**:
- Significant volume spike on the breakout day supports the validity of the breakout.
### Summary:
This breakout is a bullish signal, and the target is around **₹127.50**, as long as the price sustains above the **₹113.50** support zone. A retracement to retest this breakout zone is possible, but the pattern remains valid unless it breaks below this support.

VMM Breakout and Retest Possible Entry For Long confirmation, wait for :
1. Reversal candle
2. Volume uptick
3. SL would be 103
Classic Breakout And retest

BUY TODAY SELL TOMORROW for 5%DON’T HAVE TIME TO MANAGE YOUR TRADES?
- Take BTST trades at 3:25 pm every day
- Try to exit by taking 4-7% profit of each trade
- SL can also be maintained as closing below the low of the breakout candle
Now, why do I prefer BTST over swing trades? The primary reason is that I have observed that 90% of the stocks give most of the movement in just 1-2 days and the rest of the time they either consolidate or fall
Trendline Breakout in VMM
BUY TODAY SELL TOMORROW for 5%

Vishal Megamart. All Set for IPO base Breakout?
Vishal Megamart
Entry Zone:The stock has broken above the resistance level of ₹115.00, marking the entry point as it closes higher on a bullish day. This indicates strong momentum.
Stop Loss (SL):A standard stop-loss level is set at ₹107.68 (purple line). This ensures protection in case of price reversal.
There is an additional closing basis SL at ₹99.67. This is a deeper stop-loss for more conservative traders, offering room for price fluctuation.
Volume Analysis:The breakout is accompanied by higher-than-average volume, which validates the bullish move. Increasing volume often signals genuine buying interest.
Trend:The recent candles show a steady uptrend with higher highs and higher lows, supporting a bullish continuation.
Potential Upside:The breakout above resistance opens the possibility of further upside if the stock sustains this level. Watch for potential resistance at higher levels, possibly around ₹120–₹125 (psychological and technical zones).
Trading Plan:
Entry: As suggested, ₹114.00 or near the closing price.
Stop Loss: ₹107.68 (traders) or ₹99.67 (investors).
Target: A logical next resistance level can be identified for booking partial profits or trailing SL to lock gains.
Risks:
False Breakout: Ensure the stock sustains above ₹115.00 for confirmation.
Market Conditions: Broader market sentiment can impact this trade, so stay cautious of volatility.
