VOLTASStock has been trading in a range and tried to break the resistance many times. Buy above 1315, TGT 1480+, SL 1265. For educational purpose only. Kindly contact your financial advisor before entering any trade.
VOLTAS trade ideas


cup and handle in day candle voltasthis is summer time. everyone feeling hot now, people mostly buying on fridge, AC....voltas is mainly known for AC product in india....i focused on last year , now its time to break channel, form new resistance and also today its form perfectly cup and handle shape.

VOLTASVoltas, this stock has been consolidated in a parallel channel since October 2021, and now very first time it has closed just out of that same channel's top on daily time frame,
Also it has been closed above 20DMA from last 15 days and sustaining on same.
As per elliot wave structure we can assume that from the low of 8th March fresh impulse wave 1 started and on the 17th March wave 2 was started and completed on 28th March, So now possibly wave 3 is in unfolding phase.
RK's Magic indicator is also showing cloud impulse buy on daily chart, along with macd turned positive crossover on weekly chart.
Overall it looks good candidate to go long, at current levels or in dips ( if any ).
on the way up side 1457 is the level where wave 1 and wave 3 would be equal, and on the way down RK's stoploss line which is pegged at 1244, can be a good support level to watch out for in forth coming days.
Wave structure on daily also all key levels are mentioned on chart
macd positive crossover on weekly
macd positive on daily
rsi breakout and uptick on daily
Most investors treat trading as a hobby because they have a full-time job doing something else.
However, If you treat trading like a business, it will pay you like a business.
If you treat like a hobby, hobbies don't pay, they cost you...!
Disclaimer.
I am not sebi registered analyst.
My studies are for educational purpose only.
Please Consult your financial advisor before trading or investing.
I am not responsible for any kinds of your profits and your losses.

watch for range breakout buy above 1350 in intraday or swing trade
stoploss for swing trade daily candle close below 1295
For stoploss in Intraday use 5 minute chart and see nearest support.
for target use 5 min chart and fibonacci pivots as i don't keep predefined target.
try to book partially and trail.
Note: this is not a prediction for LONG/SHORT, trade will trigger only on given level as per technical analysis
NOTE: For Gapup or bo before 9:20
If gapup is more than 1% from bo level than avoid completely.
if less than 1% or gives bo before 9:20 than wait for
first 5 minute candle and entry above 5 minute candle
and revised SL below candle Low.
Voltas Short termVOLTAS LOOKNG GOOD
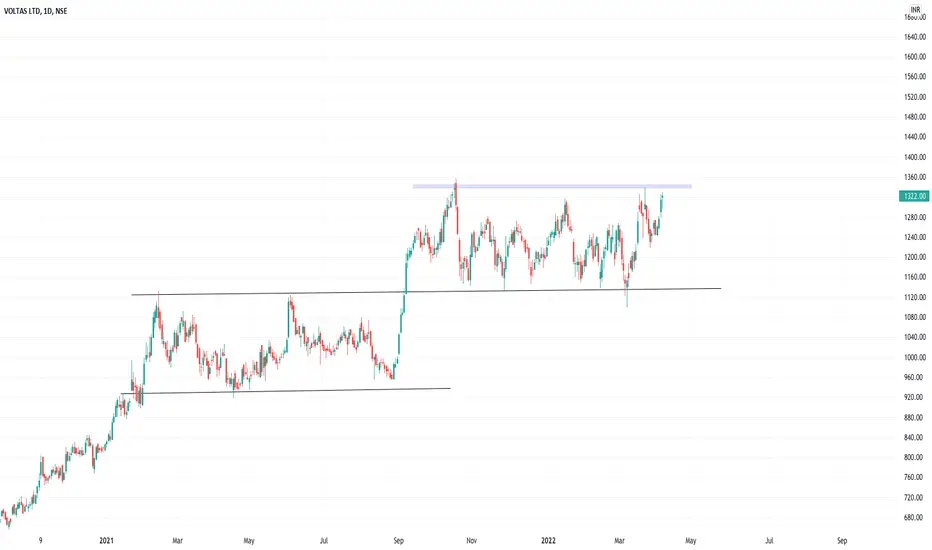
Strong weekly closing seem impulse move break out may happen
concentrate if price sustain above 1322 in daily

Voltas to Attempt BreakoutVoltas previously moved out of flag structure and gave retracement.
Now again made 3 white soldiers candlestick Pattern on daily chart.
Upside expected towards 1440-1528 with SL 1243
DISCLAIMER:There is no guarantee of profits nor exceptions from losses.
Technical analysis provided on the chart is solely the personal views of my research.
You are advised to rely on your own judgments while taking any investing/Trading decisions.
Past performance is not an indicator of future returns. Investment/trading is subject to market risks.
Seek help of your financial advisors before investing/trading.
Not recommended to take FnO positions based on this analysis
I may or may not trade this analysis. Details in description.

Voltas April 2022 Summer Swing Breakout Positional Good to take position above 1365 till 1375
Positional targets 1460 SL 1320
Long targets of 1600 SL 1220

#VOLTASStock is consolidating near ATH.. Trading above 200 WMA.. Stock is in strong uptrend.. Summer has started.. expecting more tempareture will increase in sales of AC.. so it's a commonsense pick.. range breakout expected..can be accumulated for target of 1460/1530

Live Challenging Stock Market Analysis Buy Voltas @ 984.35Market Analysis
Live Challenging Stock Market Analysis Buy Voltas @ 984.35
Target @ 1128.40
Our Unique Features:
—————————————————————
1. Follow our 15 signals ….10% equity will increase in your account for sure.
2. We are not Trailing stop! or average the trades.
3. 2% Risk Management Per trade.
4. Risk vs Reward up to 1:7.
Note:
Trade signals would usually have a risk to reward ratio of 1:2.
It means that even 2 out of 4 signals hits their SL marks, the other two would have closed with profit.
This allows you to be good in overall pips profit.
Signals are usually inter-day (Based on the daily candle) therefore, trades would usually have a holding time of an average minimum of 24 hours.
Note: Everything works with Best money management.
Note: Please leave comments for any query.
Disclaimer: This is my trading experience, it is not an invite or recommendation to trade.
Best Wishes
Forex Tamil

VOLTASShooting Star at Resistant level.
RSI Indicating Bearish Divergence.
Entry - Below low of candle.
Sl - Above High of Candle
Target - 1:1

Voltas Cmp 1296 dated 17.3.2022 SELLVoltas Cmp 1296 dated 17.3.2022 SELL
1. Shooting Star Candle on chart.
2. Price fall with Volumes.
Sell below 1290 for a tgt of 1225-1200 SL 1330
It is just a view, pls trade at your own risk.

Voltas | Trendline BreakOutNSE:VOLTAS breached the trendline but forms a reversal & bearish candle.
We can't take it as a confirmation for Long position. If it breached all time high and sustained above that level, we can consider a long position.


VOLTAS
CMP: 1271
- Took support at previous breakout level 1130-1140
- Trading in an Ascending Triangle pattern
"The Summer is coming"

Resistance Breakout in VOLTASDON'T HAVE TIME TO MANAGE YOUR TRADES?
- Take BTST trades at 3:25 pm everyday
- Book profits within first 30 minutes of the market opening
- Try to exit taking 3-5% profit of each trade
- SL can be taken when 5/15 min candle close below 44EMA
- SL can also be maintained as 1% or closing below the low of breakout candle
Levels mentioned on the chart are calculated using Breakout Indicator
Now why do I prefer BTST over swing trades? The primary reason is that I have observed that 90% of the stocks give most of the movement in just 1-2 days and the rest of the time they either consolidate or fall
Resistance Breakout in VOLTAS
Buy Today, Sell Tomorrow: VOLTAS

VOLTAS FORMING A CHANNEL PATTERN1 channel pattern
2 earlier channel pattern gave decent breakout and movement
3 this summer the sales is expected to increase

voltasit has a small resistance at 1210 to 1214 levels which if crossed can gain momemtum on the upside other it can see towards the downside range

HOW TO TRADE CHANNEL FAILURE SETUP All the details have shown on charts with proper details
lets learn and earn together


Voltas price in oversold trajectory and at major support level !The price in oversold area and at major support level.
The breakdown of support will generate 6-10% return on short term basis
Long entry if & only trend reversal candle create from level of EMA 200.
The chart is simple and self explanatory.
Disclaimer : Consult your financial advisor before any trading or/and investing activity.

#StockMarket #StockIdeas #StocktoWatch #StockToBuy #positionalVOLTAS
Stock trading in a zone from last 5months & now at its strong support
Can enter above 1160 for 1180 to 1200 levels, keep trailing SL to maximize profit.
Can be played Intraday also, and check 5min chart support for SL.
In case of Gap Up or Gap Down, then ignore the above setup.
Note:
Above levels are for education purposes only.
Do your own analysis before taking any trade
