ready to chill VOLTASStock Overview
Stock Name: Voltas Ltd.
Exchange: NSE (National Stock Exchange of India)
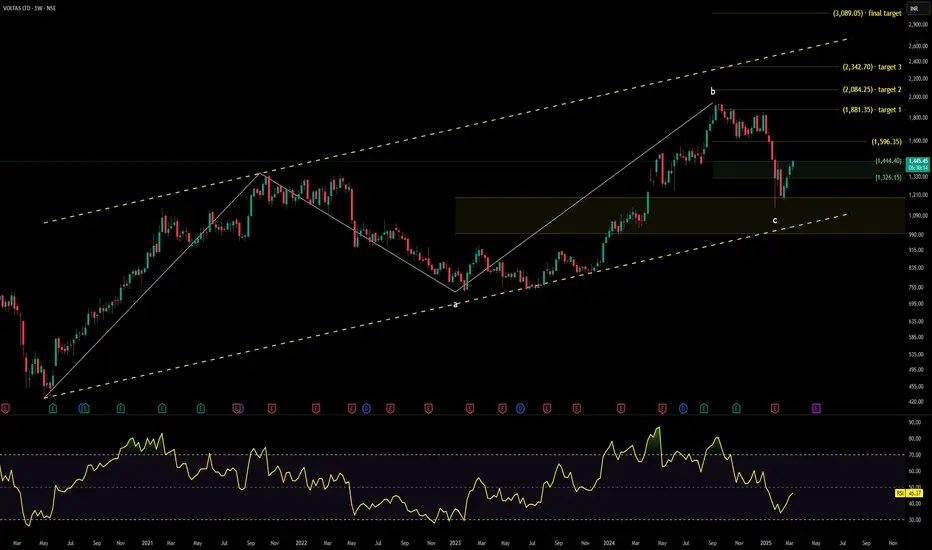
Current Price: 1,145.45 INR
Chart Timeframe: 1M (Monthly)
Company Business Profile: Voltas Ltd. is an Indian multinational company that provides engineering solutions for a wide spectrum of industries in areas such as heating, ventilation, air conditioning, refrigeration, electro-mechanical projects, and textile machinery.
Candlestick Pattern Analysis
The chart shows a prominent uptrend followed by a correction phase. There is a visible bullish engulfing pattern around point 'a', indicating a potential reversal from the downtrend. Additionally, there is a bearish engulfing pattern near point 'b', suggesting a possible short-term top.
Key Levels
Support (Yellow Zone): 1,188.55 INR
Swing Zone (Green Zone): 1,326.15 INR
Target Levels (T): Target 1: 1,881.35 INR Target 2: 2,084.25 INR Target 3: 2,342.70 INR
Technical Indicators
RSI (Relative Strength Index): The RSI is currently at 55.08, which is in the neutral zone. This suggests that the stock is neither overbought nor oversold, indicating a balanced momentum.
Volume Trends
The volume trends show a significant spike during the initial uptrend, which is a positive sign of strong buying interest. However, there is a noticeable decline in volume during the correction phase, suggesting a lack of selling pressure. This could indicate that the correction might be temporary and the uptrend could resume.
Sector and Market Context
Voltas Ltd. operates in the engineering and air conditioning sector, which has shown resilience and growth potential in recent years. The overall market trend has been bullish, with the NSE index showing a steady uptrend. Voltas Ltd.'s performance is in line with the sector and market trends, indicating a strong position within its industry.
Risk Considerations
Possible risks include market volatility, changes in government policies, and economic conditions that could impact the engineering and air conditioning sector. Additionally, global supply chain disruptions and fluctuations in raw material prices could affect the company's performance.
Analysis Summary
Voltas Ltd. is currently in a correction phase after a strong uptrend. The technical indicators suggest a balanced momentum with no immediate signs of overbought or oversold conditions. The volume trends indicate strong buying interest during the uptrend and a lack of selling pressure during the correction. The stock is well-positioned within its sector and the overall market trend is positive. However, investors should be aware of potential risks and market conditions that could influence the stock's movement.
VOLTAS trade ideas
Voltas - Reversal Trade after Gap Filling Made a BaseNSE:VOLTAS today confirmed making a base and Sharp Reversal From it after Filling the gap formed on daily charts in April 2024, the MACD has Become Positive and is trending Upwards along with RSI Showing Strength after the CLSA Report on the Indian Summer Season.
It says India's warmest February in 124 years could spur a demand uptick in cooling product categories like air-conditioners, air-coolers, refrigerators and fans
The weather office has warned of further rise in temperature and heatwave days going ahead.
About:
NSE:VOLTAS is engaged in the business of air conditioning, refrigeration, and electro-mechanical projects as an EPC contractor both in domestic and international geographies (Middle East and Singapore) and engineering product services for mining, water management and treatment, construction equipment and textile industry.
NSE:VOLTAS was created 6 decades ago when Tata Sons joined hands with a Swiss company Volkart Brothers. Voltas is also one of the most reputed engineering solution providers specializing in project management. The company has 5,000+ Customer sites actively managed across India.
F&O Activity:
Shorts in the System Getting Covered with 1400 & 1420 CE OI being Shed.
Trade Setup:
Looks like a good 1:1 Risk - Reward Trade, may find some Resistance Towards 200 DSMA so Swing till there can be played, if sustained and even go further.
Target(Take Profit):
Around 200 DSMA for Swing Trade and around 1700-1706 for Positional Trader.
Stop Loss:
Entry Candle Low for Swing Traders and Swing Low Levels Marked for Positional Traders.
📌Thank you for exploring my idea! I hope you found it valuable.
🙏FLLOW for more
👍BOOST if useful
✍️COMMENT Below your views.
Meanwhile, check out my other stock ideas on the right side until this trade is activated. I would love your feedback.
Disclaimer: "I am not SEBI REGISTERED RESEARCH ANALYST AND INVESTMENT ADVISER."
This analysis is intended solely for informational and educational purposes only and should not be interpreted as financial advice. It is advisable to consult a qualified financial advisor or conduct thorough research before making investment decisions.

view on voltasVoltas should trade above 1450 to resume upside target of 1550-1600 but below 1400 stock can be range bound between 1400-1250
Voltas: Looking Bullish Sentiment Amid Strong Support LevelsTechnical Analysis:
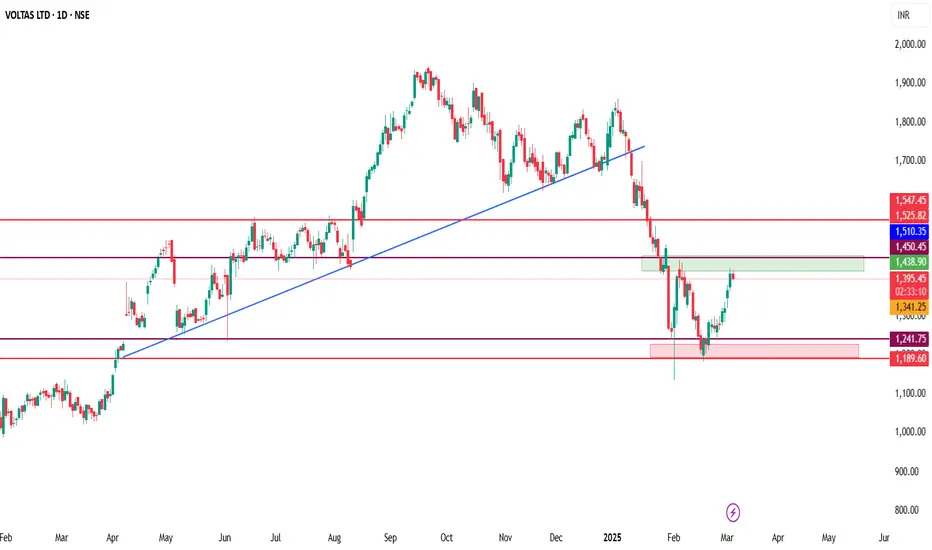
After the announcement of Q3 FY25 financial results on January 30, the stock witnessed a two-day decline. However, on February 1 (Budget Day), the stock found strong support at ₹1135 and began appreciating. The most recent resistance was observed at ₹1430-₹1450. From February 17, over the past 15 days, the stock has been in a continuous uptrend, forming higher highs and higher lows.
On March 3, the latest higher high was taken out, and the same level acted as support on the same day, confirming a strong bullish sentiment. The stock has been appreciating from this level, signaling further upside potential.
The key resistance levels to watch are ₹1440-₹1450 and ₹1560-₹1600. If these hurdles are breached, the stock may surge toward its all-time high.
Despite strong resistances, the overall structure remains bullish. Even in case of a retracement, the recent higher highs and higher lows will act as strong support levels. Traders and investors can place stop losses around ₹1322, with additional support at ₹1204 and ₹1135.
Fundamental Analysis:
Voltas has reported its Q3 FY25 earnings, showcasing strong financial performance. Below are the key financial metrics (values in ₹ crore):
Total Income: ₹3164 in Q3 FY25, ₹2725 in Q2 FY25, ₹2684 in Q3 FY24.
Total Expenses: ₹2941 in Q3 FY25, ₹2487 in Q2 FY25, ₹2624 in Q3 FY24.
Profit Before Tax: ₹223 in Q3 FY25, ₹238 in Q2 FY25, ₹60 in Q3 FY24.
Profit After Tax: ₹131 in Q3 FY25, ₹133 in Q2 FY25, -₹28 in Q3 FY24.
The company's total income has increased 16.1% QoQ from ₹2725 crore in Q2 FY25 and 17.9% YoY from ₹2684 crore in Q3 FY24. The profit before tax, though slightly lower than Q2 FY25, has shown a significant improvement YoY from ₹60 crore to ₹223 crore. Similarly, the profit after tax turned positive compared to Q3 FY24’s loss of ₹28 crore, reinforcing the company's financial strength.
Conclusion:
With a bullish technical pattern and strong financial results, Voltas presents a promising long-term opportunity. If the stock successfully breaks through its resistance zones, it has the potential for significant upside movement. Investors should closely monitor the breakout levels while considering key support levels for risk management.
Disclaimer: This analysis is for educational purposes only. Investors should conduct their own research before making any trading decisions.

VOLTAS - LongDouble bottom target achieved.
At Support now. Downside risk is low.
Fundamentally, summer season is good for business.
Buy at 1250, add @ 1475 for target of 1625-1700.
Timeline - 4-6 months.

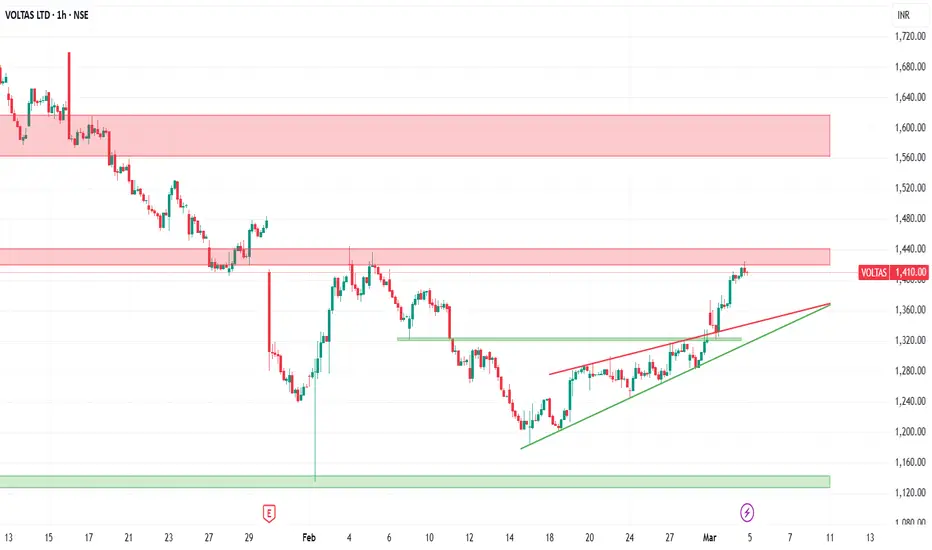
VoltasPrice was falling for few days and taken support from 1340 zone and moving up. Friday price consolidated in a narrow range. Break out can give good movement.
Buy above 1384 with the stop loss of 1372 for the targets 1396, 1410, 1426, 1442 and 1456.
Do your own analysis before taking any trade.

view on voltasVoltas should trade above 1450 to resume upside target of 1550-1650 but below 1400 stock can be range bound between 1400-1250

VOLTAS 2HR SWING TRADE
- EARN WITH ME DAILY 10K-20K –
VOLTAS Looking good for Downside..
When it break level 1615 and sustain.. it will go Downside...
SELL @ 1615
Target
1st 1538
2nd 1436
FNO
VOLTAS DEC FUT – LOT 11 (Qty-3300)
VOLTAS DEC 1720 PE – LOT 11 (Qty-3300) – PRICE (84.35)
Enjoy trading traders.. Keep add this STOCK in your watch list..
Big Investor are welcome..
Like this Post??? Hit like button..!!!
Follow me for FREE Educational Post and Alert..

Intraday Trade Setup for Voltas Ltd.:
Trade Type: Intraday
Strategy: Short below ₹1575
Key Highlights:
Wait for 15-minute candle closing below ₹1575 for confirmation
Targets:
Target 1: ₹1550
Target 2: ₹1531
Stop Loss: Adjust based on risk tolerance and price action
📌 Disclaimer: This analysis is for educational purposes only and not investment advice. Please consult a financial advisor before making any trading decisions.
#Voltas #IntradayTrading #ShortTrade #TechnicalAnalysis #StockMarket #TradingSetup #RiskManagement

voltas chart for study purposeshello ,
i have tried to explain liquidity concept through this chart,
as i have mentioned that to take a trade we have to wait for confirmation
as per voltas buying side confirmation will come if in 30 minutes it closes above 1690
the video has concept do watch it


VOLTAS a Flag under formation will it breakout ?
NSE:VOLTAS Ltd. is an interesting chart to keep on radar with following
1. RSI on all time frames above or almost at 60
2. Flag Pattern under formation at weekly chart
3. Price earlier was forming lower highs and lower lows; However after 16th December it started forming higher high and higher lows
4. ABCD pattern under formation on weekly chart
5. Weekly green candle on close of week with higher volume
6. Consumer Durable index is also forming similar bullish structure on charts
Will it breakout or continue its consolidation ?
Lets See How it Evolves.
Disclaimer: NOT A BUY / SELL RECOMMENDATION I am not an expert I just share interesting charts here for educational purpose and not to be taken as buy/sell recommendation. Please seek expert opinion before investing and trading as trading/ investing in market is subject to market risks. I do not hold any position in the stock as on date but I may look to take some position with my own Risk Reward matrix.

VIEW ON VOLTASBreakout on the stock
After a sideways move stock is forming strong candle since yesterday
Target 1830/1860/1930
Stop loss 1738
I am just representing my views
For educational purpose only.

Voltas: Bullish Momentum with Key Support at 1600 Topic Statement: Voltas is on a bullish trajectory, moving in an up trending channel with crucial support at 1600, offering a buying opportunity near the 180-day moving average.
Key Points:
1. The stock is steadily moving in an up trending channel, reflecting a bullish trend.
2. 1600 is a critical support level where the price has stabilized.
3. Accumulation is recommended when the price nears the 180-day moving average.

VOLTASAfter long run and forming higher high higher low it consolidates. It is very good time to make entry in voltas for the targets of 2000 and 2300

bullish trendstock reversed from important level 0.618 above 1815 will be a value buying zone mid to term target 2200 who have time they can enter

Voltas - Trendline breachedTopic Statement: Voltas' bullish trajectory is temporarily put on pause as the stock shifts into a bearish pattern.
Key Points:
1. The stock is moving within a down-trending channel, indicating continued selling pressure.
2. The breach of the medium-term uptrend signals further bearish momentum.
3. A gap at 1450 is expected to be filled, making 1500 an ideal buying level for long-term gains.

Voltas | ShortermNSE:VOLTAS
Voltas
Looking good above 1715
Target 1 - 1800
Target 2 - 1900 +
SL - 1620
Patterns:
- Positive divergence
- Triangle breakout
Note: Only for education purpose no buy sell recommendation

Voltas Date 27.11.2024
Voltas
Timeframe : Day chart
Remarks :
1 Bearish crossover between 20 ema & 60 ema
2 Breakdown of symmetrical triangle followed by bearish crossover mentioned above
3 Might test 200 ema falling in accumulation zone as highlighted
4 Trading below ichimoku cloud followed by negative crossover & flat future kumo
5 Flat future kumo is sign of resistance
6 In winters seasonal business is generally low compare to summer sales for Voltas
7 Buy : either breakout of kumo or resume of symmetrical triangle
8 Buy : either it touch down 200 ema
9 As of now weak set-up
Regards,
Ankur

VOLTAS BEARISH FLAG SELL"VOLTAS LTD (NSE: VOLTAS) is showing a potential bearish pattern on the 30-minute timeframe. After a significant downtrend, the stock formed a rising wedge pattern, which is typically considered a bearish continuation pattern.
Key observations:
A sharp decline from around 1910 to 1840 levels.
Formation of a rising wedge pattern, characterized by higher lows and higher highs, but with converging trendlines.
The stock price has just broken below the lower trendline of the wedge, suggesting a potential continuation of the downtrend.
The breakdown from the rising wedge suggests a possible bearish move. The next significant support level appears to be around 1836.05, which is marked as the 'Low' on the chart.

VOLTAS 1HRINTRADAY TRADE
- EARN WITH ME DAILY 10K-20K –
VOLTAS Looking good for Downside..
When it break level 1915 and sustain.. it will go Downside...
SELL @ 1915
Target
1st 1904
2nd 1895
FNO
VOLTAS SEP FUT – LOT 4 (Qty-2400)
VOLTAS SEP 1960 PE – LOT 1 (Qty-600) – PRICE (63.55)
Enjoy trading traders.. Keep add this STOCK in your watch list..
Big Investor are welcome..
Like this Post??? Hit like button..!!!
Follow me for FREE Educational Post and Alert..

Voltas Ltd.Voltas Ltd. (NSE), the stock is showing a strong upward momentum. The price is currently trading within an ascending channel, indicating a bullish trend. The stock has risen significantly, as seen by the consistent higher highs and higher lows, suggesting strength in buyer sentiment. The price is trading above the 21-day EMA (Exponential Moving Average), which acts as support, further reinforcing the bullish outlook. Additionally, the RSI (Relative Strength Index) is at 78.52, which indicates the stock is in overbought territory. This could suggest a possible short-term pullback or consolidation; however, as long as it remains above key support levels, the stock may continue its upward trajectory. Careful monitoring is advised, especially for any break below the lower trendline of the channel or a significant RSI divergence.
