Voltas: Bullish Momentum Continues, Potential Breakout Above 139The journey of Voltas since December 2023 has been nothing short of impressive, with a significant uptrend propelling its price from 900 levels. As it approaches the crucial resistance zone around 1400, traders are eagerly anticipating a potential breakout.
The recent bullish momentum suggests underlying strength in the stock, but caution is warranted at these levels. While the upward trend is intact, the resistance around 1400 could pose a challenge.
Traders should closely monitor price action, looking for confirmation of a breakout above 1395. A decisive move above this level could signal a continuation of the upward trend and offer compelling trading opportunities.
Additionally, keeping an eye on key support levels and employing risk management strategies are essential to navigate the market volatility. Stay vigilant and adaptable to capitalize on potential opportunities while mitigating risks.
VOLTAS trade ideas

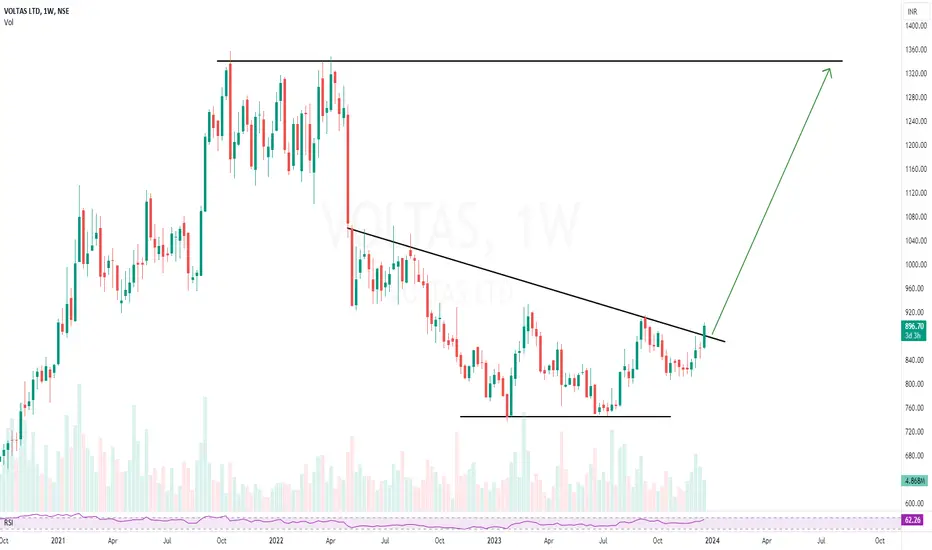
Voltas: Potential swing long
Took swing support at 0.618
Given a range breakout with good supporting volume
Retest post breakout pending, if the candle sustains above breakout level can give a good target till t2
Note: This is just for analysis purpose, please do your own research before punching any orders.
🔍 For more technical analysis and trade setups, make sure to follow me on TradingView

Voltas waiting for Multi year breakoutVoltas seems rounding bottom in monthly
waiting the break the 2022 high potential move may happen concentrate above 1400 in daily

Voltas breakout at bottomVoltas showing good breakout on the bottom levels. Ones it cross 912 and sustain. it should give good rally move.

VoltasBuy abv 870
(Breakout candle in weekly TFM - important)
Accumulate now 828 to 790
SL - 729
Target - 1065, 1152.

VOLTAS trading at it's Golden RatioStock Name-VOLTAS
.
Best time to invest.
.
Due to low risk and great reward.
.
Trading at it's Golden Ration level.
.
Internal Change of character (Weekly) - 832
.
Internal Break of structure (Weekly) - 934
.
Picked for Mid to Long Term

VOLTAS | Simple trendline and INHS setup - Looks good for 50%VOLTAS | Simple trendline and INHS setup - Looks good for 50%
CMP : 900
SL : 830
Target : 1350
1:4+ risk reward setup
Voltas Voltas is showing early sign of higher bottom formation and may eventually give a double bottom breakout in coming weeks.
Stock is trading around 61% retracement level of Covid low to ATH run up and has previously given a falling wedge breakout around it in Jan.
After giving a decent run up from there it has retraced back and has now been at fibo support zone along with a long term trendline support,
So a confluence of support zone.
In previous week it has made a inverted bullish pinbar and current weekly candle is showing a sign of reversal around it.
Overall setup looks quite spicy and is very similar to early higher bottom catch which I had shared some time back in Bajfinance.
Link to that idea is available in Related idea section.


VOLTAS HAS MORE STEAM LEFT FOR MORE UPSIDEVoltas has good support zone around 1035 - 990 and until this is holding we expect to see another upmove towards 1250 - 1300 zone.
Please like the idea If you agree with the analysis, your like will motivate us to share more ideas on Tradingview.
Happy Trading!
InvestPro India

VOLTAS - Weekly AnalysisIn the Weekly Chart of VOLTAS ,
we can see that; it is very bullish it might retest the trendline.

VOLTASVoltas - Mutiple pattern breakout rally and may continue further concentrate at this level.
For the targets 1003 and 1157. This is my view and it may be biased, do your own analysis

Rectangle pattern breakoutDaily timeframe volume profile look good enough.
Rectangle pattern breakout with good volume.
Daily timeframe price has taken support from 50EMA.
Weekly profile also looks good.
Good setup for both intraday and swing if breaks present candle high.
NOTE: I do my analysis, do your before trade.

VOLTAS - Ichimoku Breakout📈 Stock Name - Voltas Limited
🌐 Ichimoku Cloud Setup:
1️⃣ Today's close is above the Conversion Line.
2️⃣ Future Kumo is Turning Bullish.
3️⃣ Chikou span is slanting upwards.
All these parameters are shouting BULLISH at the Current Market Price and even more bullishness anticipated AFTER crossing 1152.
🚨Disclaimer: This is not a Buy or Sell recommendation. It's for educational purposes and a guiding light to learn trading in the market.
#CloudTrading
#IchimokuCloud
#IchimokuFollowers
#Ichimokuexpert
Excited about this analysis? Share your thoughts in the comments below!
👍 Like, Share, and Subscribe for daily market insights! 🚀
#StockAnalysis #MarketWatch #TradingEducation #ichimoku

voltas buyBuy near 1052
sl close bewlo 1040
easy tg - 1062
tg2 - 1075
Not suggested Disclaimer : This is my personal analysis for study purpose not intended for trading.

Voltas - Breakout with Higher LowsNSE:VOLTAS has broken out after over a year of consolidation.
Voltas started making higher bottoms after making double bottom pattern.
Stock is showing great volumes.
CMP 977
Breakout level: 930
SL: 899
Target: 1125
Stock can come back to its breakout level to retest the breakout. Retesting of breakout makes the breakout stronger.
Note: It's weekly chart analysis. Don't think short term based on this analysis.
Remember: SLs are essentials.
Disclaimer: I'm not a registered analyst. I'm just sharing my opinion on the platform for others to benefit in learning from my market understanding. Please do your due diligence before making a trade.

Voltas After the ATH its give little PB( correction.
Once its break 1085 strong buying so
next target will be 1115. Otherwise
its moving downtrend channel oly
it will go 1035, 1020

Voltas Breakout Swing Trade Idea Hi friends Good morning Sharing my swing trade idea on Voltas limited and probabily it is the last one for the year of 2023 mates, So as we can see that after making all time highs of 1350 levels all the way price came down 740 levels and it was almost a fall of 45% from all time highs levels. So now the observation is this that price seems to be bottmed out on this provided chart by making a double bottom formation and now by the clsoing of last week price breached (Breakout) strong resistance area from where it got rejected two times at the same price levels and formed a double too and as i mentioned above that by this breakout price breached that double top along with resistance area and some how it is seems a symmetrical triangle breakout too before it breached marked resistance area.
Retest entry-: 930-915 levels are looking good for a breakout retest entry guys although price retested it's breakout too one can check on daily time frame.
Target and risk management-: Stoploss and targets both i marked on published chart for clear and better understaning and transperency friends, Hope you like it !
This publication is meant for only learning purpose, it is not any kind of trading advice.
Best Regards- Amit
“Hope is a bogus emotion that only costs you money.” -Jim Cramer

Voltas at breakout level Voltas looking strong for breakout after breaking resistance it may give good upside move

VOLTAL [WEEKLY]. Voltas in weekly time frame near breakout
. Price trading at very important Resistance
. If price breaks resistance, then we go for long.
. Only educational purpose, do analysis before investing.

VOLTASIn this chart clearly see VCP pattern in VOLTAS.
probably it brakes upward and give good move.
so watch it will give breakout or not

Simple Price Action- Support & ResistanceBreaking Resistance
volume is high
rsi breakout
above crucial ema

Voltas moving in green. Intraday trade for 01/02/24.Voltas on the daily close has given a break out of the resistance zone around 1050-60.
It made a base around the 20 DEMA and given a nice move with good volumes.
Bullish entry can be made in the stock for positional trade for a ultimate level fo 1230.
Intraday entry with 1140 as target can be initiated and a stict SL should be kept as tomorrow is budget.
Target :- 1140, 1230
Support :- 1082, 1055
Enty :- Starts trading above 1095 levels.
Crossing the resistance level of 6 month can give some buying momentum.
Wait for the price action near the levels before entering the stock.
