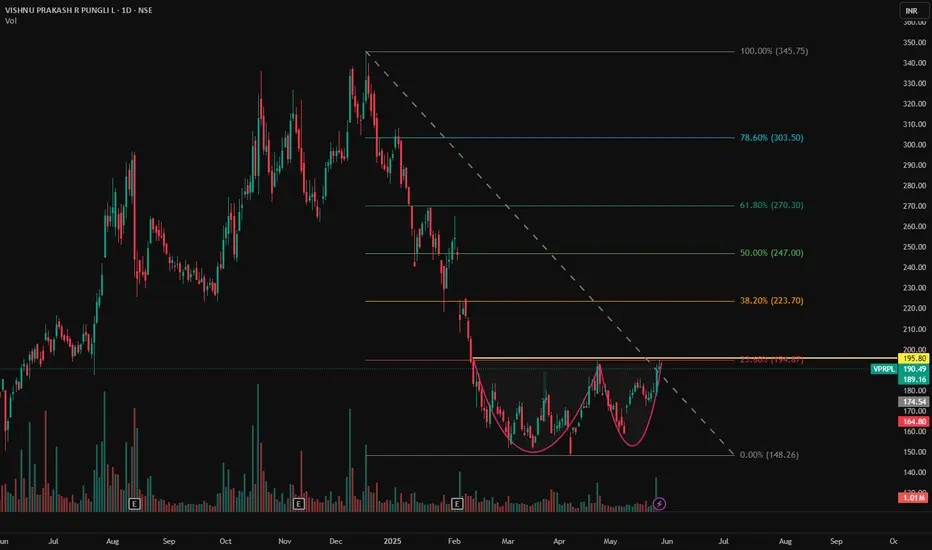
VPRPL - NSE | Daily Timeframe📊 VISHNU PRAKASH R PUNGLIA LTD (VPRPL) – NSE | Daily Timeframe
📅 Date: May 29, 2025
📈 CMP: ₹190.49 (−0.41%)
📌 Ticker: NSE:VPRPL
🧠 Technical Overview
✅ Cup & Handle Pattern in Formation 🍵
Price action is carving out a clean Cup & Handle base near the ₹195.80 resistance zone. A breakout above this ne
Vishnu Prakash R Punglia Ltd.
No trades
2.47 INR
585.96 M INR
12.37 B INR
61.90 M
About Vishnu Prakash R Punglia Ltd.
Sector
Industry
CEO
Sanjay Kumar Punglia
Website
Headquarters
Jodhpur
Founded
1986
IPO date
Sep 5, 2023
Identifiers
2
ISIN INE0AE001013
Vishnu Prakash R Punglia Ltd. engages in the provision of integrated engineering, procurement, and construction services. It operates under the following segments: Water Supply Projects, Railway Projects, Road Projects, and Irrigation Network Projects Segment. The company was founded on August 14, 1986 and is headquartered in Jodhpur, India.
Related stocks
Vishnu Prakash Date 18.02.2025
Vishnu Prakash
NSE: VPRPL
Cmp 164.90
All potential to bounce from here !
Target 200
Strengths
The company has shown a good profit growth of 86.02% for the Past 3 years.
The company has shown a good revenue growth of 44.77% for the Past 3 years.
Company has been maintaining health

Breakout in VPRPLSymmetrical Triangle Breakout Setup
RSI above 70and rising
Trading above EMA50
Volume spurt
Disc: for study, not a recommendation

VPRPLVPRPL formed strong support near 288-90. Seems too promising for its new ride. Keep it on radar.

VPRPL
Price gave a breakout above previous all time high in July.
Subsequently, it retraced back to its breakout level support, and has now given a confirmation of the up-move.
Because of low price history, we cannot fix a target.
Bullish outlook remains intact as long as price is above 220.

VPRPLVPRPL has given good breakout and is trading at ATH. Volume action also observed in all positive days. Keep it on radar.

Medium term trading opportunity in VPRPL for v. good upsideHi,
NSE:VPRPL has given a Bullish Flag Breakout on Weekly charts with very good volume.
MACD is also on the bullish side on Weekly time frames. RSI is also on the bullish side on daily, weekly and monthly time frames.
In the current market scenario, I am expecting that the bullish momentum wil

Potential upmove - VPRPLCheckout an amazing breakout happened in the stock in Weekly timeframe.
IMPORTANT BREAKOUT LEVELS ARE ALWAYS RESPECTED!
NOTE for learners: Place the breakout levels as per the chart shared and track it yourself to get amazed!!
#No complicated chart patterns
#No big big indicators
#No Excel sheet

VPRPL - W Patrn Contributing to the infra theme. Best above 211Vishnu Prakash - The Gap has filled with the new order news and on its way to Double bottom formation.
One can take fresh entry above 211 and buy between 170 to 211 if there is a fall
Strict Stop Loss of 178
Disclaimer : Educational Content. Please do your own research.

VPRLIn an IPO base, the pattern typically starts within 25 days of the stock's first day of trading. Know the important similarities with regular bases. For example, the buy point is drawn by taking the prior high. The price gain on the breakout should be strong.

See all ideas
Summarizing what the indicators are suggesting.
Neutral
SellBuy
Strong sellStrong buy
Strong sellSellNeutralBuyStrong buy
Neutral
SellBuy
Strong sellStrong buy
Strong sellSellNeutralBuyStrong buy
Neutral
SellBuy
Strong sellStrong buy
Strong sellSellNeutralBuyStrong buy
An aggregate view of professional's ratings.
Neutral
SellBuy
Strong sellStrong buy
Strong sellSellNeutralBuyStrong buy
Neutral
SellBuy
Strong sellStrong buy
Strong sellSellNeutralBuyStrong buy
Neutral
SellBuy
Strong sellStrong buy
Strong sellSellNeutralBuyStrong buy
Displays a symbol's price movements over previous years to identify recurring trends.
Frequently Asked Questions
The current price of VPRPL is 47.10 INR — it has increased by 4.98% in the past 24 hours. Watch Vishnu Prakash R Punglia Ltd. stock price performance more closely on the chart.
Depending on the exchange, the stock ticker may vary. For instance, on BSE exchange Vishnu Prakash R Punglia Ltd. stocks are traded under the ticker VPRPL.
VPRPL stock has risen by 11.96% compared to the previous week, the month change is a −2.52% fall, over the last year Vishnu Prakash R Punglia Ltd. has showed a −78.44% decrease.
We've gathered analysts' opinions on Vishnu Prakash R Punglia Ltd. future price: according to them, VPRPL price has a max estimate of 105.00 INR and a min estimate of 105.00 INR. Watch VPRPL chart and read a more detailed Vishnu Prakash R Punglia Ltd. stock forecast: see what analysts think of Vishnu Prakash R Punglia Ltd. and suggest that you do with its stocks.
VPRPL reached its all-time high on Dec 17, 2024 with the price of 345.85 INR, and its all-time low was 42.82 INR and was reached on Jan 27, 2026. View more price dynamics on VPRPL chart.
See other stocks reaching their highest and lowest prices.
See other stocks reaching their highest and lowest prices.
VPRPL stock is 10.33% volatile and has beta coefficient of 1.87. Track Vishnu Prakash R Punglia Ltd. stock price on the chart and check out the list of the most volatile stocks — is Vishnu Prakash R Punglia Ltd. there?
Today Vishnu Prakash R Punglia Ltd. has the market capitalization of 5.84 B, it has decreased by −2.43% over the last week.
Yes, you can track Vishnu Prakash R Punglia Ltd. financials in yearly and quarterly reports right on TradingView.
Vishnu Prakash R Punglia Ltd. revenue for the last quarter amounts to 2.96 B INR, despite the estimated figure of 2.98 B INR. In the next quarter, revenue is expected to reach 3.10 B INR.
VPRPL net income for the last quarter is 36.50 M INR, while the quarter before that showed 70.05 M INR of net income which accounts for −47.89% change. Track more Vishnu Prakash R Punglia Ltd. financial stats to get the full picture.
No, VPRPL doesn't pay any dividends to its shareholders. But don't worry, we've prepared a list of high-dividend stocks for you.
As of Feb 5, 2026, the company has 10.54 K employees. See our rating of the largest employees — is Vishnu Prakash R Punglia Ltd. on this list?
EBITDA measures a company's operating performance, its growth signifies an improvement in the efficiency of a company. Vishnu Prakash R Punglia Ltd. EBITDA is 1.29 B INR, and current EBITDA margin is 13.26%. See more stats in Vishnu Prakash R Punglia Ltd. financial statements.
Like other stocks, VPRPL shares are traded on stock exchanges, e.g. Nasdaq, Nyse, Euronext, and the easiest way to buy them is through an online stock broker. To do this, you need to open an account and follow a broker's procedures, then start trading. You can trade Vishnu Prakash R Punglia Ltd. stock right from TradingView charts — choose your broker and connect to your account.
Investing in stocks requires a comprehensive research: you should carefully study all the available data, e.g. company's financials, related news, and its technical analysis. So Vishnu Prakash R Punglia Ltd. technincal analysis shows the sell today, and its 1 week rating is sell. Since market conditions are prone to changes, it's worth looking a bit further into the future — according to the 1 month rating Vishnu Prakash R Punglia Ltd. stock shows the sell signal. See more of Vishnu Prakash R Punglia Ltd. technicals for a more comprehensive analysis.
If you're still not sure, try looking for inspiration in our curated watchlists.
If you're still not sure, try looking for inspiration in our curated watchlists.