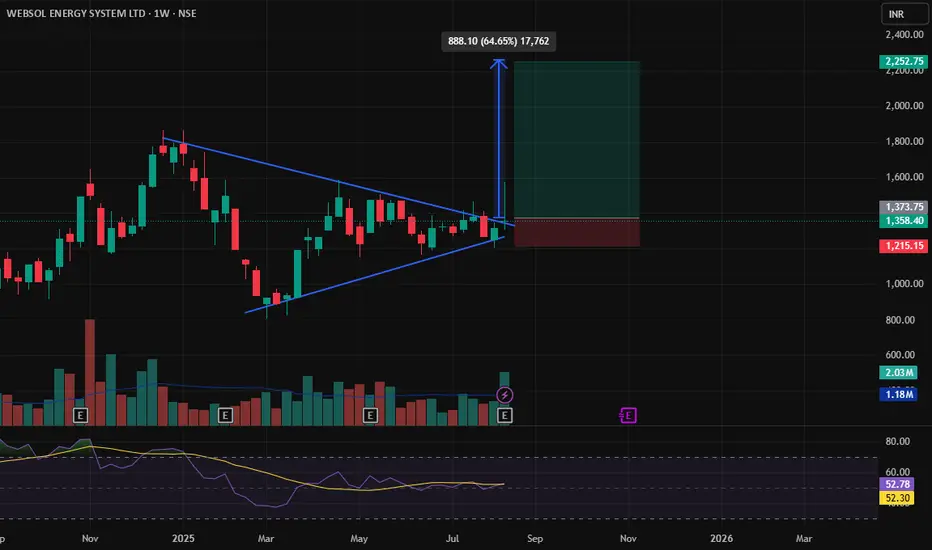
Websol Energy System LtdWebsol Energy System Ltd, on weekly timeframe this stock is giving good breakout, in coming 3-4 months this can reward us with approx. 70%. fundamentals of this stock is superb. have a look and plan accordingly.
WEBELSOLAR trade ideas
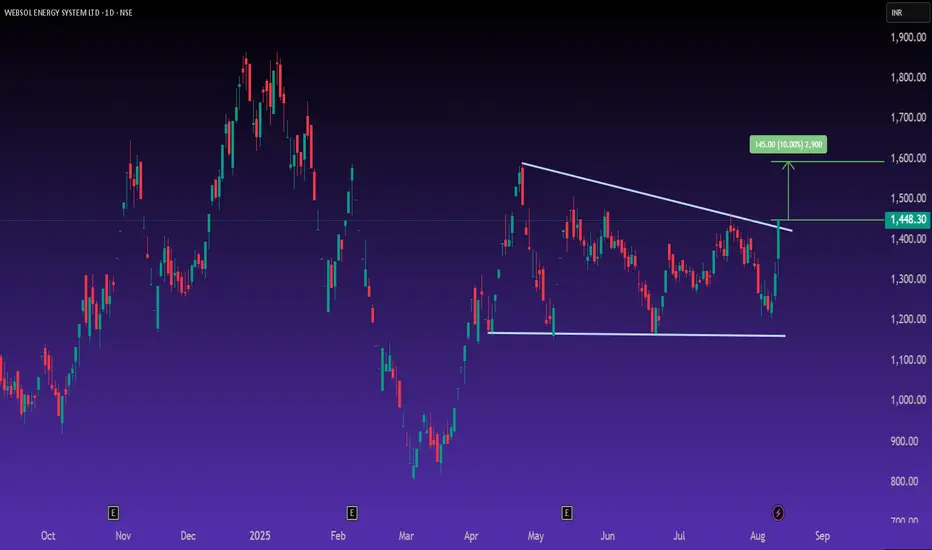
Websol Energy (WEBELSOLAR)**📊 Technical Analysis**
Websol Energy has given a strong breakout from a descending triangle formation on the daily chart, backed by a 9.99% upper circuit close at ₹1,448. The breakout confirms renewed buying interest, with an immediate pattern target of around ₹1,590–₹1,600 (≈10% upside).
Support is now placed near ₹1,400, with stronger support at ₹1,250 in case of deeper pullbacks. The price action shows rising momentum, suggesting potential continuation if volumes stay elevated.
**📈 Fundamental Analysis – Q1 FY26 (Jun 2025) Results**
The company delivered exceptional YoY growth:
* **Sales:** ₹219 Cr — up **96% YoY**
* **EBIDT:** ₹103 Cr — up **135% YoY**
* **Net Profit:** ₹67.2 Cr — up **194% YoY**
* **EPS:** ₹15.47 vs ₹5.42 last year — **185% growth**
* **Valuation:** PE \~31.6, reflecting strong growth expectations in the renewable energy space.
This surge in profitability and margins underlines operational efficiency and strong demand in the solar sector, potentially positioning Websol as a key beneficiary of India’s renewable energy push.
**💡 Conclusion**
With a bullish chart breakout aligning with stellar earnings growth, Websol Energy appears poised for further upside toward ₹1,600 in the short term. Long-term prospects remain promising, given the sector tailwinds and earnings momentum.
**Disclaimer:** Educational purpose only. Not investment advice.
Websolar- Check as already super high, Sales growth is greater than 25 percent, and
Profit growth is greater than 30 percent, and
Year-on-year quarterly profit growth is greater than 25 percent, and
Change in Foreign Institutional Investor (FII) holding is greater than zero, and
Change in Domestic Institutional Investor (DII) holding is greater than zero, and
Change in promoter holding is greater than zero.
Stock Analysis: Websol Energy System LtdIntroduction:
Websol Energy System Limited is engaged in the business of manufacturing photovoltaic crystalline solar cells and related modules in India. Co. specializes in the production of photovoltaic crystalline solar cells and related PV modules. The Company’s products are used in both commercial and industrial Solar Energy panels in India and internationally.
Fundamentals:
Market Cap: ₹ 6,400 Cr.;
Stock P/E: 41.4 (Ind. P/E: 44.87) 👍;
ROCE: 59.2% 👍; ROE: 80.2% 👍;
PEG Ratio: 0.71 👍 (Stock price valuation is relatively undervalued related to its growth prospects)
3 Years Sales Growth: 39% 👍
3 Years Compounded Profit Growth: 160% 👍
3 Years Stock Price CAGR: 149% 👍
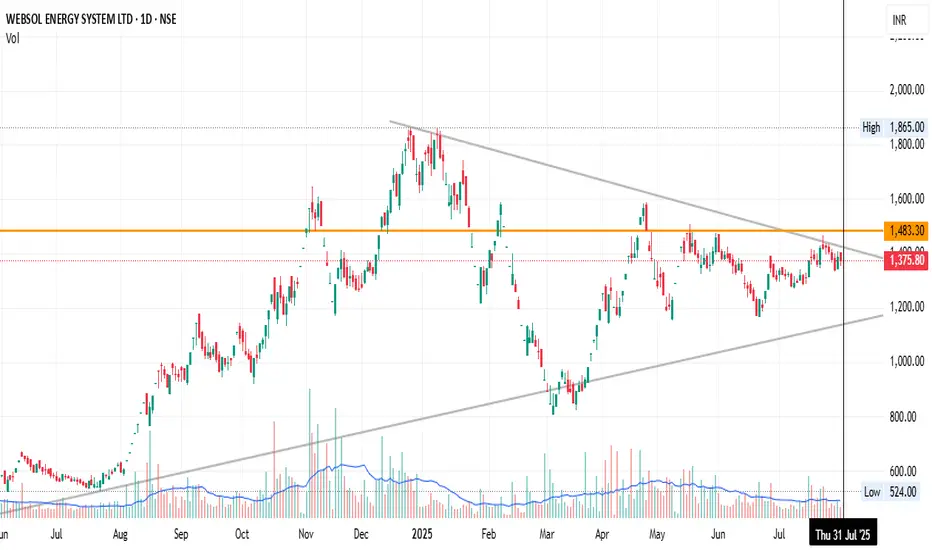
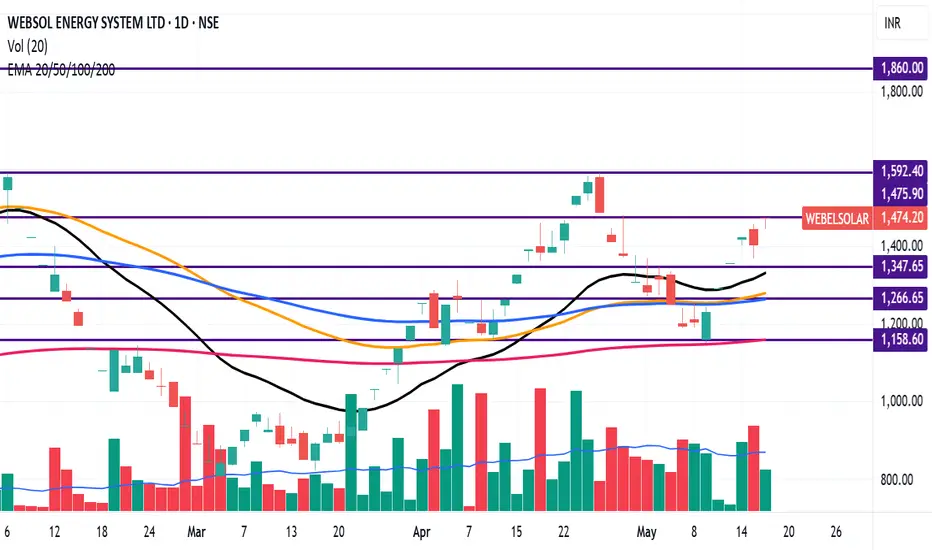
Technicals:
The stock is trading above 20 EMA(Black Line), 50 EMA (Orange Line), 100 EMAs (Blue Line) and 200 EMA (Pink line).
Resistance levels: 1475, 1592, 1860
Support levels: 1347, 1266, 1158,
The stock shows Bullish Momentum above Short, Medium and Long Term Moving Averages
WEBSOL 🚀 ♾️If sustains on 694 on or within 17th July 2024 ( weekly ) then 📈 📈 to 1313 within or on 7th Oct 2024
Any weekly closing above
that white Arc could be bullish to above targets
Disclaimer:
Its a personal view not a financial advise and I assume no responsibility and liability whatever outcome arises.


Webelsolar - Flag and Pole Formation. Best above - 647#WebelSolar -
What an excellent results delivered by this co.
Blockbuster Q1FY25 👏
Solid turnaround 👍
Rev at 111cr vs 0.18cr, Q4 at 25cr
PBT at 32cr vs -4cr, Q4 at -31cr
PAT at 23cr vs-5cr, Q4 at -58cr
Q1 EPS at 5.4rs
The Stock has formed Flag and Pole pattern on the weekly charts
One can enter above
One can enter above 647 with strict stop loss of 537
Targets - 745/962/1150
Disclaimer : Educational Content. Please do your own research.

Websol NSE:WEBELSOLAR Websol Energy System Limited is engaged in the business of manufacturing photovoltaic crystalline solar cells and related modules in India.
Must add for future watchlist
It's one of the solar panel manufacture in India
Right Now it's Risk Reward are not favorable. Wait for correction and for long term wait for the fundamental improvement

WEBSOL GETTING READY FOR MULTI YEAR BREAKOUT!!The stock is Broken it's very strong support/resistance level.
This is Multi Year Breakout
Keep a watch coming week on how the price moves. A strong day closing above 251 will be a good sign for positional.
This idea is for Educational Purpose Only.
Learn & Earn,
Lets Grow Together
Faisal Merchant
I am not SEBI registered and all Ideas posted by me are for Educational Purpose

WEBELSOLAR --- marching towards 170 in coming monthsNSE:WEBELSOLAR
double trendline breakout on weekly chart
first at 97 and now at 110
30% to 40% gains can be targeted
cmp is 112.8
note: fundamentals are weak. so one conveniently ignore this
so let's observe how this one performs purely on technical base
This analysis is being done for educational and knowledge-sharing purposes.
This article does not offer any kind of buy or sell advice.
All stocks are positional and are held for a short to medium period of time.
Everyone is expected to conduct their own research and analysis to determine whether my point of view aligns with yours.
i always take position in stocks where both technical and fundamental analysis are in sync with the study
it is less risky and chances of making hugh gains are more

YR 2022 Idea #136: Long on WEBELSOLAR This is a public swing trade idea and is only for Learning and observational purpose. Please understand your risk and take full responsibility of your actions. I might trail my stoploss after I get an entry but even if my original Stoploss hits, i exit the trade with pre-planned loss (risk). At target, I book usually 75% positions and trail stoploss for rest. Our objective to help anyone who wants to learn technical analysis using charts by demonstrating my real trade entries. You can post your queries in comment section here and we will try to answer them asap.

Webelsolar Looks good for long with sl 118Webelsolar looks good for long with sl 118. It is taking support at 125 for 1st target 150

ROUNDING BOTTOM BREAKOUT! Websol EnergyThis chart came on my watch before 2 weeks @ 160. The stock has clear resistance at 140 and it has successfully broken it with higher volume. More importantly I loved the rounding bottom pattern it has created over the period of 4 years . This is the father of all the pattern and one can expect HUGE returns from these breakouts . Here R:R ratio is very much favorable because I was waiting for the stock to retest its previous resistance. In last 2 weeks it has consolidated around 20% and now somewhere near its previous resistance of 140 . Try to accumulate the stock between 133 to 150. Do not buy above 170.
One more reason I wanted to buy this stock is because before few weeks stock has gained 60% in a week. There may be a possibility of insider buying. Someone inside the company may have some information and they bought the stock with some information which may not be available for outsiders.
CMP - 139.
Target - 218, 350 Weekly.
SL - 120 Weekly closing basis.
View - Medium to long term. (around 2 years)

WEBELSOLAR CHANNEL BREAKOUTWEBELSOLAR gave a breakout with outstanding volume from a channel pattern after consolidating in it for a year.
Stock looks very bullish but may consolidate for some time before the next move up.
Could trade at 120-130 in the near future, especially if the broader market shows more strength in the coming weeks.

Websol looking goodOne can look at websol energy @95, for short-term gain. volumes are increasing & it is showing interest in this particular stock.

WEBELSOLARLooking for a pullback to enter
Since overall market is bearish....let the market stabilize.
It might take some days for the pullback to complete.

Traget 90 ( 1 to 5 months )Good Technical and Fundamental, MovingAvg. going up, Target 90, Duration ( 1 to 5 months )

WEBELSOLAR Long term rounding bottom and BO with massive volumes in last couple of weeks.
First upside target will be 123 and then can try to regain its life time highs.

Websolar Multiyear break outWebsolar Multiyear break out, one should enter at 88-96, with sl of 81, tght 158+

WEBELSOLAR1. All time high
2. Volume interest
3. Resistance Breakout
4. Showing strength against market weakness


