WIPRO staying below 320 headed for 280Attached: Weekly Price Chart as of 21st Feb 2025
Price has Topped out and broken below median of Pitchfork and can slide down to bottom of the Bottom of Pitchfork and even break below it completely
Staying below 320
Immediate Downside Target is 280
WIPRO trade ideas

WIPROWIPRO:- Time tested Stock. already 2X done smoothly within 4 years. If you are interested in this stock for long time, so remember weekly 50 SMA is more important parameters for long term holding. If the stock close below weekly 50 SMA by closing basic then please don't hold for long position.

Wipro - Multi-year bullish pennant1. Wipro - Multi-year bullish pennant
2. High risk/reward
3. Might take 3-5 years to hit the target

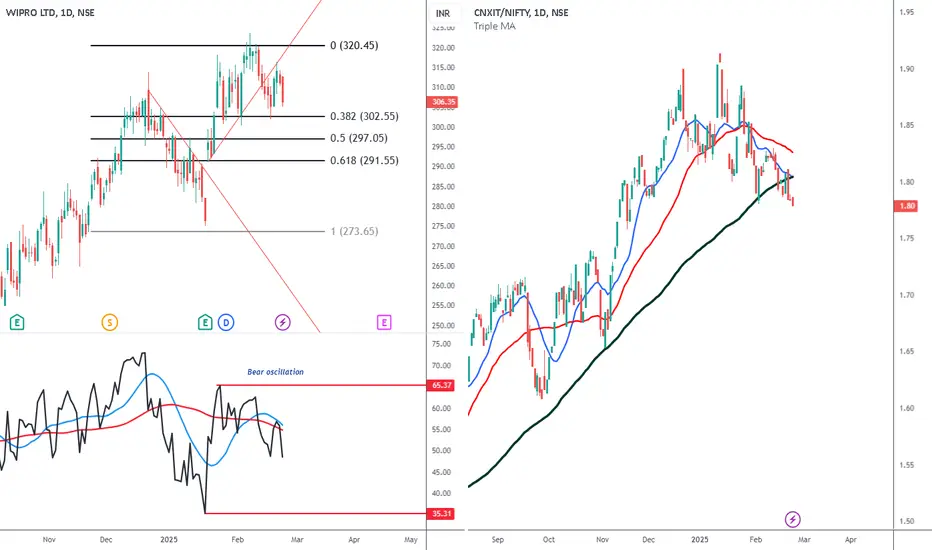
IT stocks about to correct sharplyLeft chart- Wipro
Right chart- Nifty IT Vs Nifty
Ratio Study- that the ratio is below all the three averages, is an indication that IT stocks will underperform Nifty. I had already stated that the correction in them is not over yet.
So three stocks which are a sell right now are Wipro, Infy and TechM, TCS will fall too but these are better bets as they have just started,
WIPRO - MULTI YEAR BREAKOUT - WEEKLY CHARTWipro has broken multiyear Resistance at weekly chart and consolidating.
It is also making VCP pattern at daily time frame.
It is looking strong. If it breaks 324 then there is probability of a good upside move. Keeping in mind the current market situation SL is must.
Finding right support and resistance are important.
If you like my analysis, please follow me as a token of appreciation :)
in.tradingview.com/u/SatpalS/
For learning and educational purposes only, not a trading advice. Pls consult your financial advisor before investing.

importance of option chain pcr with proper guidanceThe **Option Chain** and **Put-Call Ratio (PCR)** are crucial tools for traders and investors who want to analyze market sentiment, identify potential trends, and assess the market’s outlook. Let’s break down the importance of both and how you can use them for your trading strategy.
### **What is an Option Chain?**
An **Option Chain** is a list of all the available **call options** and **put options** for a specific underlying asset (like a stock or index) that is traded on the options market. It shows the various strikes, expiration dates, and other essential data like volume, open interest, and implied volatility for each option. Essentially, it’s a snapshot of the entire market for options on that asset.
#### **Components of an Option Chain**:
1. **Strike Price**: The price at which the underlying asset can be bought (for calls) or sold (for puts).
2. **Expiration Date**: The date on which the option contract expires.
3. **Call and Put Option Prices**: The current trading price for call and put options.
4. **Open Interest**: The total number of outstanding contracts for each option at a particular strike price. It gives an idea of how many options are currently being traded or held.
5. **Volume**: The number of contracts traded in a given period (usually one day).
6. **Implied Volatility (IV)**: This shows the market’s expectation of future volatility for the underlying asset, which affects the price of options.
7. **Delta**: Measures how much the option's price will change for every $1 move in the underlying asset.
### **What is Put-Call Ratio (PCR)?**
The **Put-Call Ratio (PCR)** is a widely used market sentiment indicator. It is calculated by dividing the **Open Interest of Put Options** by the **Open Interest of Call Options**:
\
Alternatively, it can be calculated using **volume** instead of open interest:
\
### **Why is PCR Important?**
The PCR helps traders gauge the overall sentiment of the market. The interpretation is as follows:
- **PCR > 1**: There are more **put options** than call options, suggesting that market participants are **bearish** or expecting a decline in the price of the underlying asset.
- **PCR < 1**: There are more **call options** than put options, suggesting that market participants are **bullish** or expecting a rise in the price of the underlying asset.
- **PCR = 1**: Indicates a balanced market sentiment where there is an equal interest in puts and calls.
### **How to Use the Option Chain and PCR in Your Trading Strategy**
#### 1. **Identify Market Sentiment (Bullish or Bearish)**
- By observing the PCR, you can get a quick snapshot of overall market sentiment:
- A **high PCR** (above 1) suggests **bearish sentiment**, where traders are hedging against a possible market drop.
- A **low PCR** (below 1) suggests **bullish sentiment**, where traders expect prices to rise.
However, you should also look for **extreme PCR values**. When PCR reaches very high levels (e.g., above 2 or 3), it can signal **extreme bearish sentiment**, which might indicate an oversold condition and a potential market reversal. Similarly, very low PCR values can indicate **extreme bullishness**, which might suggest that the market is overbought and due for a correction.
#### 2. **Look for Support and Resistance Levels**
- **Open Interest**: Open interest in the option chain provides insight into where traders expect prices to find support or resistance. When there is high open interest at a particular strike price, that price level can act as a **psychological barrier** or key support/resistance level. For example:
- If there is heavy open interest on **strike price 100** (say, for call options), the price of the underlying asset might have difficulty breaking through this level.
- Similarly, if there is heavy open interest for **put options at strike 90**, it could be a strong support level.
- **Volume**: Option volume can show where the majority of trades are taking place. If large volumes are seen at specific strike prices, it might indicate potential turning points or market focus on those levels.
#### 3. **Using Option Chain to Track Institutional Activity**
- Institutional traders tend to have a large influence on the options market, and their positions can often be identified through unusually high **open interest** or **volume** at certain strike prices. By identifying these **large institutional positions**, you can align your trades with the “smart money”.
- For example, if you notice heavy open interest in **call options at a higher strike price**, it might suggest that institutional traders are expecting the price to rise.
#### 4. **Implied Volatility (IV) and Market Movements**
- IV reflects market expectations for future volatility. Higher IV means the market anticipates greater price swings, while lower IV suggests a quieter market.
- Momentum traders often use **rising implied volatility** to enter **options trades** (calls or puts), as an increase in volatility can significantly increase the value of options.
#### 5. **Using PCR for Contrarian Signals**
- **Extreme PCR readings** can be interpreted as contrarian indicators. For example:
- A **high PCR** could signal that the market is overly bearish (i.e., too many put options are being bought). This could be a signal to buy, as the market may be oversold.
- Conversely, a **low PCR** could indicate that the market is overly bullish and ripe for a pullback or correction.
#### 6. **Analyzing Option Chain for Breakout or Breakdown**
- By monitoring changes in the option chain, especially open interest and volume, you can anticipate possible breakouts or breakdowns in the price of the underlying asset. Large changes in open interest or high volumes near support or resistance levels can give early signals of price movements.
- For instance:
- If large call volumes and increasing open interest are seen at a specific strike price, it may signal that the price is about to break above that level.
- If put options see increased interest near a support level, the market could be expecting a breakdown.
#### 7. **Expiration Date Insights**
- Option chains often display options with various expiration dates (e.g., weekly, monthly). Watching how these options are traded as expiration approaches can provide insights into the strength of a trend or potential reversals. Traders often make large moves near expiry dates, especially in options markets with **high open interest**.
### **Practical Example:**
Let’s say you are analyzing the **Nifty 50 index** using an option chain:
- **PCR Analysis**:
- The PCR is **1.5**, suggesting that there are more put options than call options. This could indicate **bearish sentiment** in the market, meaning many traders expect a downward movement.
- You observe that the **Nifty 50** is trading at **12,000**, and there’s significant open interest at the **12,500 strike price for calls**. This suggests that many traders believe Nifty might rally up to that level.
- **Trade Decision**: If you are a **bullish trader**, you might look for an opportunity to buy a **call option at 12,200**, expecting the index to rise towards 12,500. You could also use the **PCR** to confirm your trade by verifying that the sentiment is beginning to turn more neutral or bullish.
### **Summary:**
The **Option Chain** and **Put-Call Ratio (PCR)** provide valuable insight into market sentiment, supply and demand, and potential price movements. By using these tools, you can:
- Gauge overall market sentiment (bullish or bearish).
- Identify key support and resistance levels based on open interest.
- Spot opportunities for trend reversals or breakout trades.
- Manage risk by observing extreme PCR values and monitoring implied volatility.
The key to using the Option Chain and PCR effectively is to combine them with other technical and fundamental analysis tools. It is also important to monitor changes in open interest and volume for a clearer understanding of how institutional traders are positioning themselves.

how to become a successfull trader ?Becoming a **successful trader** requires a combination of knowledge, skills, discipline, and a good mindset. Trading is not about getting rich quickly; it's about being consistent and making informed decisions. Here's a comprehensive guide on how to become a successful trader:
1. Develop a Strong Understanding of the Markets**
**Learn the Basics**:
- **Understand Different Markets**: Learn about the different types of markets you can trade in: stocks, forex, commodities, cryptocurrencies, and others.
- **Market Structure**: Understand how the markets work, how prices move, and what factors influence price movements (e.g., economic data, earnings reports, political events).
**Study Trading Styles**:
- **Day Trading**: Buying and selling within a single day.
- **Swing Trading**: Holding positions for a few days to weeks.
- **Position Trading**: Longer-term approach, holding positions for weeks, months, or even years.
- **Scalping**: Very short-term trades, often lasting just minutes, capitalizing on small price moves. Each style requires a different strategy, timeframe, and risk tolerance.
2. Develop a Trading Strategy**
**Plan Your Approach**:
- **Create a Trading Plan**: Your trading plan should define your goals, risk tolerance, the markets you'll trade, your strategy, and the rules for entering and exiting trades.
- **Set Clear Entry and Exit Points**: Identify signals that will guide your decisions (technical indicators, price action, chart patterns, etc.).
- **Risk-to-Reward Ratio**: Ensure your strategy offers a positive risk-to-reward ratio (e.g., risking $1 to potentially make $2).
**Use Technical and Fundamental Analysis**:
- **Technical Analysis**: Involves using charts and technical indicators to predict future price movements. This includes trends, support and resistance levels, moving averages, RSI, MACD, and others.
- **Fundamental Analysis**: Involves analyzing the financial health and intrinsic value of an asset, looking at earnings reports, interest rates, GDP data, etc.
**Backtesting**:
- Before you start live trading, backtest your strategy on historical data to see how it would have performed. This will help you refine your strategy and reduce the chances of losses.
3. Learn and Use Risk Management Techniques**
**Risk Management is Key**:
- **Risk per Trade**: Never risk more than a small percentage of your trading capital on a single trade (e.g., 1-2%). This protects you from major losses.
- **Stop-Loss Orders**: Use stop-loss orders to automatically sell a position if the price moves against you. This helps protect your capital.
- **Position Sizing**: Adjust the size of your positions based on how much risk you're willing to take. If you're risking 1% per trade, your position size should be adjusted accordingly.
**Diversification**:
- Spread your risk by trading different assets or using different strategies. This prevents you from losing everything in one market or asset class.
**Avoid Overtrading**:
- Don’t feel the need to trade all the time. Sometimes doing nothing is the best decision. Only trade when your strategy aligns with market conditions.
4. Develop a Strong Mental Game**
**Emotional Control**:
- **Stay Calm and Disciplined**: Trading can trigger emotions like fear, greed, and excitement. Learning how to control these emotions is essential for success. Emotional trading is often the cause of major losses.
- **Stick to Your Plan**: Don't deviate from your strategy based on emotions. Even if you're losing or missing opportunities, staying disciplined is the key to long-term success.
**Patience is Key**:
- **Trade with a Long-Term View**: Don't expect to make huge profits in the short term. Building wealth through trading takes time. Focus on consistent, smaller gains rather than trying to hit big wins.
**Learn from Mistakes**:
- **Keep a Trading Journal**: Record every trade you make—why you entered, why you exited, and what the outcome was. This helps you identify patterns in your trading and learn from your mistakes.
**Avoid the "Fear of Missing Out" (FOMO)**:
- The market is always full of opportunities. Avoid chasing trades when they don’t fit your strategy just because you feel like you might miss out. Stick to your trading plan.
5. Continuously Educate Yourself**
**Markets Evolve**:
- The financial markets are constantly changing, and new strategies, tools, and technologies emerge all the time. You need to stay updated.
**Read Books and Take Courses**:
- Books like **"Market Wizards" by Jack Schwager**, **"The Intelligent Investor" by Benjamin Graham**, or **"A Random Walk Down Wall Street" by Burton G. Malkiel** are good starting points.
- Online courses, webinars, and seminars from reputable trading educators can provide valuable insights.
**Follow Expert Traders**:
- Follow experienced traders on social media, read their blogs, and watch their analysis. This will expose you to different viewpoints and strategies.
6. Start Small and Scale Gradually**
**Start with a Demo Account**:
- Many trading platforms offer demo accounts where you can practice trading with virtual money. Use this to test strategies and get comfortable with the platform before risking real capital.
**Start with a Small Amount**:
- Once you begin live trading, start small. Avoid risking large amounts of capital until you're more experienced. As you gain confidence and refine your strategy, you can gradually increase your position sizes.
7. Keep Track of Your Performance**
**Review Your Trades**:
- At the end of each week or month, review your trades. Did you stick to your strategy? What worked and what didn’t? Identify the areas where you can improve.
- **Performance Metrics**: Track your **win rate**, **average profit/loss**, **risk-to-reward ratio**, and **drawdowns** to measure your performance and identify trends.
**Adapt and Improve**:
- Be flexible and willing to adapt your strategy as you learn from your experiences. If something is not working, don't be afraid to change it. The best traders are always evolving.
8. Be Prepared for Losses**
**Losses Are Part of Trading**:
- Accept that losses are a natural part of trading. Even the most successful traders experience losses. The key is to ensure that your profits outweigh your losses over time.
**Focus on Long-Term Consistency**:
- Don’t let a few losses discourage you. Focus on making sound decisions and maintaining consistency. Compounding small profits over time can lead to significant gains.
9. Use Technology and Automation**
**Trading Platforms and Tools**:
- Use advanced **trading platforms** that provide charting tools, real-time data, risk management features, and backtesting capabilities (e.g., MetaTrader, TradingView, ThinkOrSwim).
**Automated Trading**:
- As you become more experienced, you can experiment with **algorithmic trading** or **automated trading bots** to implement your strategies. These can execute trades for you based on predetermined criteria, reducing emotional decision-making.
10. Build a Trading Routine and Stick to It**
**Consistency is Key**:
- Develop a daily routine that includes chart analysis, strategy development, reviewing your previous trades, and mental preparation.
**Set Realistic Goals**:
- Set daily, weekly, and monthly profit/loss goals. Make sure your goals are realistic based on your skill level and capital. Aim for steady growth rather than overnight success.
*Conclusion**
Becoming a successful trader is a journey that requires dedication, continuous learning, and a disciplined approach. **Education**, **risk management**, **emotional control**, and **persistence** are all key to long-term profitability. It’s a marathon, not a sprint.
By following these steps, practicing regularly, and learning from both your successes and mistakes, you can improve your trading skills and increase your chances of success in the markets. Start small, stay patient, and always remember: consistent, controlled, and informed decision-making is the true path to success in trading.

Wipro cmp 317.00 by Weekly Chart viewWipro cmp 317.00 by Weekly Chart view
* Resistance Zone 307 to 317 Price Band
* Volumes closing in on avg traded quantity over past few weeks
* Weekly basis Support at 289 > 261 > 233 with Resistance at 340 > ATH 369.90
* Bullish Cup & Handle and/or Double Rounding Bottoms or a very faintly applicable Head & Shoulders pattern done by the neckline at Resistance Zone, as one may interpret

WIPRO! SHORT!! Wipro Ltd is a global leader in Information Technology (IT), consulting, and Business Process Services (BPS). It ranks as the fourth largest Indian player in the global IT services industry, following TCS, Infosys, and HCL Technologies.
Sales Growth: Over the past five years, Wipro has experienced a relatively poor sales growth of 8.75%.
Dividend Payout: The company has maintained a low dividend payout ratio of 12.2% of profits over the last three years.
Technical Analysis:
Bearish Engulfing Candlestick Pattern: A bearish engulfing pattern formed at the top in Weekly Timeframe, indicating a potential reversal in the stock's down trend.
Entry : @ 300 to 305 Range for shorting
Stop Loss : 315
Target : 285 to 275 ++
Strategy: One can take 300 PE FEB month Expiry or Short the Future.
Let me know what you think about this analysis.
Happy Trading!

A strong rounding bottom pattern formed in Wipro chartStrong Positive chart in the Weekly chart, also put it into your watchlist.

Wipro's Steady Climb with Cautionary Signals Topic Statement:
Wipro's recent strong quarterly performance has led to a significant surge in its stock price, indicating a potential bullish trend.
Key Points:
1. The company reported a robust 24.6% QoQ profit growth for the third quarter.
2. The stock is trading in an up-trending channel, making channel trading convenient.
3. A double top pattern has emerged, indicating potential resistance.
4. Buying at the lower end of the channel, near the 180-day moving average, offers an oversold entry point.

WIPRO Stock analysis💠💠Stock name - WIPRO💠💠
👉👉CMP /- 320
⏰Weekly Timeframe chart,
📊 Key Insights:
📢 Support at 279 🛡️
📢 Resistance at 349 🚧
📉Formation of a CUP + Handle + breakout + Retest!
✅ Educational purpose.

Wipro: Resilient Recovery Back Into the Ascending ChannelWipro has shown impressive strength recently, bouncing back into its well-established ascending channel on the daily chart. Here are the key observations:
Channel Recovery:
After briefly dipping below the channel on January 17, the stock quickly recovered and closed back within the channel the very next day, demonstrating strong buying interest at lower levels.
Current Momentum:
The stock is trading near the upper half of the channel, indicating bullish momentum.
The breakout attempts suggest that buyers are dominating at current levels.
Support and Resistance:
The lower boundary of the channel around ₹290 acts as strong support.
Immediate resistance is seen at ₹320, near the upper edge of the channel. A breakout above this level could lead to further gains.
Indicators:
The RSI is trending upwards and is currently above the neutral zone, supporting the bullish outlook.
A sustained move above ₹320 could push the RSI into overbought territory, requiring cautious optimism.

Wipro Looking for SupportHello friends good evening, I have prepared a chart for one of my trades in Wipro which I am sharing with you all. So as we can see the Wipro ADR ( American Depository Receipt) listed in the American market is trading down by 4 to 5 percent. In such a situation we can expect that we may see a similar decline in the price of Wipro shares tomorrow or in the coming session. Therefore I have marked a demand zone on its weekly chart and hope that the price will get a bounce from this demand zone, which will be helpful for us to trade on the long side.
Different traders follow different setups and indicators to understand support bounce, I would like to understand it only through price action on smaller time frames and will update accordingly.
I hope you liked the idea if yes then please like and share it, thank you all.
Best Regards- Amit.

Wipro halting after a gap up opening.Wipro is showing some good chart pattern. The stock has given a gap up opening and took resistance form 303-305 levels.
Watch for a restest of the break out for entry or enter once the resistance levels is breached.
Resistance levels ;- 304, 309.5
Support ;- 294.6, 287.5
Wait for a price action and trade accordingly.

Aggressive Short call on WiproNSE:WIPRO Aggressive Short call on Wipro hovering near support zone if broken can give good swing, with MACD Showing Weakness, This is Purely Aggressive Trade and its Results are around the corner.
Trade Setup:
It can be a Good 1:1 RISK-REWARD Trade for Aggressive Swing Trader.
Target(Take Profit):
Around 262 to 265 Levels for Swing Trade.
Stop-Loss:
Around 309-313 or When Breaches 20 DSMA For Swing Trade.
📌Thank you for exploring my idea! I hope you found it valuable.
🙏FLLOW for more
👍BOOST if useful
✍️COMMENT Below your views.
Meanwhile, check out my other stock ideas below until this trade is activated. I would love your feedback.
Disclaimer: This analysis is intended solely for informational and educational purposes and should not be interpreted as financial advice. It is advisable to consult a qualified financial advisor or conduct thorough research before making investment decisions.

Wipro Stock Price#wipro shares opened strong today, as Q3 results were OK-ish. Wipro share price may reach it previous HIGH as breakout today seems strong today
#learn_at_stoxsense #Learntradingwithsudhir #StockMarket #wipro

Wipro is in good rangeAny 1 can buy Wipro between 277-273 for the target of 315 . I m not a sebi register. It's my opinion plz consult your financial advisor before investing

Expecting fall in wiproWipro may fall from here
As market is falling and it is taking support at trendline, causing new buyers to to enter in trade.
Best place for SL hunting

Wipro Ltd view for Intraday 13th Jan #WIPRO
Wipro Ltd view for Intraday 13th Jan #WIPRO
Resistance 302-303 Watching above 303 for upside movement...
Support area 295 Below 299 ignoring upside momentum for intraday
Watching below 295 or downside movement...
Above 299 ignoring downside move for intraday
Charts for Educational purposes only.
Please follow strict stop loss and risk reward if you follow the level.
Thanks,

Wipro Buy Idea: Trend Line Breakout on 1-Hour Timeframe Wipro has broken a key trend line on the 1-hour chart, signaling a potential trend reversal. Consider buying around ₹295 after confirmation of a reversal on lower timeframes (e.g., 15-minute chart). The target is set at ₹310, with a suitable stop-loss below ₹290 to manage risk. [/

Wipro Date : 08-01-2025
Wipro
Timeframe : Weekly
Remarks :
1 Buy opportunity at neckline of rounding bottom if it retrace till there
2 Buy opportunity at RSI mean reversion of 51 + 20 ema support & closes above
3 Buy opportunity at breakout of support/resistance zone as market based on Q3 results
Regards,
Ankur

Wipro LtdThe chart of Wipro Ltd. (NSE) displays a classic cup and handle pattern, signaling a bullish continuation with a potential breakout above the ₹400 resistance. The rounded "cup" indicates long-term accumulation, while the "handle" represents short-term consolidation. Currently trading near ₹305, aggressive traders can consider entering now with a stop-loss below ₹280, targeting ₹360–₹400 initially. Conservative traders should wait for a confirmed breakout above ₹400 with strong volume, aiming for ₹450–₹500, using a stop-loss below ₹380 post-breakout. Alternatively, a pullback to the ₹280–₹290 range offers a favorable entry for long-term positions, with a stop-loss below ₹270 and targets aligned with the pattern's breakout potential. Monitoring volume and RSI momentum will be key to validating the breakout.
