Triangle Breakout seen in India's 4th largest IT Services StockHello everyone, i hope you all will be doing good in your trading and your life as well, i have brought a large cap IT sector stock which has given Triangle Pattern breakout, and price is still sustaining above the breakout area, in yesterday's session we have seen neckline breakout, and today's price has come to retest the breakout.. A high probability trade is waiting from here, all levels i have given on chart like entry exit and targets. IT sector moment is supporting now a day's. Specially Midcap IT is on fire, i will try to bring some midcap stocks as well, but for now focus on nifty 50 stock.
Technically stock is looking good on chart, MACD is also giving bullish crossover.
RSI also giving bullish crossover, price is above 200-DEMA. (I have not placed any indicator on chart, but i have done my analysis before to publishing the idea.)
Stock is good to go long for short term to long term as well, we all know how wipro helped their investor to make them Billionaires, who invested in early 80's.
So the stock is same, still it has charm to give returns like it does earlier, but you have to be patience in it.
Market Cap
₹ 2,56,398 Cr.
Current Price
₹ 490
High / Low
₹ 546 / 375
Stock P/E
23.2
Book Value
₹ 143
Dividend Yield
0.20 %
ROCE
17.2 %
ROE
14.5 %
Face Value
₹ 2.00
Industry PE
29.7
Debt
₹ 16,465 Cr.
EPS
₹ 21.1
Promoter holding
72.9 %
Intrinsic Value
₹ 243
Pledged percentage
0.00 %
EVEBITDA
13.6
Change in Prom Hold
-0.01 %
Profit Var 5Yrs
4.17 %
Sales growth 5Years
8.75 %
Return over 5years
11.6 %
Debt to equity
0.22
Net profit
₹ 11,112 Cr.
ROE 5Yr
17.3 %
Profit growth
-2.69 %
Disclaimer:- Please always do your own analysis or consult with your financial advisor before taking any kind of trades.
Dear traders, If you like my work then do not forget to hit like and follow me, and guy's let me know what do you think about this idea in comment box, i would be love to reply all of you guy's.
Thankyou.
WIPRO trade ideas

Wipro 1WWipro looking bullish. yesterday broke a level of 545 on daily TF. Per my analysis, it seems to hit a target of 616 and 726. keep the SL at 526.

INVESTMENT PICK - WIPRO - TREND REVERSAL LONG ENTRIESSymbol - WIPRO
Wipro Ltd is a global Information technology, consulting and business process services (BPS) company. It is the 4th largest Indian player in the global IT services industry behind TCS, Infosys and HCL Technologies.
Wipro was in consolidation & accumulation phase from July 2022 to December 23.
After that it broke out of this consolidation zone with good buying volumes & went till 550. Now it is retracing back to breakout zone which is 450.
Wipro is a company with good fundamentals so it can be considered for medium to long term investment.
Wipro CMP - 452
It can be accumulated at current level for long term Investment perspective.
More position can be added at 410 - 415 levels.
Stoploss can be 350 or below 350.
Targets can be 545, 600 & 720 which represents 21%, 35% & 58% upside from current level respectively.
Disclaimer - Do not consider this as a buy/sell recommendation. I'm sharing my analysis & my investment position. You can track it for educational purposes. Thanks!

WIPRO Weekly Charts suggest 35% upside in 10 Months.WIPRO Weekly Charts suggest 35% upside in 10 Months.
Weekly Charts is showing Rounding Bottom Formation. Trend is on upside now. Expect stock to show higher highs inn coming days.
LTP - 515
Target - 715
SL - 490
Risk Reward Ration - 1:8 - Excellent.
Time frame - 8-12 Months
Happy Investing

Cup and handle Pattern Breakout Long WIPRO #@ 555IT result reaction is perfect for Investment , wipro will give us a great chance of getting good return, medium to long term. Entry : 555 Stop : 514 Target : 616 and 718

WIPRO Movement above 500 can lead to stated targets.
SL : 440 (base)
(Will trail acroding in line with Targets

Wipro on the verge of breakout.as per my analysis the 2 targets for Wipro if breakout achieved. this is not financial advice. please do your on study before investing. thank you.

LongSuperb sector+ stock for upcoming days..
Blue chip stock
Near breakout lewel
Only for education purpose....

WIPRO READY TO BROKEN MONTHLY CUP AND HANDLE PATTERNWipro was strong on Monthly and weekly chart's ready to broken a long term cup and handle pattern.

Wipro at important level looking good to go longWipro has taken support from from 200 ema
and 0.68 FIB lvl
and as well at an important lvl on Weekly TF
Looking good for long once cross 18 ema

WIPRO Cup and Handle break out after Rs. 5501. WIPRO has completed Cup & Handle pattern successfully.
2. Wait for Break out above Rs.550.
3. Recently we have seen increased volume also.
4. Trading above 30 EMA on weekly timeframe.
5. One can enter on break out above Rs. 550 (at own risk) for a target of Rs. 721 within 3 - 4 months time.
6. Keep a strict stop loss at Rs 525 after which short term trend will become weak.

Wipro in uptrendWipro has finished the correction and now resumed the upside.
It would be a good opportunity to buy it on dips when the risk to reward ratio is favourable.
Will keep you guys posted

Wipro near Cup & Handle Breakout on WeeklyWipro is having a long history of growth and revival.
Recently formed a Base, and now forming Cup & Handle Pattern on Weekly Charts
An investment for duration of 2-3 Yrs can give a good return.

Wipro is near to a break-out.Buy near 540
Target: 600+
It is clear from the trend line that Wipro is about to break out near 540.

WIPRO WIPRO good time to consider entering a long position
however, it essential to do your research, should follow stop loss

WIPRO's Bull Run: A Favorable Risk to Reward OpportunityIn my previous post, I emphasized that the broader IT Index has the potential to outperform the market as it enters the minor 3rd wave of the major 5th wave. Among the various stocks in the indices, WIPRO appears to have a more favorable technical setup, which could result in a significant gain of approximately 40%-50% over the next 6-8 months. The decision to choose WIPRO is based on several parameters:
1. Wave Analysis - WIPRO has recently entered the 3rd wave.
2. Price action -The previous two-year consolidation was successfully retested
3. There are fewer upward resistance points (only two main supply and resistance zones).
4. The risk-reward ratio is 1:3.3, which is considered very healthy.
All the necessary information for entry, stop loss, target, and wave count can be found on the chart. We will closely monitor the stock movement and provide updates accordingly. However, it is important to remain cautious of the upcoming US election, as the IT industry is more influenced by and dependent on the US economy than the Indian economy.
Disclaimer: Please note that the information presented in this analysis is intended for educational purposes only. It is highly recommended to seek advice from a financial advisor before making any investment decisions. I cannot be held accountable for any financial losses that may arise

Bullish Cup and Handle Pattern: Wipro Heading Towards 545Details:
Asset: Wipro Limited (WIPRO)
Pattern: Cup and Handle
Breakout Level: Above handle resistance (specific level not mentioned, assuming current resistance)
Potential Target: 545
Stop Loss: Below breakout level or as per risk tolerance
Timeframe: Short to medium-term
Rationale: Wipro Limited (WIPRO) is forming a cup and handle pattern, which is a bullish continuation pattern. A breakout from the handle could indicate the potential for a significant upward move towards the target of 545.
Market Analysis:
Technical Pattern: The cup and handle pattern is a bullish formation that typically signals further upside. Breaking out from the handle suggests a resumption of the prior uptrend.
Market Sentiment: Positive market sentiment or company-specific catalysts may be supporting the anticipated breakout in WIPRO.
Price Target:
The target for WIPRO is set at 545, based on the cup and handle pattern breakout.
Risk Management:
Implementing a stop loss strategy below the breakout level (handle resistance) is crucial to manage risk in case of unexpected price reversals.
Timeframe:
The projected move towards 545 is based on a short to medium-term outlook, but actual timing may vary based on market conditions.
Risk-Reward Ratio: Consider individual risk tolerance and adjust position size accordingly to maintain a favorable risk-reward ratio.
As with any investment opportunity, conduct thorough analysis and consider factors such as market trends, company fundamentals, and risk management strategies before making trading decisions.

WIPRO Multiyear breakout#nifty50 Stock ready for rally 🔥
✍️High Potential 3-year Breakout
✍️Expecting 20 to 30 % within a year
🔥PE Ratio - 25
💵1 year CAGR- 30%
#BreakoutStock #stockmarket #StockMarketindia #multibagger #StocksToBuy #StocksToWatch
#gold


Long _WiproCurrently Wipro trading @ Good support in monthly timeframe.
Sep_2024 Futures is bet @ monthly timeframe.
Pros:- Bullish Engulfing @ Support.
Stock consolidation for almost 2 years and breakout above monthly high will give good rally
till 600.
Cons:- Nasdaq closed negative from ATH.
Happy Trading!! Only for educational purpose.

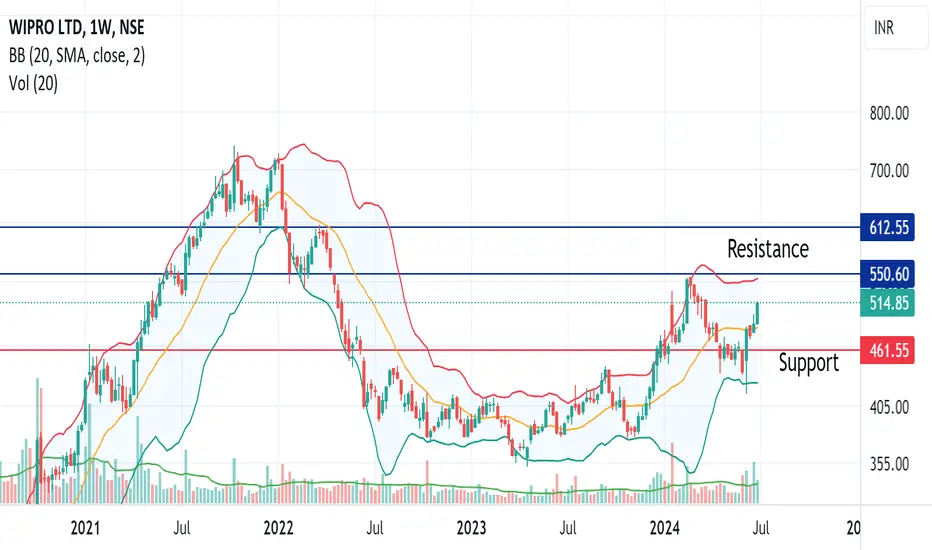
Breakout Stock: WIPROOn Weeklay Chart Wipro has given a Breakout
Strong Momentum: Price above short, medium and long term moving averages
Key Resistance: 550, 608
Support: 440
Wipro is ready to form Cup and handle pattern on weekly chartMajor stock in Nifty IT also showing uptrend after continous down fall. One can enter into it as swing or positional trading.

WIPRO, Technical Outlook (Keep this stock in the watch list)Today the price has closed on the resistance level with a RSI of above 60. All this indicates the price is in good momentum.
The breakout of 492 could open the higher levels of 545.
Disclaimer: This is my pre market analysis and my trading journal. Not a suggestion to buy or sell.
