Wipro creating good swing trade in weekly time frame Wipro creating good swing trade in weekly time frame
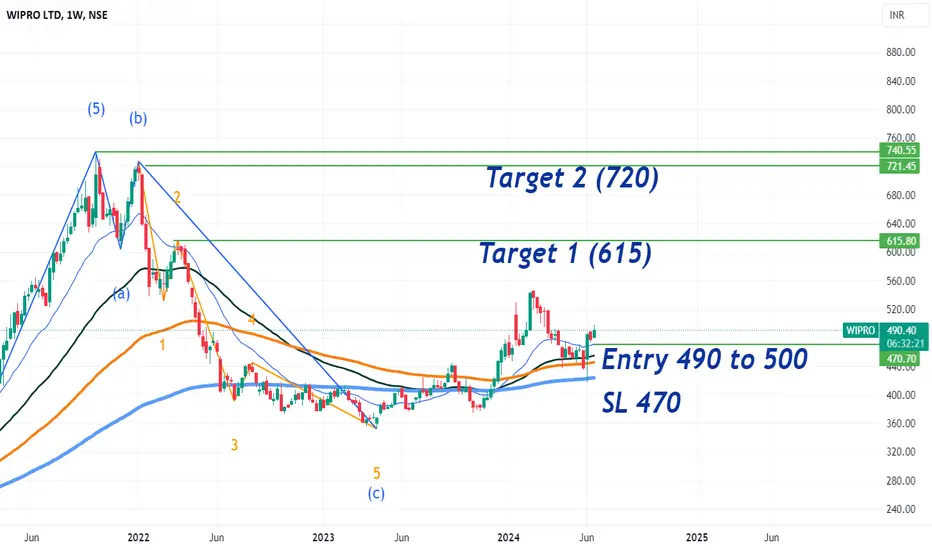
Price consollidation near 200 EMA since 2 years and time to breakout consolidation upper zone.
As per wave theory its ready to create fresh 12345 in weekly time frame and 5 of Monthly time frame.
WIPRO trade ideas
Buy Wipro for a target of 540Wipro has given breakout from a strong resistance zone,Buy Wipro for a target of 540 in 10 trading sessions

Wipro-An amazing opportunity to enter a bluechip stock!Wipro had a strong resistance of 450 which broke and is now acting as a support.
Since Nifty IT is looking bullish, we can expect a reversal in this stock.
An amazing investment stock available at a very good price.


#Wipro important support and resistance levels#Wipro important support and resistance levels
Swing target 500/515/545
#swintrading #wipro


Wipro formed Big Bullish candle on Weekly TFIT Sector witnessed strong momentum in last week
Wipro took support around prev week lows & came near 480 level
It may come for retesting levels, track for Bullish pattern with all confirmations
Downside imp support is placed around 450
whereas upside hurde is at 495/495 zone
Learn and P ractice Price Action Setups

Trendline line Breakout in WIPROTrendline Breakout
RSI near 65 and rising
Trading above EMA50
Volume spurt
4 months of consolidation
Disc: for study, not a recommendation

Wipro @ SupportCurrently Wipro is showing Good possibility upside of 25 - 30% upside.
Bullish candle confirmation at Support along with Natural barrier 200 EMA.
Go long in Equity in next candle 🕯️ Open and wait for Entry in daily Timeframe to get opportunity in F&O.
Happy Trading!! Only for Educational Purpose.


Wipro Stock AnalysisIT Sector seems to be bottoming out and might be preparing for a bull run. That's why I have picked a WIPRO as the next stock to perform well.
In the recent months IT stocks have corrected after a bull run and also have consolidated for significant time.
Talking about the particular WIPRO stock. the consolidation phase may eliminate once the stock surpasses above 463.✅✅
Entry: 463✅✅
SL: 448❌❌
TGT 1: 493🔥🔥
TGT 2: 545📈📈
Note: Do your own analysis before executing a trade.

Wipro Technical Outlook | 20-May-2024
Daily tf: Trend Negative, as long as the price is below LTMA Band.
Weekly tf: Trend Neutral, Compression Zone
Disclaimer: This is my pre market analysis and my trading journal. Not a suggestion to buy or sell.

Wipro Bearish viewAs per Data analytics and price action it may retest 455 to 460 levels and take reversal and if it comes to 445 to 450 it will take support. Just a view not a reco..

1.5 years long bullish Inverted Head & Shoulder Breakout A Bullish Breakout of Inverted Head and Shoulder pattern is visible on the Daily chart of NSE:WIPRO
The shoulder is exactly at 0.236 fib retracement level. and the target is nearly at 0.50 fib level.
MACD gave Positive crossover on Daily, Weekly and Monthly chart. So, expecting the momentum to continue.
One can create a fresh position in the scrip as per the levels mentioned on the chart.
Risk Disclaimer:
The information provided in this analysis is based on my personal interpretation of market conditions and the available data at the time of writing. It is advisable to seek advice from a qualified financial professional and to conduct your own research before making any investment decisions.


WIPRO LTDWipro LTD
Wipro will be considered coming out of zone if it opens above 468 and sustains it.
In that scenario a Stoploss can be placed below 453 levels.
Targets Should be around 490 and target should be around 518

Stock to focus this weekThe price has successfully completed its cycle of expansion and compression.
And the price is trading in a small range during five trading sessions.
From these levels the price has a high tendency to move in either direction.
Keep an eye on this stock.
Disclaimer: This is my pre market analysis and my trading journal. Not a suggestion to buy or sell.

WIPRO LTD ANALYSIS 19 MAR 24 LONGWIPRO LTD ANALYSIS 19 MAR 24 LONG
This analysis is purely for educational purpose only
currently wipro is trading around 462.55
R:R- 1:2.5
i believe that this stock will give (7%-17.9%) returns in coming weeks
Investment type :- short term investment 1-3 months
entry zone willl be : 455.40- 468.00
bullish levels will be
level1 :- 480.10
level2 :- 491.60
level3 :- 517.80
level4 :- 545.75
Stop loss will be 429.40 for detailed view you can check chart how price action works

Wipro - Buy for target of 650Wipro is seen taking support at key area and several Buy calls for target of 650 to 700 in 1 yr looks good value buying now before its run up any time.

#Wipro cash : Looks good above 467.50 and 476.10#Wipro cash -Positional call
16.05.2024
Looks good 50% above 467.50
& 50% above 476.10
Stoploss 435
Target 540/640/720
Cmp 465

Wipro reversal seen on weekly chart1. MACD likely to reverse from zero line.
2. RSI likely to cross yellow line.
3. Taken support at previous resistance 452 or 448.
So, 460, 470 and 480 call options are good for coming days. Or one can buy 500 call option of Jun series @ Rs 8.

WiproHello ,
price is traded at support area so it s possible chance that price will move upper side
after breaking of trendline entry will be possible
Stop loss will below trendline support area
This idea is for Educational purpose and paper trading only. Please consult your financial advisor before investing or making any position. Facts or Data given above may be slightly incorrect. We are not SEBI registered.

WIPRO Short Trade RecapToday we have a Breakdown of the STMA band with a strong momentum.
The degree and nature of separation in both bands shows a bearish trend.
So, I plan a short trade with a stop loss of candle high and target of recent low.
Disclaimer: This is my pre market analysis and my trading journal.
Not a suggestion to buy or sell. This is only for educational purposes.
Thanks
