Part 2 Support and ResistanceWhy Use Options?
Options provide traders with:
Leverage: Control a large position with a smaller investment.
Flexibility: Create strategies for any market scenario.
Risk Management: Hedge against adverse price movements.
Income Generation: Sell options to collect premium.
Simple Options Trading Strategies
These strategies are suitable for beginners. They involve limited positions and simple risk-reward profiles.
Long Call
Outlook: Bullish
How it works: Buy a call option when expecting price to rise.
Risk: Limited to premium paid.
Reward: Unlimited upside.
Example: Stock trading at ₹100, buy a call with strike ₹105 for ₹3 premium. If stock rises to ₹120, profit = (120–105–3) = ₹12.
Long Put
Outlook: Bearish
How it works: Buy a put option when expecting price to fall.
Risk: Limited to premium paid.
Reward: Potential profit increases as price drops (limited to strike price minus premium).
Example: Stock at ₹100, buy a put strike ₹95 for ₹2. If stock falls to ₹85, profit = (95–85–2) = ₹8.
Covered Call
Outlook: Neutral to mildly bullish
How it works: Own stock and sell a call against it.
Risk: Downside risk in stock, upside capped at strike.
Reward: Earn premium income.
Protective Put
Outlook: Hedge
How it works: Own stock and buy a put to protect downside.
Risk: Limited (stock downside hedged).
Reward: Unlimited upside, protection from losses.
QQQ trade ideas

Part 2 Ride The Big MovesDisadvantages of Options
Complexity for beginners
Time decay risk (premium can vanish)
Unlimited risk for sellers of uncovered options
Requires active monitoring for effective trading
Tips for Successful Options Trading
Understand the underlying asset thoroughly.
Start with basic strategies like long calls, puts, and covered calls.
Use proper risk management and position sizing.
Keep track of Greeks to understand sensitivity.
Avoid over-leveraging.
Monitor market volatility; high volatility can inflate premiums.
Use demo accounts or paper trading for practice.

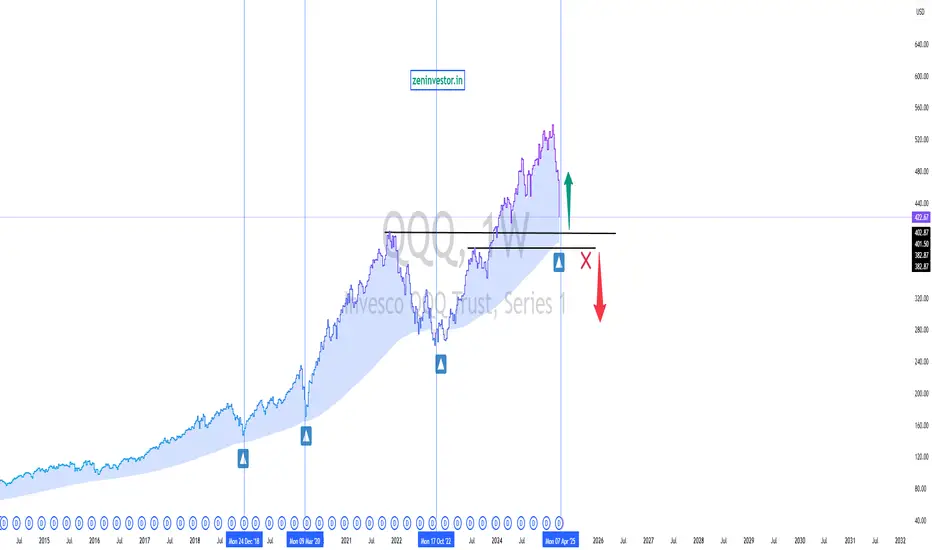
QQQ approaching a long term support area. Will it reverse?NASDAQ:QQQ approaching a long term support area. Will it reverse from here? from 2018 this support zone in weekly is the majour reversal point for bulls. Will history repeat?
Breaking this zone going to be more painful and long term bearish sentiment will emerge.
This is purely a price action educational chart and not a buy or sell reco.
in the verge of the unkownwe have here the QQQ that sometimes will break this 2 week line. So it will be today , who knows ! Im not betting, maybe to the upside TLT probably market will go up today, then down drastically, who knows,but thats my bet.

FintechZoom QQQ Stock Price AnalysisThe QQQ stock has surged more than 8% from last Monday's lows, which were marred by panic selling due to the collapse of the Japanese stock market and fears of a U.S. recession. Does this rally signal that the fears have dissipated? Not necessarily.
Currently, the price is hovering near a resistance zone formed by the median line of the channel (indicated in yellow) and the descending fan line. It's no surprise that the market is showing signs of uncertainty—it's not just about the release of inflation data; the actual CPI numbers came in close to analysts' expectations.
Take a closer look at the April 1st candle—price dropped with little to no support, forming a wide-ranging candle with a close near the lows, a clear indication of weak demand at levels above $460.
Analyzing the profile, it's evident that sellers were in control on April 1st, particularly around the $464.85 area. Today, QQQ found resistance at this very level.
After the rally of over 8% from last Monday's lows, I anticipate that QQQ might experience a short-term correction. The low from Tuesday, which formed after a bullish gap relative to Monday's close on August 12th, is expected to act as a support level.
Forecasts
Analysts' forecasts for QQQ stock are varied. Some predict continued strength if the broader market stabilizes, while others expect potential pullbacks given the recent volatility and economic uncertainty. The consensus price targets range, with some seeing further upside potential and others cautioning about near-term resistance.

QQQ Sell setupQQQ rose steeply due to great earnings response from Apple and jobs data today. We are currently at the 61.8% (435.52) of the earlier down move.
Huge gap (427 - - - 434.50) left out due to the premarket open moves.
Great trade with a good R/R
Entry at 435.52 | SL 436.75 | TP 431.23
Careful around the 433 point as we may take support days low (since opening)
PS - Ideas are for learning purposes, not a recommendation to trade. I am not responsible for any profits or losses incurred.


Target for SHORTAs per analysis I marked 3 target, easily May get but last one has to check for movement..


QQQ - minor pullback to kijen-sen possibleTD DEMARK sequential indicator flashed a buy setup TD9
Previous TD9 on H1 caused the reversal
So, minor pullback to kijen sen is possible
In addition, the difference between Kijen and price is around 8usd which also makes the pullback plausible.
Stochastic is also at extreme and attempting a bullish crossover.
Monday and tuesday may see some short covering upto Kizen and cloud


QQQWatch how this stock moves through this, which I consider an indicator with which I can know the movement of all the charts

Gap down and run?If we open where things are at as of (Sunday night), looking at lower targets of $335 and $329 this week.

QQQ: Buy only ABOVE 329, SL 317 TGT 345QQQ seems to be a Long trade above 329 with Stop-loss of 317 and a Target of 345. One can look in to Long trade only if it crosses 329.
This is for education purposes only.


QQQ KEY LEVELS SUPPORT AND RESISTANCE 04/06/2020Key Levels for QQQ INVESCO for INTRADAY TRADING are :
Upper Breakout~184.80
First Target~186.10
Interim Resistance~187.70
Final Resistance~189.50
**Lower Levels**
Lower Breakout~182.25
First Target~181.30
Interim Support~179.95
Final Support~178.90
Please trade with caution and consult your financial adviser before trading.

