Reading Fundamentals With TradingView – Reliance EditionWhen you look at a giant like Reliance, the price chart doesn’t tell the whole story.
But TradingView has a few simple fundamentals that help you understand what the company is actually doing behind the scenes.
You don’t need finance knowledge. Just a few basic ideas.
Below is a simple way to read
1.383 CHF
7.29 B CHF
100.82 B CHF
6.77 B
About Reliance Industries Limited
Sector
Industry
CEO
Mukesh Dhirubhai Ambani
Website
Headquarters
Mumbai
Founded
1957
ISIN
US7594701077
FIGI
BBG006TLTKK0
Reliance Industries Ltd. engages in hydrocarbon exploration and production, petroleum refining and marketing, petrochemicals, retail, and telecommunications. It operates through the following segments: Oil to Chemicals (O2C), Oil & Gas, Retail, Digital Services, Financial Services, and Others. The O2C segment includes refining, petrochemicals, fuel retailing through Reliance BP Mobility Limited, aviation fuel and bulk wholesale marketing. The Oil and Gas segment engages in the exploration, development and production of crude oil and natural gas. The Retail segment includes consumer retail and range of related services. The Digital Services segment includes provision of a range of digital services. The Financial Services segment comprises of management and deployment of identified resources of the firm to various activities including non-banking financial services and insurance broking. The Others segment engages in Media, SEZ development, and textile business. The company was founded by Dhirubhai Hirachand Ambani in 1957 and is headquartered in Mumbai, India.
Related stocks

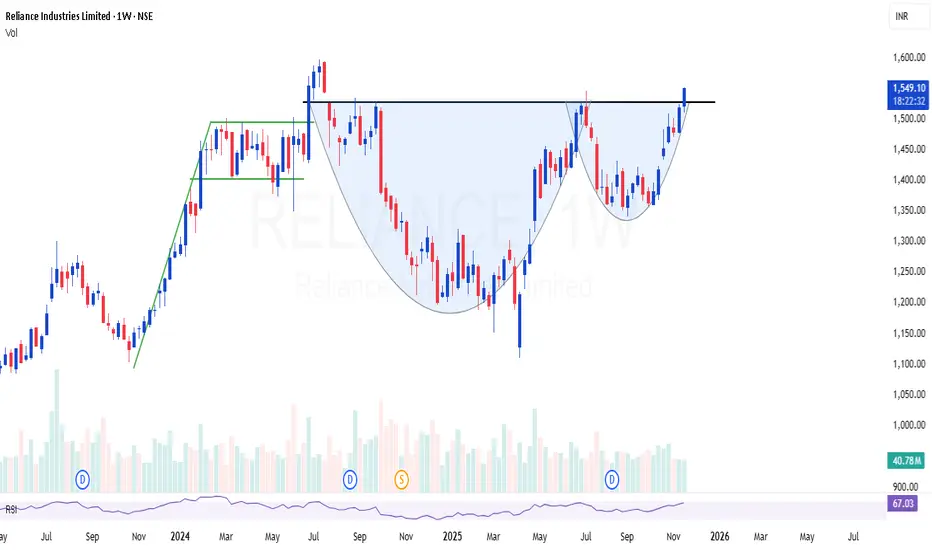
RELIANCE @ 1546 ON WEEKLY GAVE BREAKOUT FROM CUP AND HANDLE. Please note I am not a SEBI REGISTERED , Its mere idea and chart reading analysis. RELIANCE @ 1546, On weekly time frame gave breakout from cup & handle pattern. If it sustain above 1545 for a week, then it can move towards 2000-2200 in 7-9 month.

Unlock Stock Market Gains1. The Foundation: Market Structure Is Everything
Before trying to earn profits, a trader must understand how markets move.
Market structure shows the journey of price through phases—accumulation, markup, distribution, and markdown.
1. Accumulation Phase
Institutions slowly build positions at di

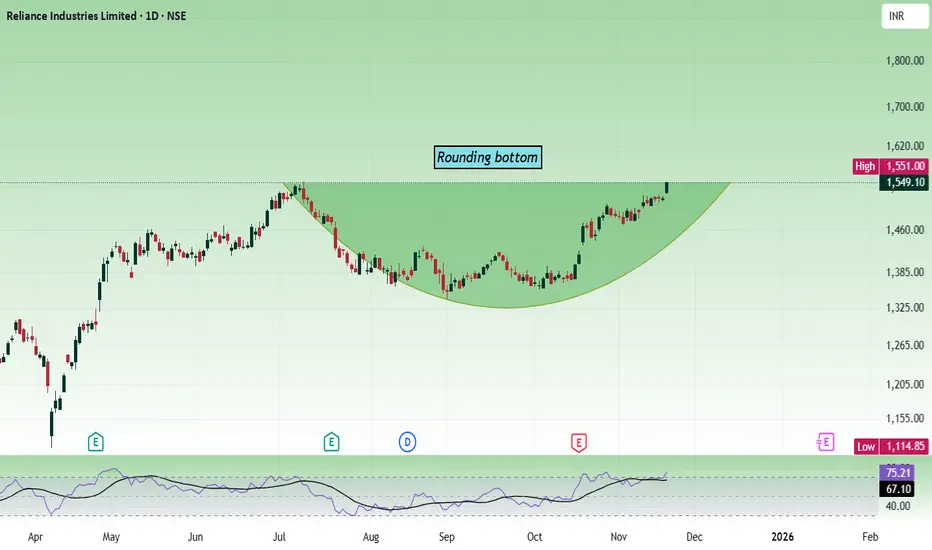
Reliance - Multi time frame analysis...We are going to see the daily and weekly charts. It's beautiful to see how the patterns are aligning.
The daily chart shows, the price has formed a rounding bottom, and right now it is testing the rounding bottom resistance/high.
The weekly chart shows, the price is nearing the cup and handle patter
Reliance- Breakout- Retest- New HighsHello Traders! May today bring clarity, clean setups, and confident execution.
Stay patient and stay profitable.
Reliance has delivered a clean weekly breakout above its horizontal swing resistance, a level that acted as a strong barrier for many weeks.
With this resistance now broken, the price ca

RELIANCE | Perfect cup & handle setup - Looks very strong 30%RELIANCE | Perfect cup & handle setup - Looks very strong for 30% short term
Last time the flag breakout disappointed, but this time Cup & handle will restore the faith i believe
Looks like 2026 is going to be a large cap year !
KOTAKBANK
RELIANCE
TCS
INFY
index heavy weights are super bullish
Part 1 Master Candle Stick Patterns Why Option Buyers Lose More Frequently
Option buyers lose mainly due to:
Time decay
Wrong direction
Lack of momentum
Low probability bets
Emotional trading
Most buyers attempt lottery-like trades in weekly expiries.
This is why professional traders prefer selling strategies.

RELIANCE INDUSTRIES LTD:Likely Cup&Saucer Break OutRELIANCE: Trading at 1530-1540.
Trading above all its Critical moving averages even in weekly chart .
Moreover DEMA has given a golden cross over of 20DEMA in weekly chart shows the strength in the stock.
Reliance has for med a Cup& Handle pattern in weekly chart and RIL holding above 1540-1550 on c

Best buying Opprtunity in Reliance stock Reliance Industries Announces ₹20,000 Crore Green Energy Joint Venture
Reliance Industries Limited (RIL) has partnered with a leading European firm to invest ₹20,000 crore in India’s renewable energy sector.
The joint venture aims to accelerate the development of solar power, wind energy, and gre

Part 2 Support and ResistanceOption Premium Breakdown – Intrinsic vs Extrinsic
1. Intrinsic Value
Actual value if exercised TODAY.
For Call: Spot – Strike (if positive)
For Put: Strike – Spot (if positive)
2. Extrinsic (Time + Volatility)
Value due to time left + expectations.
This is where traders either make or lose mone

See all ideas
Summarizing what the indicators are suggesting.
Oscillators
Neutral
SellBuy
Strong sellStrong buy
Strong sellSellNeutralBuyStrong buy
Oscillators
Neutral
SellBuy
Strong sellStrong buy
Strong sellSellNeutralBuyStrong buy
Summary
Neutral
SellBuy
Strong sellStrong buy
Strong sellSellNeutralBuyStrong buy
Summary
Neutral
SellBuy
Strong sellStrong buy
Strong sellSellNeutralBuyStrong buy
Summary
Neutral
SellBuy
Strong sellStrong buy
Strong sellSellNeutralBuyStrong buy
Moving Averages
Neutral
SellBuy
Strong sellStrong buy
Strong sellSellNeutralBuyStrong buy
Moving Averages
Neutral
SellBuy
Strong sellStrong buy
Strong sellSellNeutralBuyStrong buy
Displays a symbol's price movements over previous years to identify recurring trends.
USY72570AL17
Reliance Industries Limited 10.25% 15-JAN-2097Yield to maturity
7.29%
Maturity date
Jan 15, 2097
USY72570AG22
Reliance Industries Limited 10.5% 06-AUG-2046Yield to maturity
7.08%
Maturity date
Aug 6, 2046
RLNGF5335117
Reliance Industries Limited 3.625% 12-JAN-2052Yield to maturity
5.52%
Maturity date
Jan 12, 2052
RLNGF4208883
Reliance Industries Limited 4.875% 10-FEB-2045Yield to maturity
5.44%
Maturity date
Feb 10, 2045
RLNGF5335118
Reliance Industries Limited 3.75% 12-JAN-2062Yield to maturity
5.43%
Maturity date
Jan 12, 2062
RLNGF5059438
Reliance Industries Limited 6.25% 19-OCT-2040Yield to maturity
5.16%
Maturity date
Oct 19, 2040
RLNGF5335116
Reliance Industries Limited 2.875% 12-JAN-2032Yield to maturity
4.59%
Maturity date
Jan 12, 2032
RLNGF4567942
Reliance Industries Limited 3.667% 30-NOV-2027Yield to maturity
4.27%
Maturity date
Nov 30, 2027
USY72570AK34
Reliance Industries Limited 8.25% 15-JAN-2027Yield to maturity
3.88%
Maturity date
Jan 15, 2027
USY72570AF49
Reliance Industries Limited 9.375% 24-JUN-2026Yield to maturity
2.91%
Maturity date
Jun 24, 2026
RLNGF4350421
Reliance Industries Limited 2.06% 15-JAN-2026Yield to maturity
—
Maturity date
Jan 15, 2026
See all RLI bonds
Curated watchlists where RLI is featured.

Downstream oil: Petroleum through the pipes
39 No. of Symbols

Indian stocks: Racing ahead
46 No. of Symbols

See all sparks